There are several types of maps that can be created using 3D mapping technology, each serving a unique purpose.
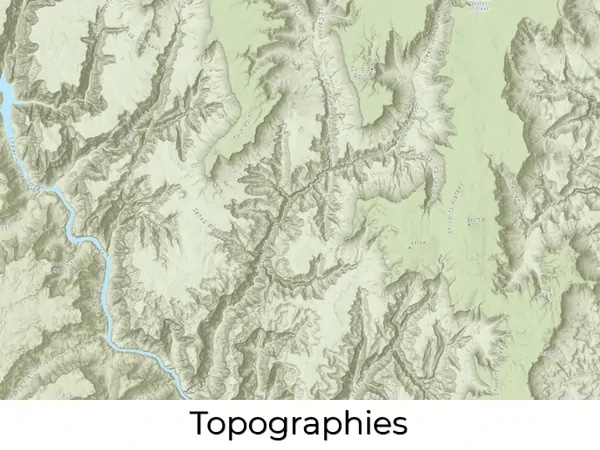
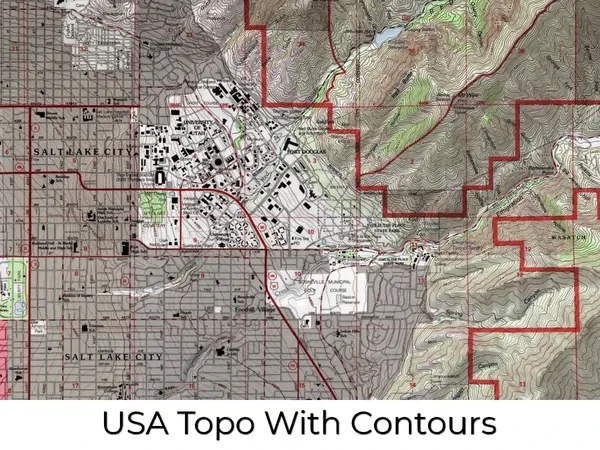
One of the most common types of 3D maps is the contour map. A contour map is a topographic map that shows the elevation of a landscape by using contour lines. These lines represent a constant elevation, and their spacing indicates the steepness of the terrain. Contour maps are commonly used for hiking and mountaineering, as they allow for better navigation and planning of routes.
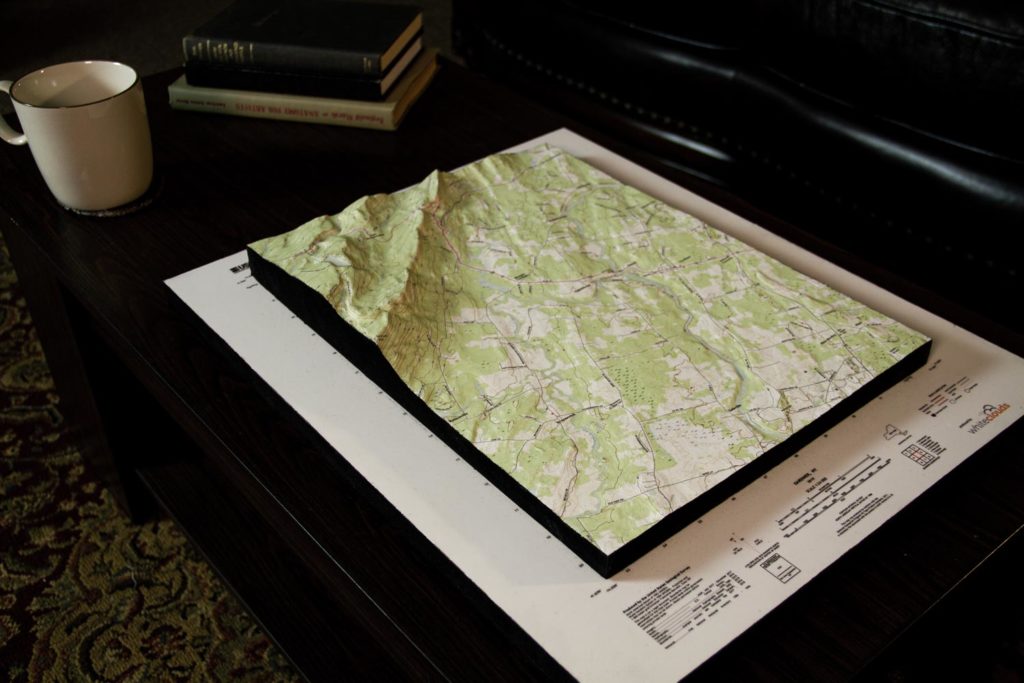
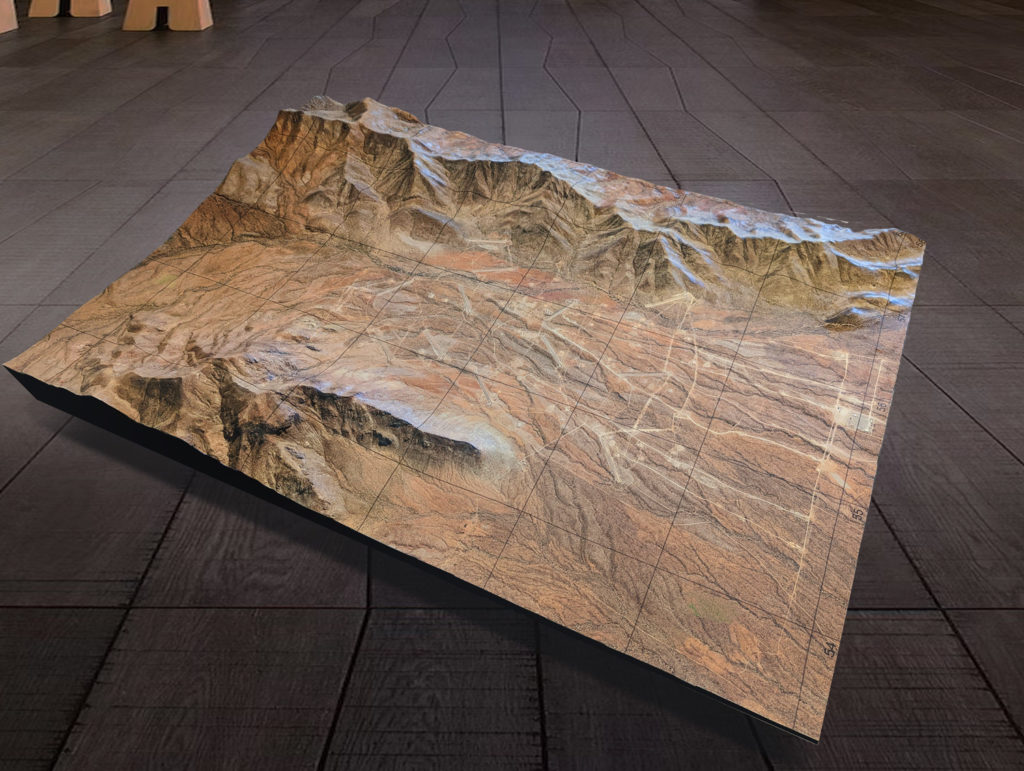
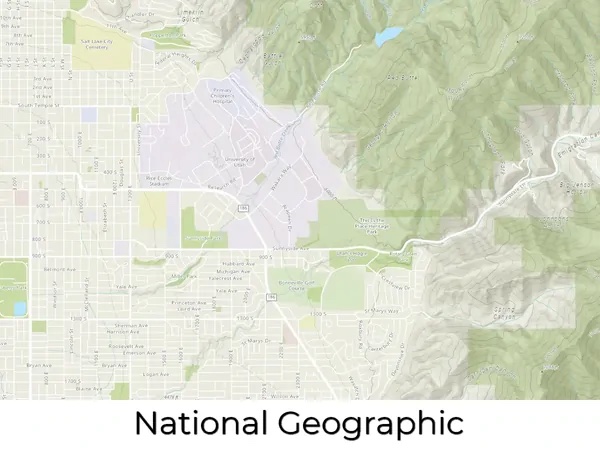
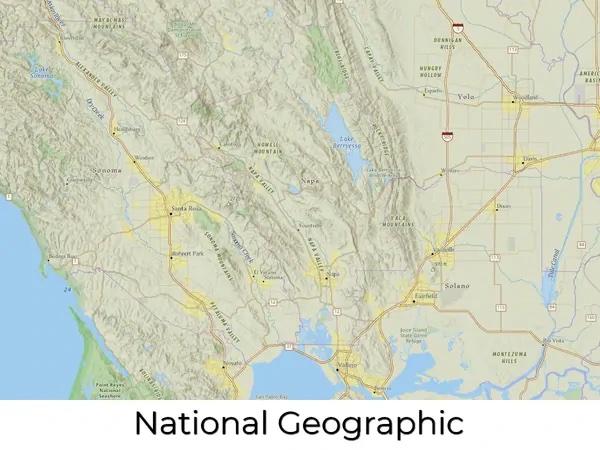
Another type of map that can be created using 3D mapping is the USGS topographic map. The United States Geological Survey (USGS) creates detailed topographic maps of the United States. These maps show the physical features of the land, such as mountains, rivers, and forests. USGS maps are widely used for outdoor recreation and environmental research.
Historical USGS topographic maps provide a glimpse into the past by showing the physical features of a region as they existed in a specific time period. These maps are used in historical research, genealogy, and environmental management to understand how the land has changed over time.
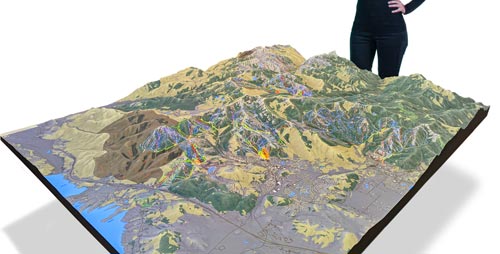
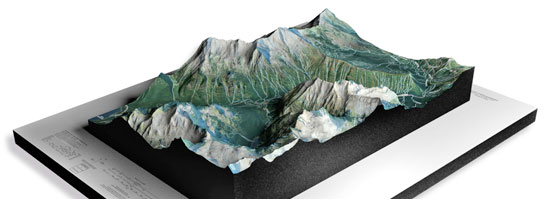
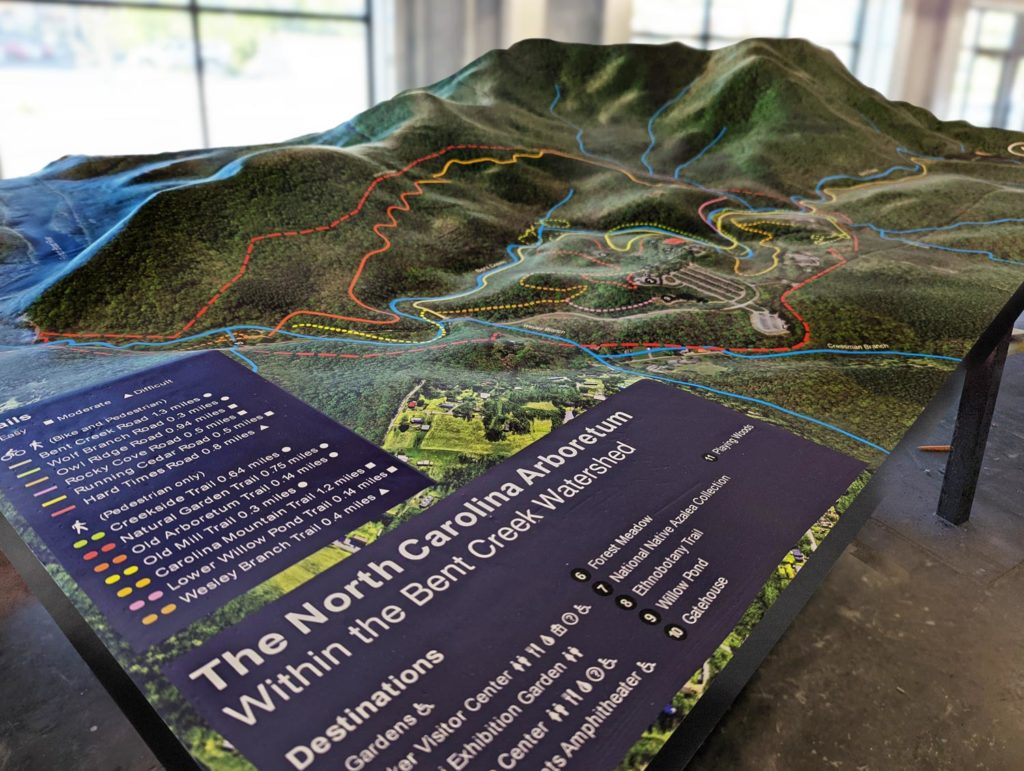
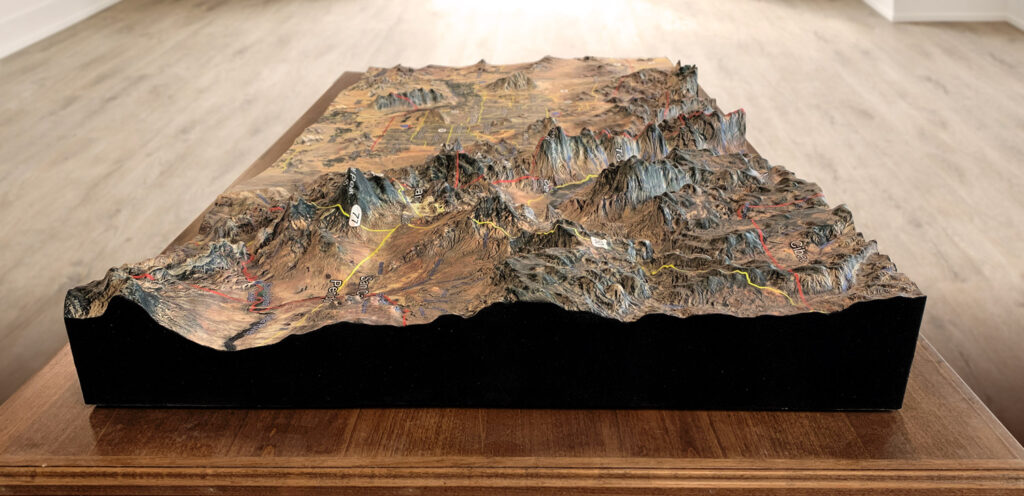
Raised relief maps are a type of map that shows the terrain in three dimensions. These maps are created with 3D printers creating the height or relief of the map model. The resulting map has raised areas that correspond to the mountains and other features of the landscape. Raised relief maps are often used in museums and educational settings to help visitors understand the topography of a region.
Other 3D mapping types, of which there are many, are listed below in alphabetical order.
Aerial maps are created from aerial photography that provide a bird’s-eye view of a location, including buildings, terrain, and vegetation.
Architectural maps are detailed maps that show the interior and exterior of buildings, including their structure and design.
Bathymetric maps are raised relief maps that show the topography of the ocean floor, including the depth of the water and the features of the seabed. These maps are crucial in understanding the ocean’s physical features and the distribution of marine life in different areas. Bathymetric maps are created using sonar technology, which sends sound waves to the ocean floor and measures the time it takes for them to bounce back. The data collected is then used to create a digital model of the ocean floor, which is then used to create the map.
Cadastral maps show the boundaries and ownership of land parcels, along with other relevant information such as land use, zoning, and property value. It is used for legal and administrative purposes, such as taxation, land management, and urban planning.
Cartogram maps use distortion to represent data, such as population or GDP, in a way that is proportional to the data value. This creates a map that is visually different from the actual geographic layout of the area. Cartogram maps are useful for showing how data values vary across different regions and can be used to identify areas of high or low values.
Cartography maps are maps that show the locations and spatial relationships between features on the Earth’s surface. These maps are used in geography, land surveying, and navigation.
Cartometric maps are maps that use mathematical formulas to represent the physical features of a region. Cartometric maps are used in scientific research, land management, and environmental management.
Choropleth maps use color or shading to represent different levels of data, such as population density or income. The map is divided into regions, and each region is shaded according to the data value for that region. Choropleth maps are useful for showing spatial patterns and can be used to identify areas of high or low values.
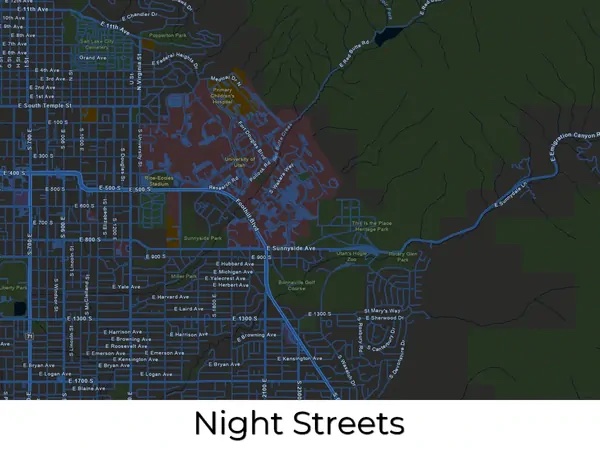
City maps are detailed maps of cities that show streets, landmarks, and other features.
Climate maps show the climate patterns of a region, including temperature, rainfall, and other weather-related variables. These climate maps are commonly used in environmental research and in agricultural planning.
Country maps show the boundaries and physical features of a country.
Distance ring maps are a type of topographic map that shows the distance between different points. These maps use concentric circles to represent distance, with each circle representing a set distance from the center point.
Dot density maps are a type of topographic map that uses dots to represent data values. Each dot represents a set number of units, such as population or income. Dot density maps are useful for showing spatial patterns and can be used to identify areas of high or low values.
Economic maps show the distribution of economic activity, including industries, trade routes, and natural resources. Economic maps are commonly used by economists, business owners, and policymakers to study economic trends and to make decisions about investment and development.
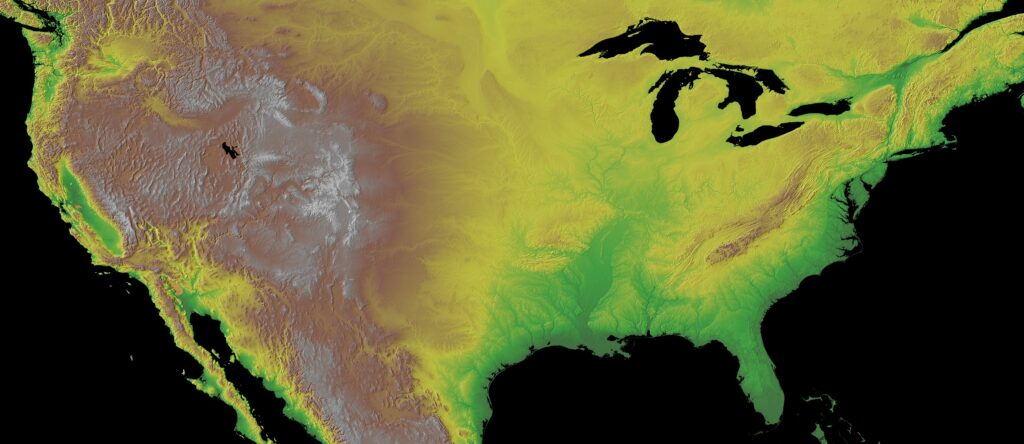
Elevation maps are another type of 3D map that shows the height of the land. Unlike contour maps, elevation maps show the height of each point on the landscape using a color gradient. The colors range from blue for low areas to red for high areas. Elevation maps are commonly used for urban planning, as they allow architects and engineers to visualize the height of buildings and other structures in relation to the surrounding landscape.
Flow maps are another type of topographic map that shows the movement of people, goods, or information between different locations. These maps use arrows or lines to show the direction and volume of the flow. Flow maps are useful for showing spatial patterns and can be used to identify areas with high levels of movement.
Footprint maps display the extent and location of an object or phenomenon, such as a building, land use, or environmental impact. It is used to analyze spatial relationships and to make decisions about land use planning and resource management.
Geologic maps show the geology of a region, including the distribution of rock types and geological structures. Geologic maps are used by geologists, mining companies, and environmental researchers to study the Earth’s crust and to locate mineral resources.
Geomorphic maps show the surface features and landforms of a region, including mountains, valleys, rivers, and other geological features. Geomorphic maps are used to study the natural processes that shape the Earth’s surface and to assess the potential for land use and development.
GIS maps, or geographic information system maps, are maps that use computer software to analyze and display geographic data. These maps are used in a wide range of industries, from urban planning and environmental management to public health and emergency response.
Graduated symbol maps are a type of topographic map that uses symbols, such as circles or squares, to represent data values. The size of the symbol increases or decreases based on the data value, with larger symbols representing higher values. Graduated symbol maps are useful for showing spatial patterns and can be used to identify areas of high or low values.
Groundwater contour maps display the distribution of groundwater levels by contour lines, which connect points of equal elevation. It is used to assess groundwater availability and to locate potential sources for groundwater recharge.
Hazard maps display the potential impact of natural or human-made hazards, such as floods, earthquakes, or wildfires, on a particular area. It is used to assess risk and to develop emergency response plans.
Heat maps are another type of topographic map that uses color to represent data values. The map is divided into a grid, and each grid cell is colored according to the data value for that cell. Heat maps are useful for showing spatial patterns and can be used to identify areas of high or low values.
Hexbin maps use hexagons to represent data values. The size of the hexagon is proportional to the data value, with larger hexagons representing higher values. Hexbin maps are useful for showing spatial patterns and can be used to identify areas of high or low values.
Hydrological maps are maps that show the distribution of water over an area, including rivers, lakes, and other bodies of water. These maps are crucial in understanding the flow of water in an area, which is essential in determining the availability of water for different uses. Hydrological maps are created using a combination of aerial photography, satellite imagery, and topographic maps, which are then digitized and combined to create the final map. The raised features on hydrological maps show the elevation of the land and the depth of the water bodies, which provides a comprehensive view of the area’s hydrological system.
Isarithmic maps use contour lines to show the distribution of continuous data, such as temperature, rainfall, or elevation. It is used to visualize spatial patterns and to make comparisons between different areas.
Isobaric maps show the distribution of atmospheric pressure over a region, usually with contour lines connecting points of equal pressure. It is used to study weather patterns and to forecast changes in the weather.
Isochrone maps show the time required to travel from one location to another. These maps are used in transportation planning and can be used to determine the best route for travel. Isochrone maps can also be used to identify areas that are more accessible than others.
Isoline maps use lines to connect points of equal value, such as contour lines on a topographic map. These maps are used to show changes in elevation, temperature, or other values across a geographic area.
Isopleth maps are maps that use lines to represent changes in a specific variable, such as elevation or temperature. These maps are used in scientific research and environmental management.
Land cover maps display the type and distribution of land cover, such as forests, grasslands, or urban areas, over a particular region. It is used to study environmental change and to develop land management strategies.
Location maps are a type of topographic map that shows the location of a specific point or feature. Location maps can be used to provide context for other maps or to show the location of a specific place.
Nautical maps are maps that show the features of the ocean, including depth, currents, and navigational hazards. Nautical charts are used in navigation, maritime trade, and oceanography.
NOAA maps are maps that show weather and climate data, including temperature, precipitation, and atmospheric pressure. These maps are used in weather forecasting, emergency response, and climate research.

Ocean current maps display the direction and intensity of ocean currents, which are driven by wind, temperature, and salinity differences. It is used to study the movement of marine organisms, the distribution of pollutants, and to plan shipping routes.
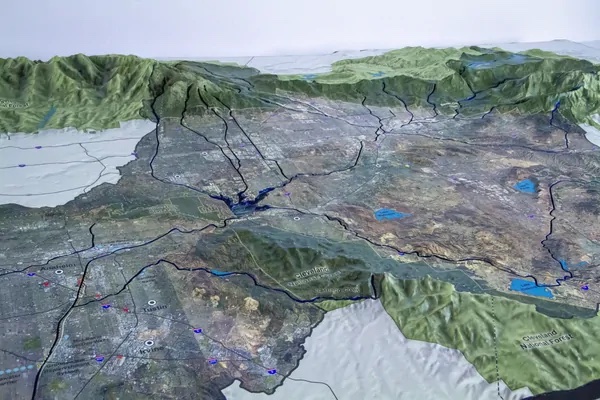
Orthophoto maps are maps that combine aerial photographs with a digital elevation model to create a 3D model of the terrain. These maps are used to visualize the surface features of an area in great detail and are commonly used in urban planning, architecture, and engineering. Orthophoto maps are created by taking aerial photographs of an area and then correcting for distortion caused by the angle of the camera and the terrain’s topography. The resulting image is then combined with a digital elevation model to create a raised relief map that shows the elevation and features of the land.
Political maps show the boundaries of countries, states, and other political subdivisions. They are commonly used for navigation and to show the location of cities and other points of interest.
Physical maps show the natural features of the Earth’s surface, such as mountains, rivers, and deserts. They are commonly used for navigation and outdoor recreation.
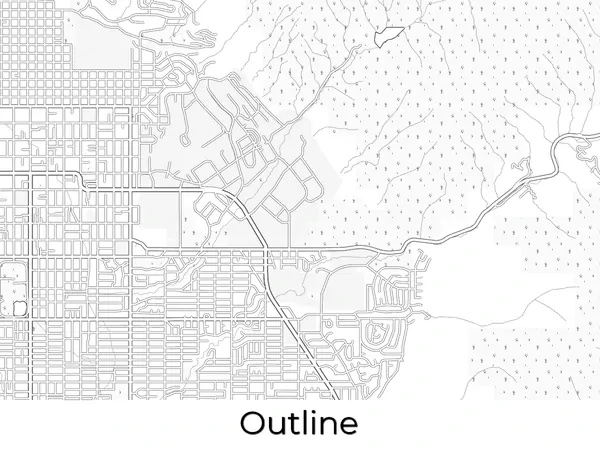
Planimetric maps show only the horizontal positions of features, such as roads, buildings, and water bodies, without indicating their elevations. Planimetric maps are used for navigation, land-use planning, and architectural design.
Projection mapped 3D maps are a technique used to project a 3D image or video onto a real-world 3D map, such as a building, landscape, or topography. This technique uses specialized software to create a virtual 3D model of the object, which is then used digitally projected onto the 3D map.
Proportional symbol maps use symbols, such as circles or squares, to represent data values. The size of the symbol is proportional to the data value, with larger symbols representing higher values. Proportional symbol maps are useful for showing spatial patterns and can be used to identify areas of high or low values.
Radar maps are maps that show the location and movement of weather systems, including storms and precipitation. Radar maps are used in weather forecasting, aviation, and military operations.
Reference maps are another type of topographic map that shows the geographic features of an area. These maps are used for navigation and can be used to identify landmarks or to determine the distance between two locations.
Road maps show the road network of a region, including highways, streets, and other routes. Road maps are commonly used for navigation and for planning road trips.
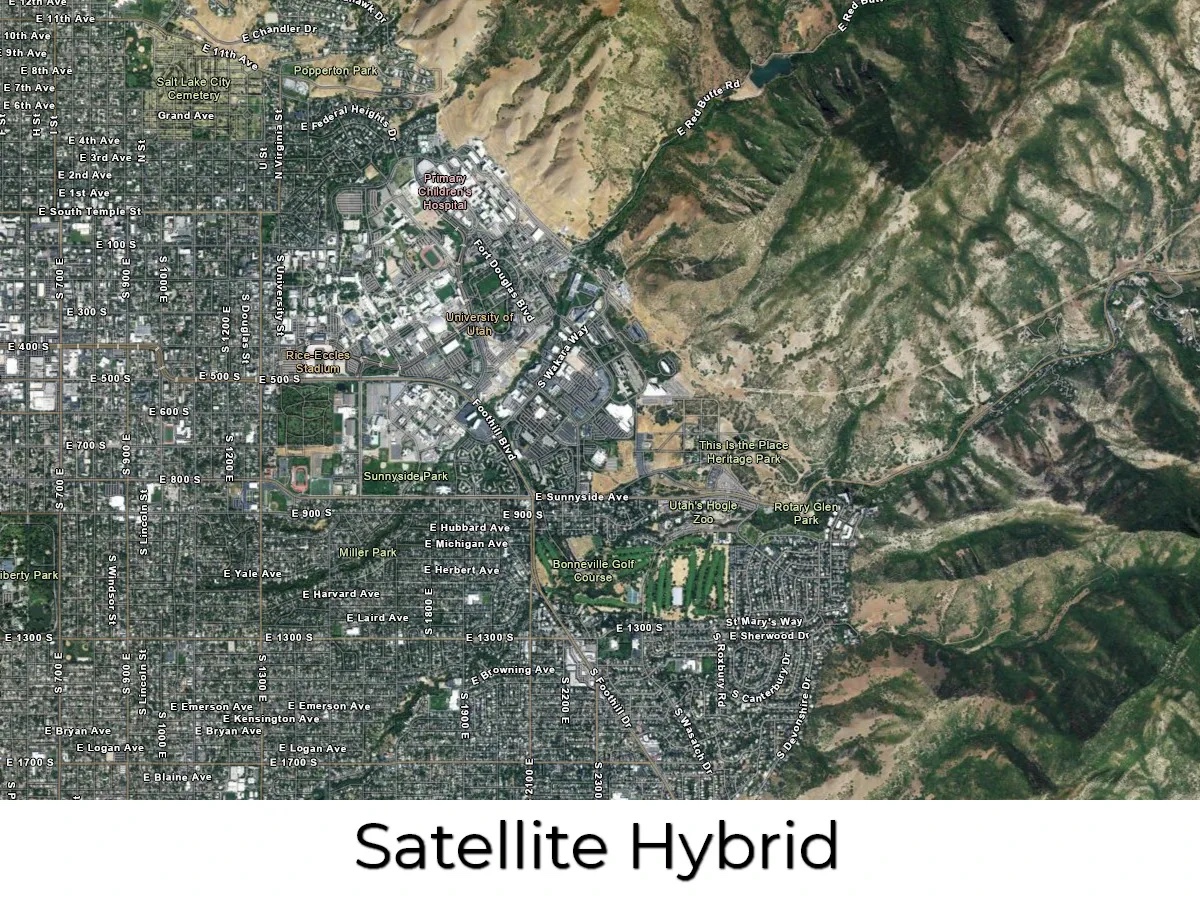
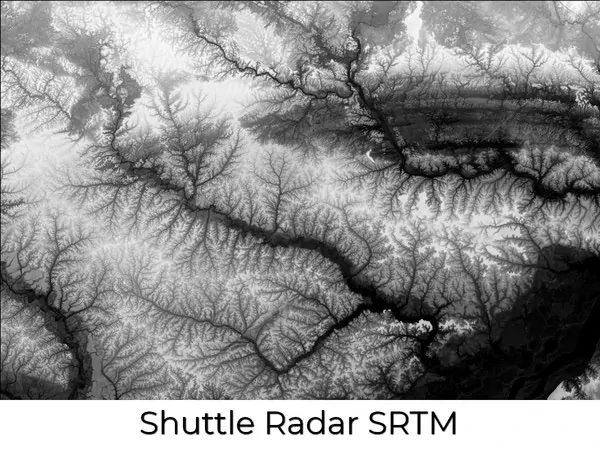
Satellite maps are a digital map that is created using images captured by satellites orbiting the Earth. These images are typically taken from a high altitude and provide a detailed view of the Earth’s surface, including its geography, topography, and land use. They are created by combining multiple images captured by satellites and then processing them to remove any distortions or anomalies. The resulting images are then used to create a seamless and accurate map of the Earth’s surface.
Schematic maps simplify and abstract the spatial relationships between features, often using symbols and stylized representations. It is used to convey complex information in a clear and concise way, such as subway systems, electrical circuits, or transit networks.
Seismic maps show the distribution of seismic activity and earthquake risk in a particular region. Seismic maps may include data on fault lines, ground motion, and earthquake intensity.
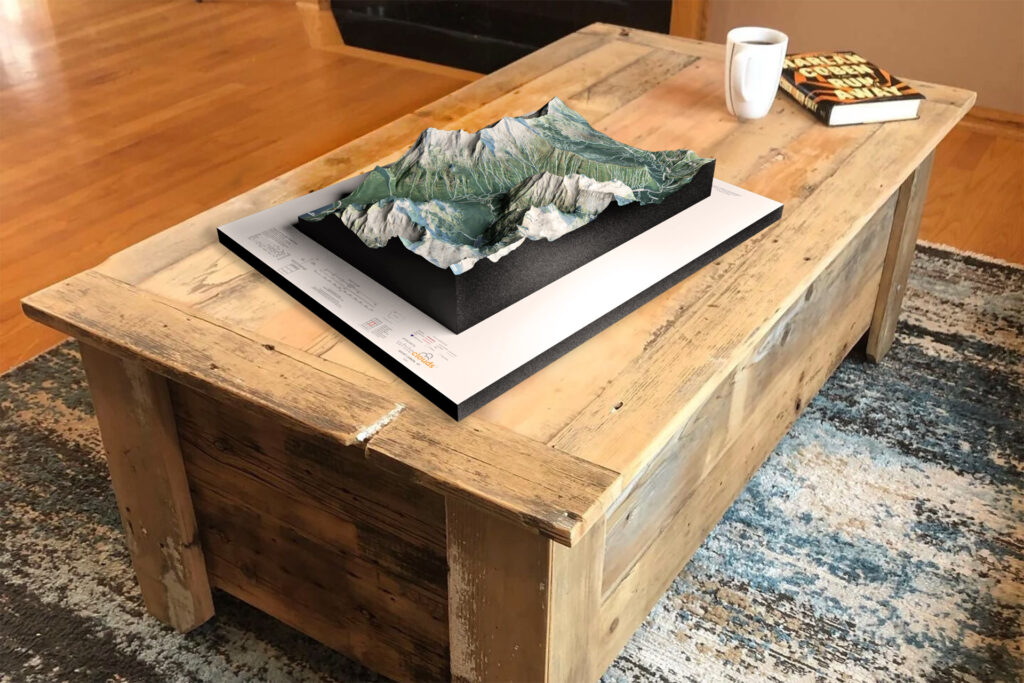
Shaded relief maps are maps that use variations in color and shading to represent the elevation and features of the terrain. These maps are commonly used in cartography and are helpful in visualizing the features of an area in great detail. Shaded relief maps are created by combining digital elevation data with satellite imagery to create a 3D model of the terrain. The model is then shaded using algorithms that take into account the angle and direction of the light source, creating a realistic representation of the area’s topography.

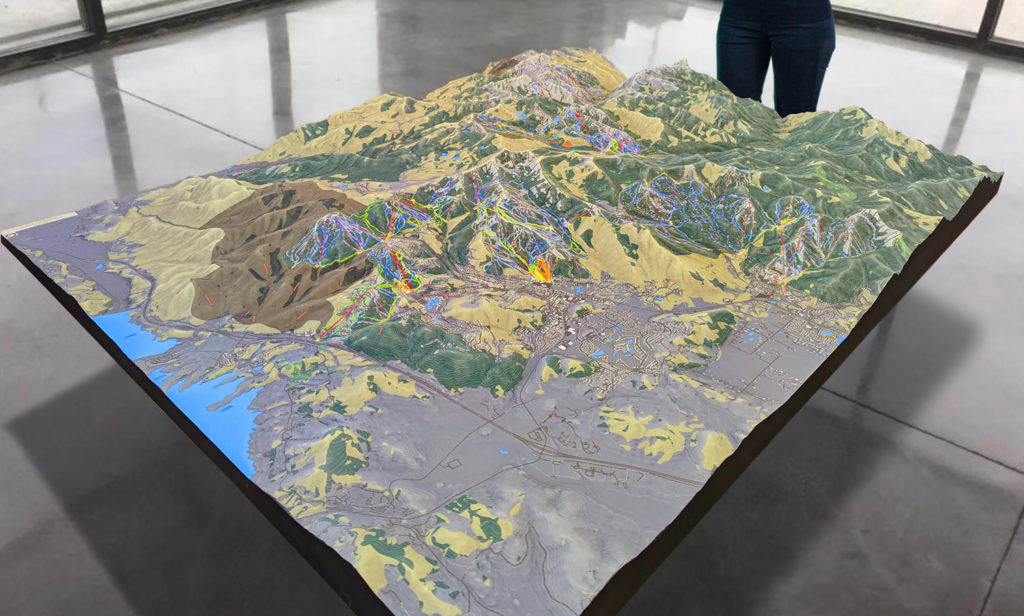
Ski maps display a detailed depiction of a ski resort’s topographical features, such as mountains, ridges, and valleys. This enables skiers and snowboarders to get a better sense of the slopes’ contours and elevations, which can be especially helpful when planning routes and navigating the terrain.
State maps show the boundaries, cities, and physical features of a state.
Structural contour maps show the shape and orientation of subsurface rock layers, based on data from drilling, seismic imaging, and other geophysical methods. It is used to explore for oil, gas, and mineral resources, and to assess the potential for geological hazards such as earthquakes and landslides.
Tectonic maps illustrate the geological structure and features of a region, including the distribution of faults, folds, and other tectonic elements. Tectonic maps are used to study the processes and forces that shape the Earth’s crust.
Terrain maps are maps that show the physical features of a region, such as mountains, valleys, and rivers. These maps are commonly used in outdoor activities such as hiking and mountaineering, where understanding the terrain is essential for planning routes and estimating travel times. They are sometimes associated with the look of Google Terrain Maps.
Thermal maps refer to maps that show the distribution of temperatures in a specific area. These maps are created using thermal imaging technology that detects infrared radiation emitted by objects based on their temperature. Thermal maps are used in various industries, including building construction, electrical and mechanical engineering, environmental monitoring, agriculture, and medical applications. These maps provide valuable insights into temperature patterns, enabling professionals to identify areas of overheating, energy loss, and other issues. Thermal maps help to improve safety, optimize processes, and reduce downtime, making them a valuable tool for many industries.
Topo maps, or topographic maps, are detailed maps that represent the physical features of a region, including the elevation, vegetation, waterways, and other natural and man-made features. These maps are commonly used in outdoor recreation, such as hiking, camping, and fishing. Topo maps are also used in scientific research and land management, where understanding the geography of an area is essential.
Topographical maps are similar to contour maps, but they show a wider range of features, including roads, buildings, and bodies of water. Topographical maps are used for a variety of purposes, including navigation, urban planning, and environmental research.
Thematic maps are maps that show specific themes or topics. For example, a thematic map might show the distribution of a particular plant species, or the location of historical landmarks. Thematic maps are commonly used in academic research and in museums and educational settings.
USA maps show the boundaries, states, cities, and physical features of the United States.
Vicinity maps show the surrounding area of a particular location or feature, usually used for orientation and navigation purposes. Vicinity maps typically includes roads, landmarks, and major features of the landscape.
Virtual reality maps are immersive maps that allow users to explore a location in real-time using virtual reality technology.
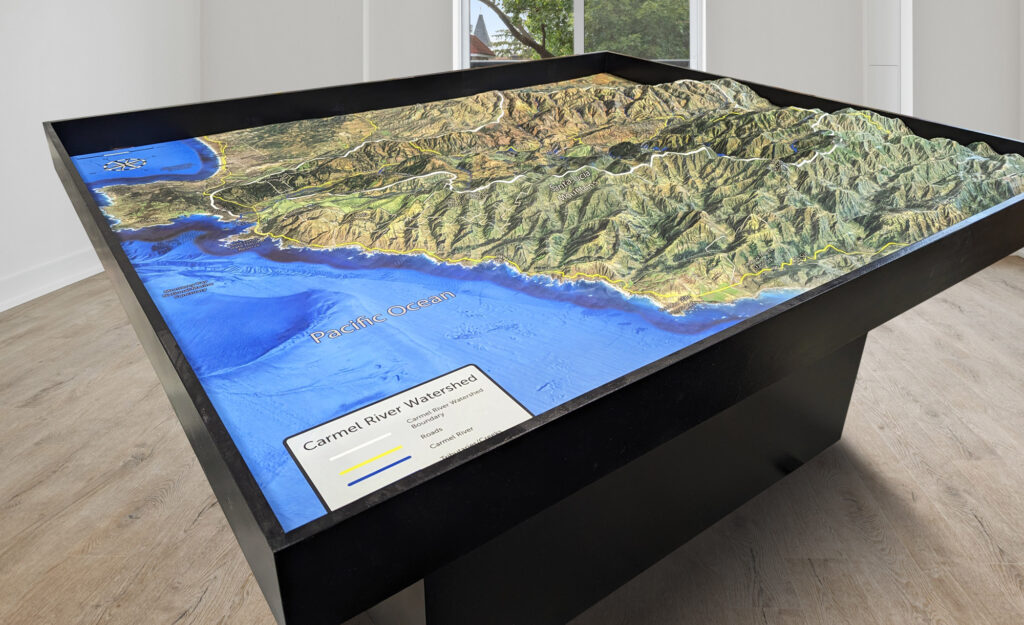
Watershed maps are maps that show the boundaries of a watershed, or the area of land that drains into a specific body of water, such as a river, lake, or ocean. These maps are used in environmental management and water resource planning to understand the movement of water and pollutants through the landscape. Watershed maps are also important tools for conservation and restoration efforts.
Weather maps are maps that show the current and predicted weather conditions in a region. Weather maps are used by meteorologists and weather forecasters to predict and track weather patterns.
World maps show the entire world, including continents, countries, and oceans.
3D maps are a type of map that shows the physical environment in three dimensions. These maps are commonly used in urban planning, architecture, and gaming. They provide a realistic and immersive experience, allowing users to explore the environment from multiple angles.
You can also learn more from our Maps Glossary or 3DPedia.

The history of 3D mapping goes back many decades, but it wasn’t until the development of advanced technology that 3D mapping became possible on a larger scale. Here is a brief overview of the history of 3D mapping:

- In the early 20th century, aerial photography was developed and used for mapping purposes. These 2D photographs were used to create topographic maps and other types of maps.
- In the 1960s and 1970s, stereo photogrammetry became more advanced, allowing for the creation of 3D maps using aerial photographs.
- In the 1980s, the development of Geographic Information Systems (GIS) software allowed for the creation of digital 2D maps and the analysis of geographic data.
- In the 1990s, advancements in computer graphics technology and the availability of high-resolution satellite imagery allowed for the creation of 3D maps of the Earth and other planets. NASA’s World Wind program, released in 2004, allowed users to explore the Earth using satellite imagery and elevation data.
- In the 2000s, web-based mapping applications like Google Earth and Bing Maps made 3D maps accessible to a wider audience. These applications allowed users to view and explore 3D models of cities, landmarks, and other places.
- Today, advancements in LiDAR technology and drone mapping have led to the development of more advanced 3D mapping techniques. LiDAR data can be used to create highly detailed and accurate 3D models of environments, while drone mapping allows for the creation of 3D maps of areas that are difficult to access or dangerous for humans.