Geomorphic maps, also known as relief maps or topographic maps, are essential tools for understanding and analyzing the Earth’s physical features. They show the three-dimensional surface of the Earth in a two-dimensional format, making it easier to study and interpret the Earth’s features such as mountains, valleys, rivers, and oceans. These maps provide a detailed representation of the Earth’s surface, including the height and steepness of mountains, the depth of valleys, and the location and flow of rivers. Geomorphic maps are widely used in various fields such as geography, geology, cartography, engineering, and environmental science.
Types of Geomorphic Maps
There are several types of geomorphic maps, each with its own unique features and applications. Some of the most common types of geomorphic maps are:
Topographic Maps: These maps show the elevation and contours of the Earth’s surface. They provide a detailed representation of the Earth’s surface, including the height and steepness of mountains, the depth of valleys, and the location and flow of rivers. Topographic maps are essential tools for navigation, engineering, and other applications where precise measurements of the Earth’s surface are required.
Bathymetric Maps: These maps show the underwater topography of oceans, seas, and lakes. They provide information on the depth and shape of the seabed, as well as the location of underwater features such as mountains, valleys, and canyons. Bathymetric maps are essential tools for navigation, oceanography, and other marine applications.
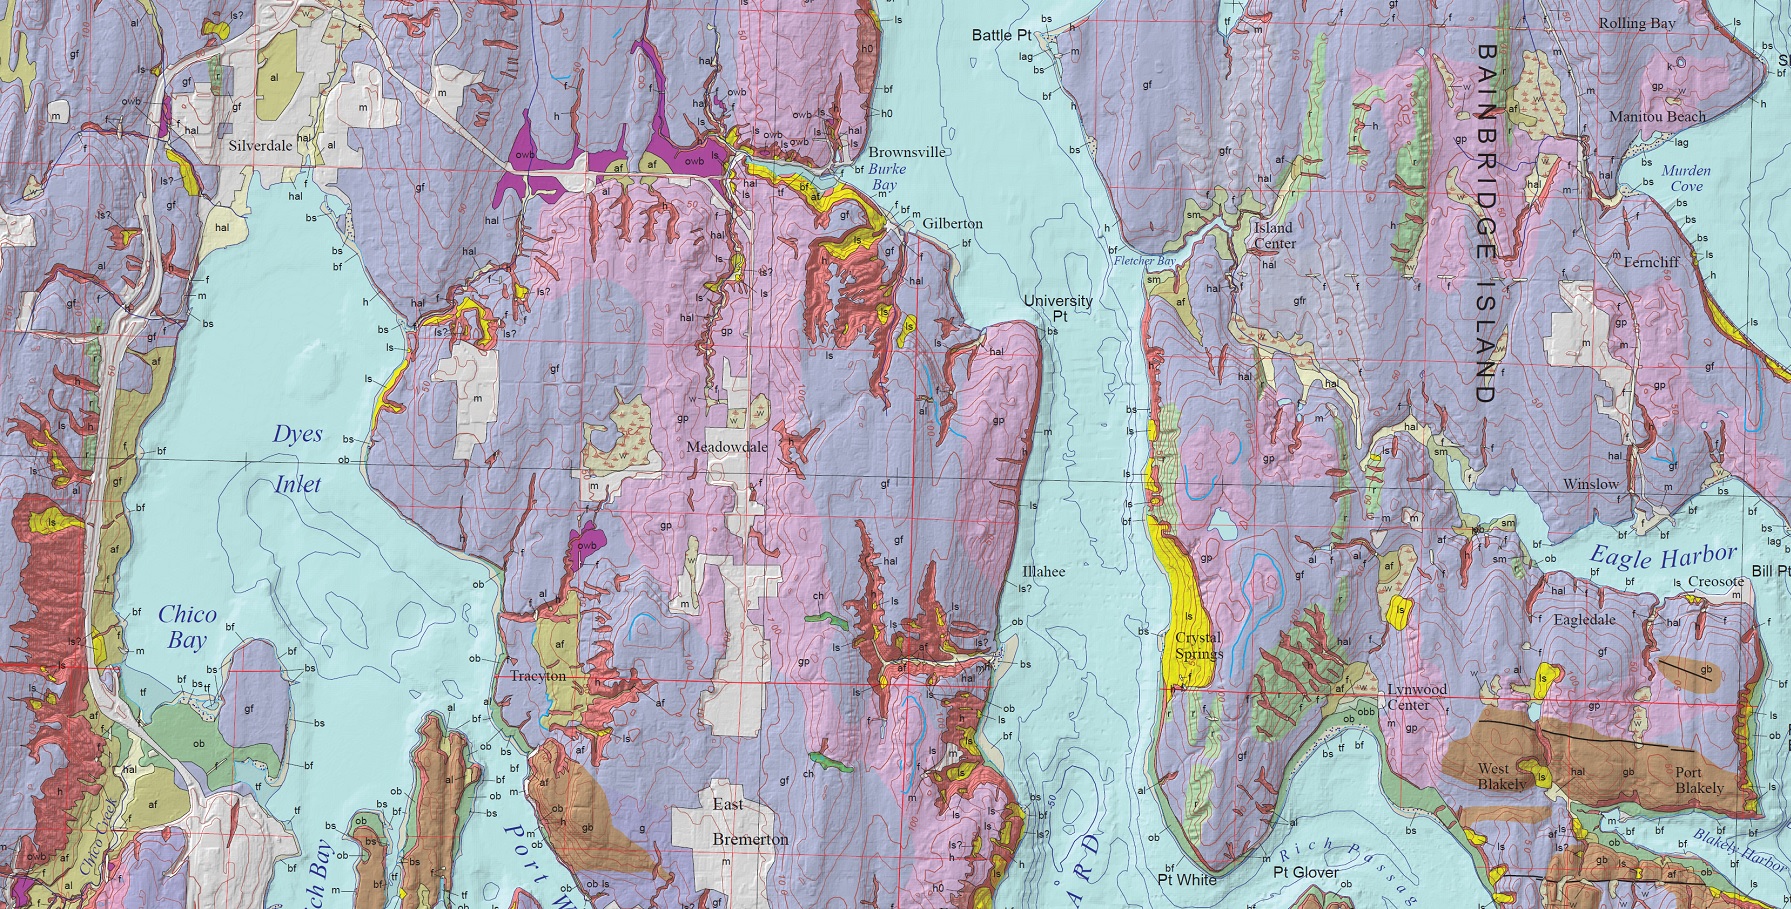
Geologic Maps: These maps show the distribution of different types of rocks, minerals, and other geological features. They provide information on the age, composition, and structure of the Earth’s crust. Geologic maps are essential tools for geologists and other earth scientists.
Land Use Maps: These maps show the different ways in which land is used, such as agricultural, residential, industrial, or recreational. They provide information on the human impact on the environment and the potential for land use conflicts.
Thematic Maps: These maps focus on a particular theme or topic, such as population density, climate, or natural resources. They provide a visual representation of data and help to identify patterns and trends.
Uses of Geomorphic Maps
Geomorphic maps have a wide range of uses in various fields, including:
Navigation: Geomorphic maps are essential tools for navigation, whether it is by land, sea, or air. They provide information on the location and elevation of features such as mountains, valleys, and rivers, making it easier to plan routes and avoid obstacles.
Engineering: Geomorphic maps are used in engineering projects such as road construction, dam building, and land development. They provide information on the topography and geology of the site, allowing engineers to design structures that are safe and efficient.
Environmental Science: Geomorphic maps are used in environmental science to study the impact of human activities on the environment, such as deforestation, mining, and urbanization. They provide a visual representation of the changes in the landscape over time.
Geology: Geomorphic maps are used in geology to study the Earth’s crust and the processes that shape it. They provide information on the distribution of rocks, minerals, and other geological features, allowing geologists to identify mineral deposits and potential hazards such as earthquakes and landslides.
Features of Geomorphic Maps
Geomorphic maps have several features that make them unique and useful. Some of these features are:
Contours: Contours are lines that connect points of equal elevation on a map. They provide information on the height and steepness of features such as mountains, hills, and valleys.
Scale: The scale of a map is the ratio between the map and the corresponding distance on the ground. It allows users to measure distances and calculate areas accurately.
Legend: The legend is a key that explains the symbols and colors used on the map. It helps users understand the information presented on the map.
Relief shading: Relief shading is a technique used to give a three-dimensional appearance to a two-dimensional map. It provides a visual representation of the elevation and slope of the Earth’s surface.
Benefits of Geomorphic Maps
Geomorphic maps have several benefits, including:
Visualization: Geomorphic maps provide a visual representation of the Earth’s surface, making it easier to understand and analyze physical features and patterns.
Accuracy: Geomorphic maps are highly accurate and provide precise measurements of the Earth’s surface. This accuracy makes them useful for navigation, engineering, and scientific applications.
Planning: Geomorphic maps provide information on the topography, geology, and land use of an area, allowing for better planning and decision-making in various fields.
Environmental awareness: Geomorphic maps help to increase environmental awareness by providing information on the impact of human activities on the environment and the importance of conservation.
Learn more about Maps
- Topographical Maps: Representation of the physical features of a region or area.
- Contour Maps: Representation of the contours of the land surface or ocean floor.
- Raised Relief Maps: Representation of land elevations with raised features indicating landforms.
- Terrain Maps: Representation of the physical features of a terrain or landmass.
- USGS Topographic Maps: Representation of topographic features and land elevations based on USGS data.
- USGS Historical Topographic Maps: Representation of historical topographic maps created by the USGS.
- Watershed Maps: Representation of the areas where water flows into a particular river or lake.
- Elevation Maps: Representation of land and water elevations with high precision.
- Physical Maps: Representation of physical features of the Earth’s surface such as landforms, oceans, and plateaus.
- Bathymetric Maps: Representation of the topography and features of the ocean floor.
- NOAA Maps: Representation of atmospheric, oceanographic, and environmental data by NOAA.
- Nautical Maps: Representation of the underwater features and depth of an area for navigation purposes.
- Geologic Maps: Representation of the geologic features of an area such as rock types, faults, and folds.
- Satellite Maps: Representation of earth from high-definition satellite imagery.