Economic maps are a tool used to represent economic data in a geographic context. These maps provide a visual representation of the economic activity, patterns, and distribution across regions, countries, or the world. Economic maps are used by governments, businesses, researchers, and policymakers to analyze economic trends, plan economic development strategies, and make informed decisions.
Types of Economic Maps
There are several types of economic maps that represent different economic data. Some of the most common types include:
Gross Domestic Product (GDP) Maps: These maps show the total value of goods and services produced in a region or country. GDP maps can be used to compare the economic output of different regions and countries.
Employment Maps: These maps show the number of people employed in different industries or sectors in a region or country. Employment maps can be used to identify regions with high or low levels of employment and the sectors driving the economy.
Poverty Maps: These maps show the percentage of the population living below the poverty line in a region or country. Poverty maps can be used to identify regions with high levels of poverty and develop policies to alleviate poverty.
Trade Maps: These maps show the flow of goods and services between different regions or countries. Trade maps can be used to identify regions with high levels of trade activity and develop policies to promote trade.
Uses of Economic Maps
Economic maps are a type of map that displays information related to the economy of a particular region. They provide a visual representation of economic data, including the distribution of industries, population density, and income levels.
- Business Planning: One of the most common uses of economic maps is for business planning. Companies use these maps to determine where to locate new facilities or expand existing ones. The maps provide information about the distribution of industries, population density, and income levels in a particular area, which can help companies identify potential markets for their products or services.
- Investment Decisions: Economic maps are also useful for making investment decisions. Investors use the maps to identify regions with strong economic growth potential and invest in industries that are expected to perform well in those regions. They can also help investors identify potential risks, such as areas with high levels of unemployment or low population growth.
- Urban Planning: Economic maps are an important tool for urban planners. They use the maps to plan new developments and identify areas where infrastructure improvements are needed. They can also help planners identify areas where affordable housing is needed, as well as areas where economic growth is expected to occur.
- Policy Making: Economic maps are also useful for policy makers. They can use the maps to identify areas where government intervention is needed, such as areas with high levels of poverty or unemployment. These maps can also help policy makers understand the distribution of industries and the impact of economic policies on different regions.
- Research: Researchers use economic maps to study the economy and its impact on society. They can use the maps to analyze trends in economic growth, income inequality, and the distribution of industries. These maps can also help researchers identify areas where additional research is needed, such as areas with low levels of economic growth or high levels of poverty.
- Education: Economic maps are also useful for educational purposes. Economics teachers use maps to teach students about the economy and its impact on different regions. They can use the maps to explain the distribution of industries, population density, and income levels in different regions, as well as the impact of economic policies on these regions.
- Real Estate: Real estate agents use economic maps to help clients buy or sell properties. The maps provide information about the economic conditions in a particular area, such as the distribution of industries, population density, and income levels. Real estate agents can use these maps to help clients understand the local economy and make informed decisions about buying or selling property.
- Marketing: Marketing professionals use economic maps to target specific regions with their products or services. The maps provide information about the distribution of industries and population density, which can help marketers identify potential markets for their products or services. Maps can also help marketers identify areas where advertising or promotional campaigns are needed.
- Environmental Planning: Economic maps are also useful for environmental planning. They can help environmental planners identify areas where environmental policies are needed, such as areas with high levels of pollution or habitat destruction. These maps can also help environmental planners identify areas where conservation efforts are needed, such as areas with high levels of biodiversity or natural resources.
- Government Planning: Finally, economic maps are an important tool for government planning. Government agencies use these maps to plan economic development projects, such as the construction of new infrastructure or the promotion of new industries. They can also help government agencies identify areas where economic policies are needed, such as areas with low levels of economic growth or high levels of poverty.
Features of Economic Maps
Economic maps typically include a range of features that provide additional context to the economic data being presented. Some of these features include:
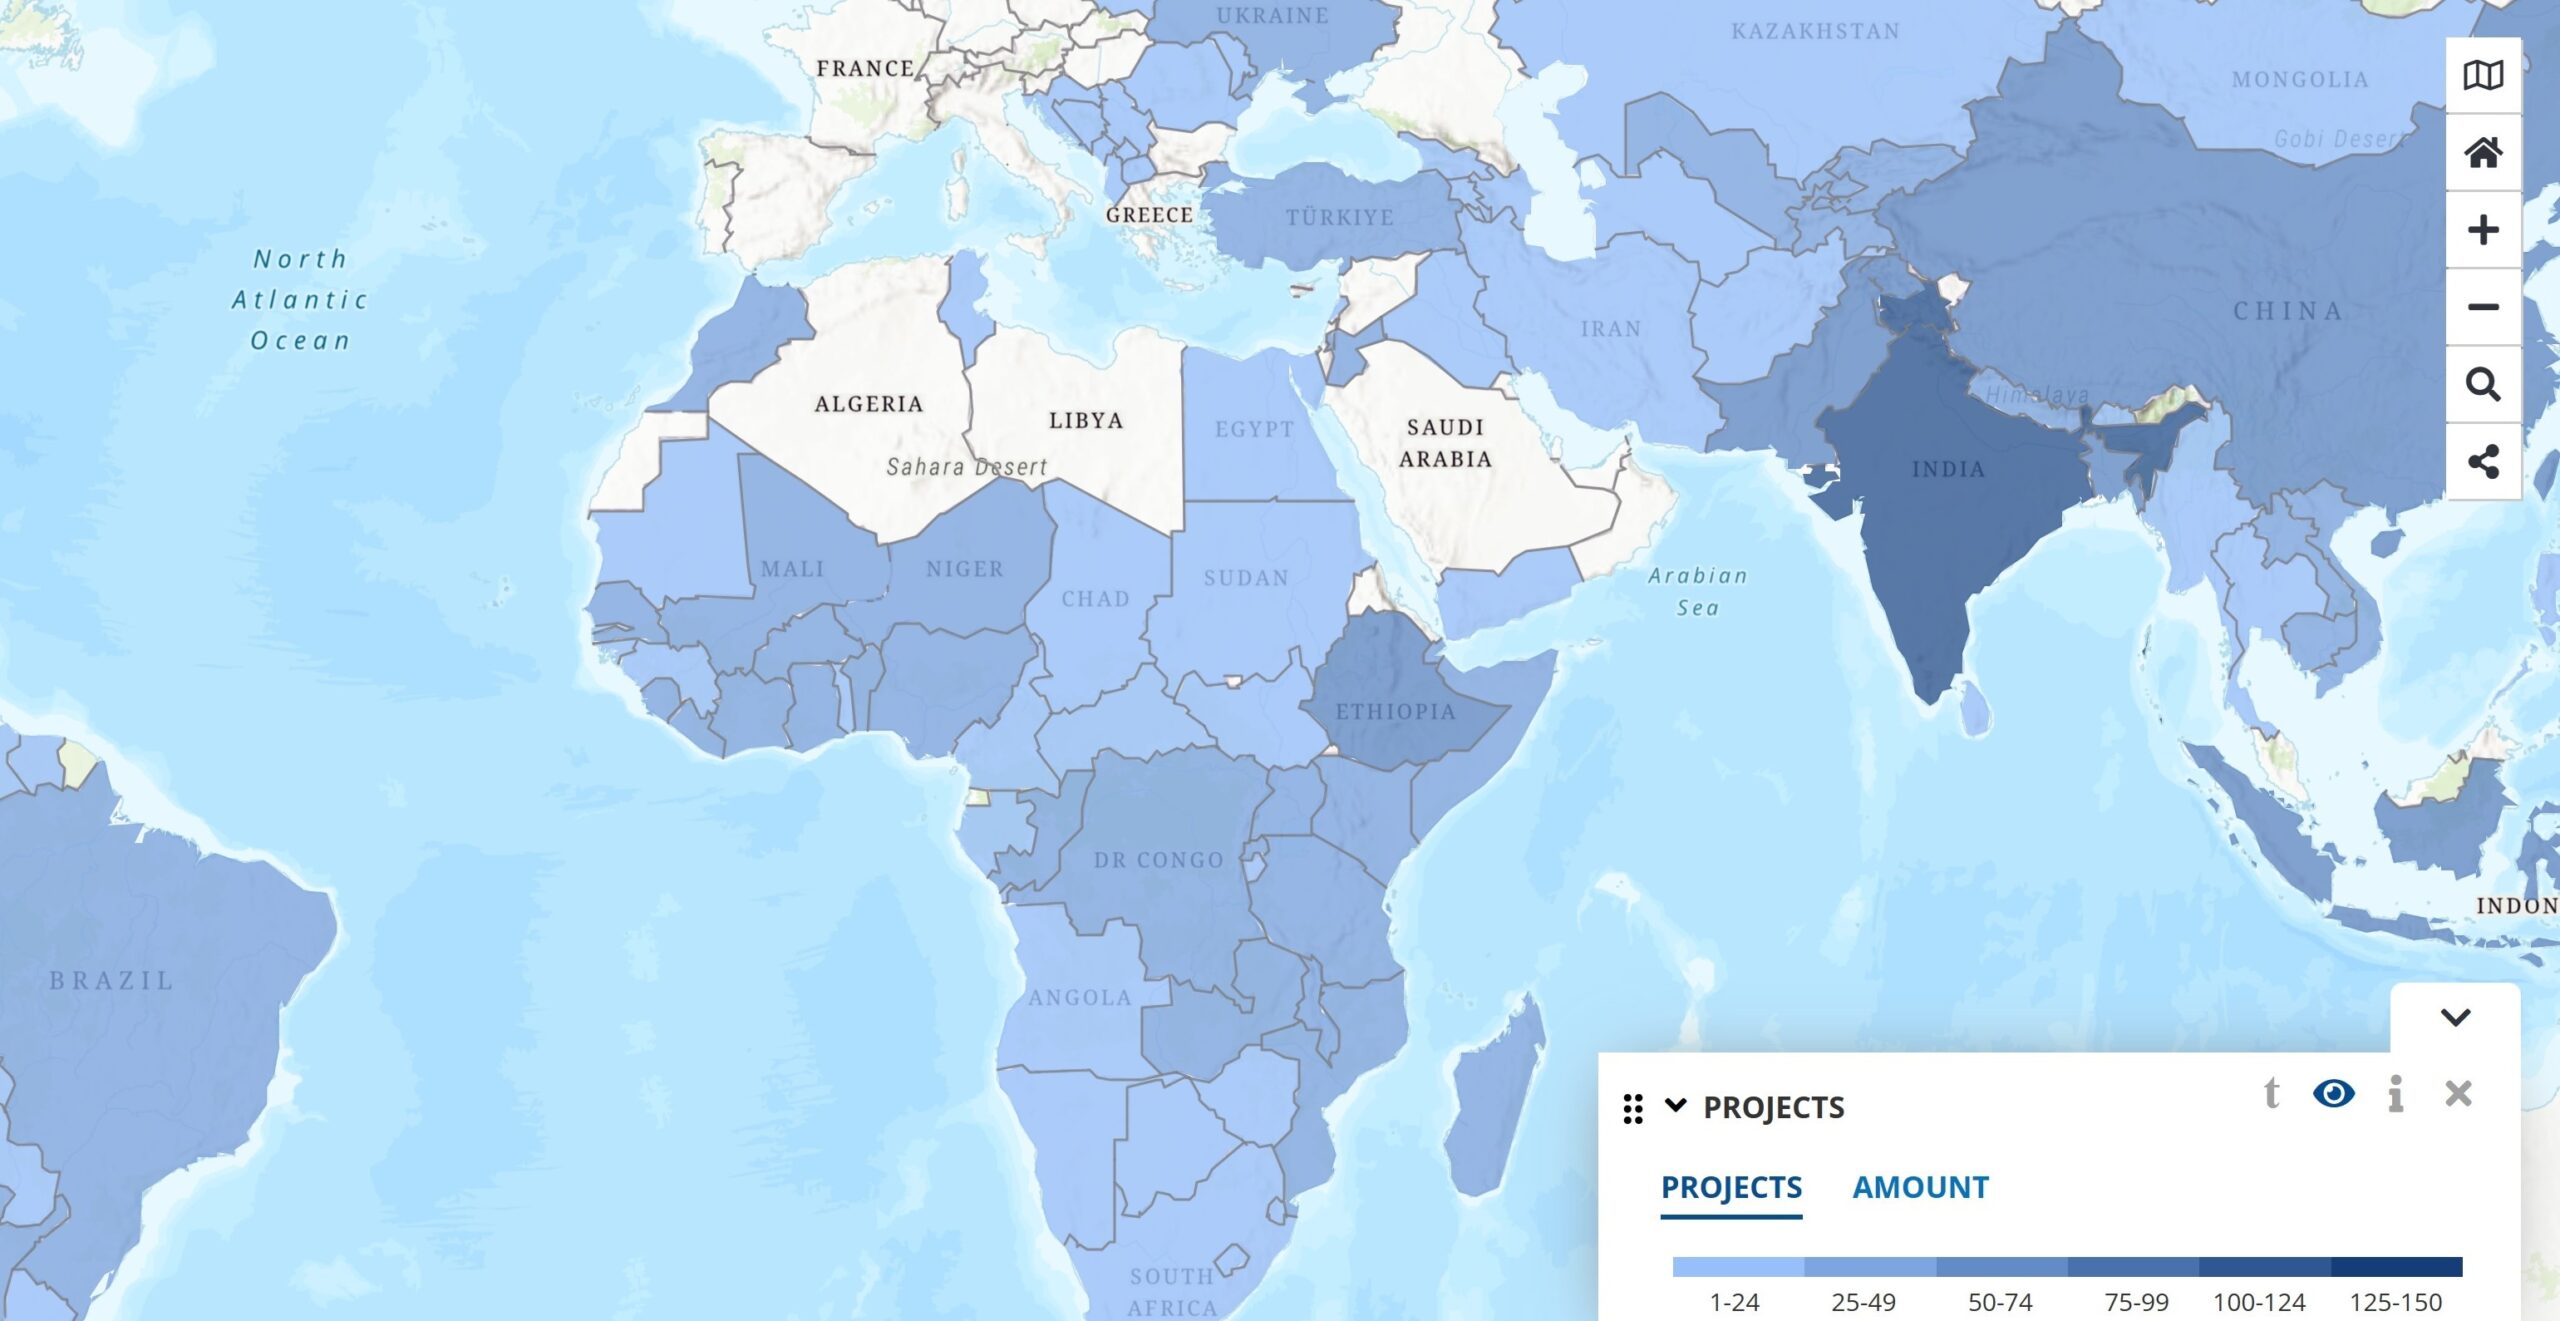
Color-Coding: Economic maps often use color-coding to represent different levels of economic activity or different economic indicators.
Legend: Economic maps include a legend that explains the meaning of the colors and other symbols used on the map.
Scale: Economic maps include a scale that shows the level of detail presented on the map.
Labels: Economic maps include labels that identify regions, countries, or other areas being represented on the map.
Benefits of Economic Maps
Economic maps provide several benefits to businesses, governments, and researchers. Some of these benefits include:
Improved Decision-Making: Economic maps provide a visual representation of economic data that can help decision-makers identify trends and patterns that may not be immediately apparent in a table or report.
Improved Planning: Economic maps can be used to develop more informed land use plans, transportation plans, and other infrastructure development plans.
Improved Communication: Economic maps provide a simple and clear way to communicate economic data to a wide range of stakeholders.
Improved Research: Economic maps provide researchers with a tool to analyze economic data and identify relationships between economic factors and other variables.
Learn more about Maps
- Topographical Maps: Representation of the physical features of a region or area.
- Contour Maps: Representation of the contours of the land surface or ocean floor.
- Raised Relief Maps: Representation of land elevations with raised features indicating landforms.
- Terrain Maps: Representation of the physical features of a terrain or landmass.
- USGS Topographic Maps: Representation of topographic features and land elevations based on USGS data.
- USGS Historical Topographic Maps: Representation of historical topographic maps created by the USGS.
- Watershed Maps: Representation of the areas where water flows into a particular river or lake.
- Elevation Maps: Representation of land and water elevations with high precision.
- Physical Maps: Representation of physical features of the Earth’s surface such as landforms, oceans, and plateaus.
- Bathymetric Maps: Representation of the topography and features of the ocean floor.
- NOAA Maps: Representation of atmospheric, oceanographic, and environmental data by NOAA.
- Nautical Maps: Representation of the underwater features and depth of an area for navigation purposes.
- Geologic Maps: Representation of the geologic features of an area such as rock types, faults, and folds.
- Satellite Maps: Representation of earth from high-definition satellite imagery.