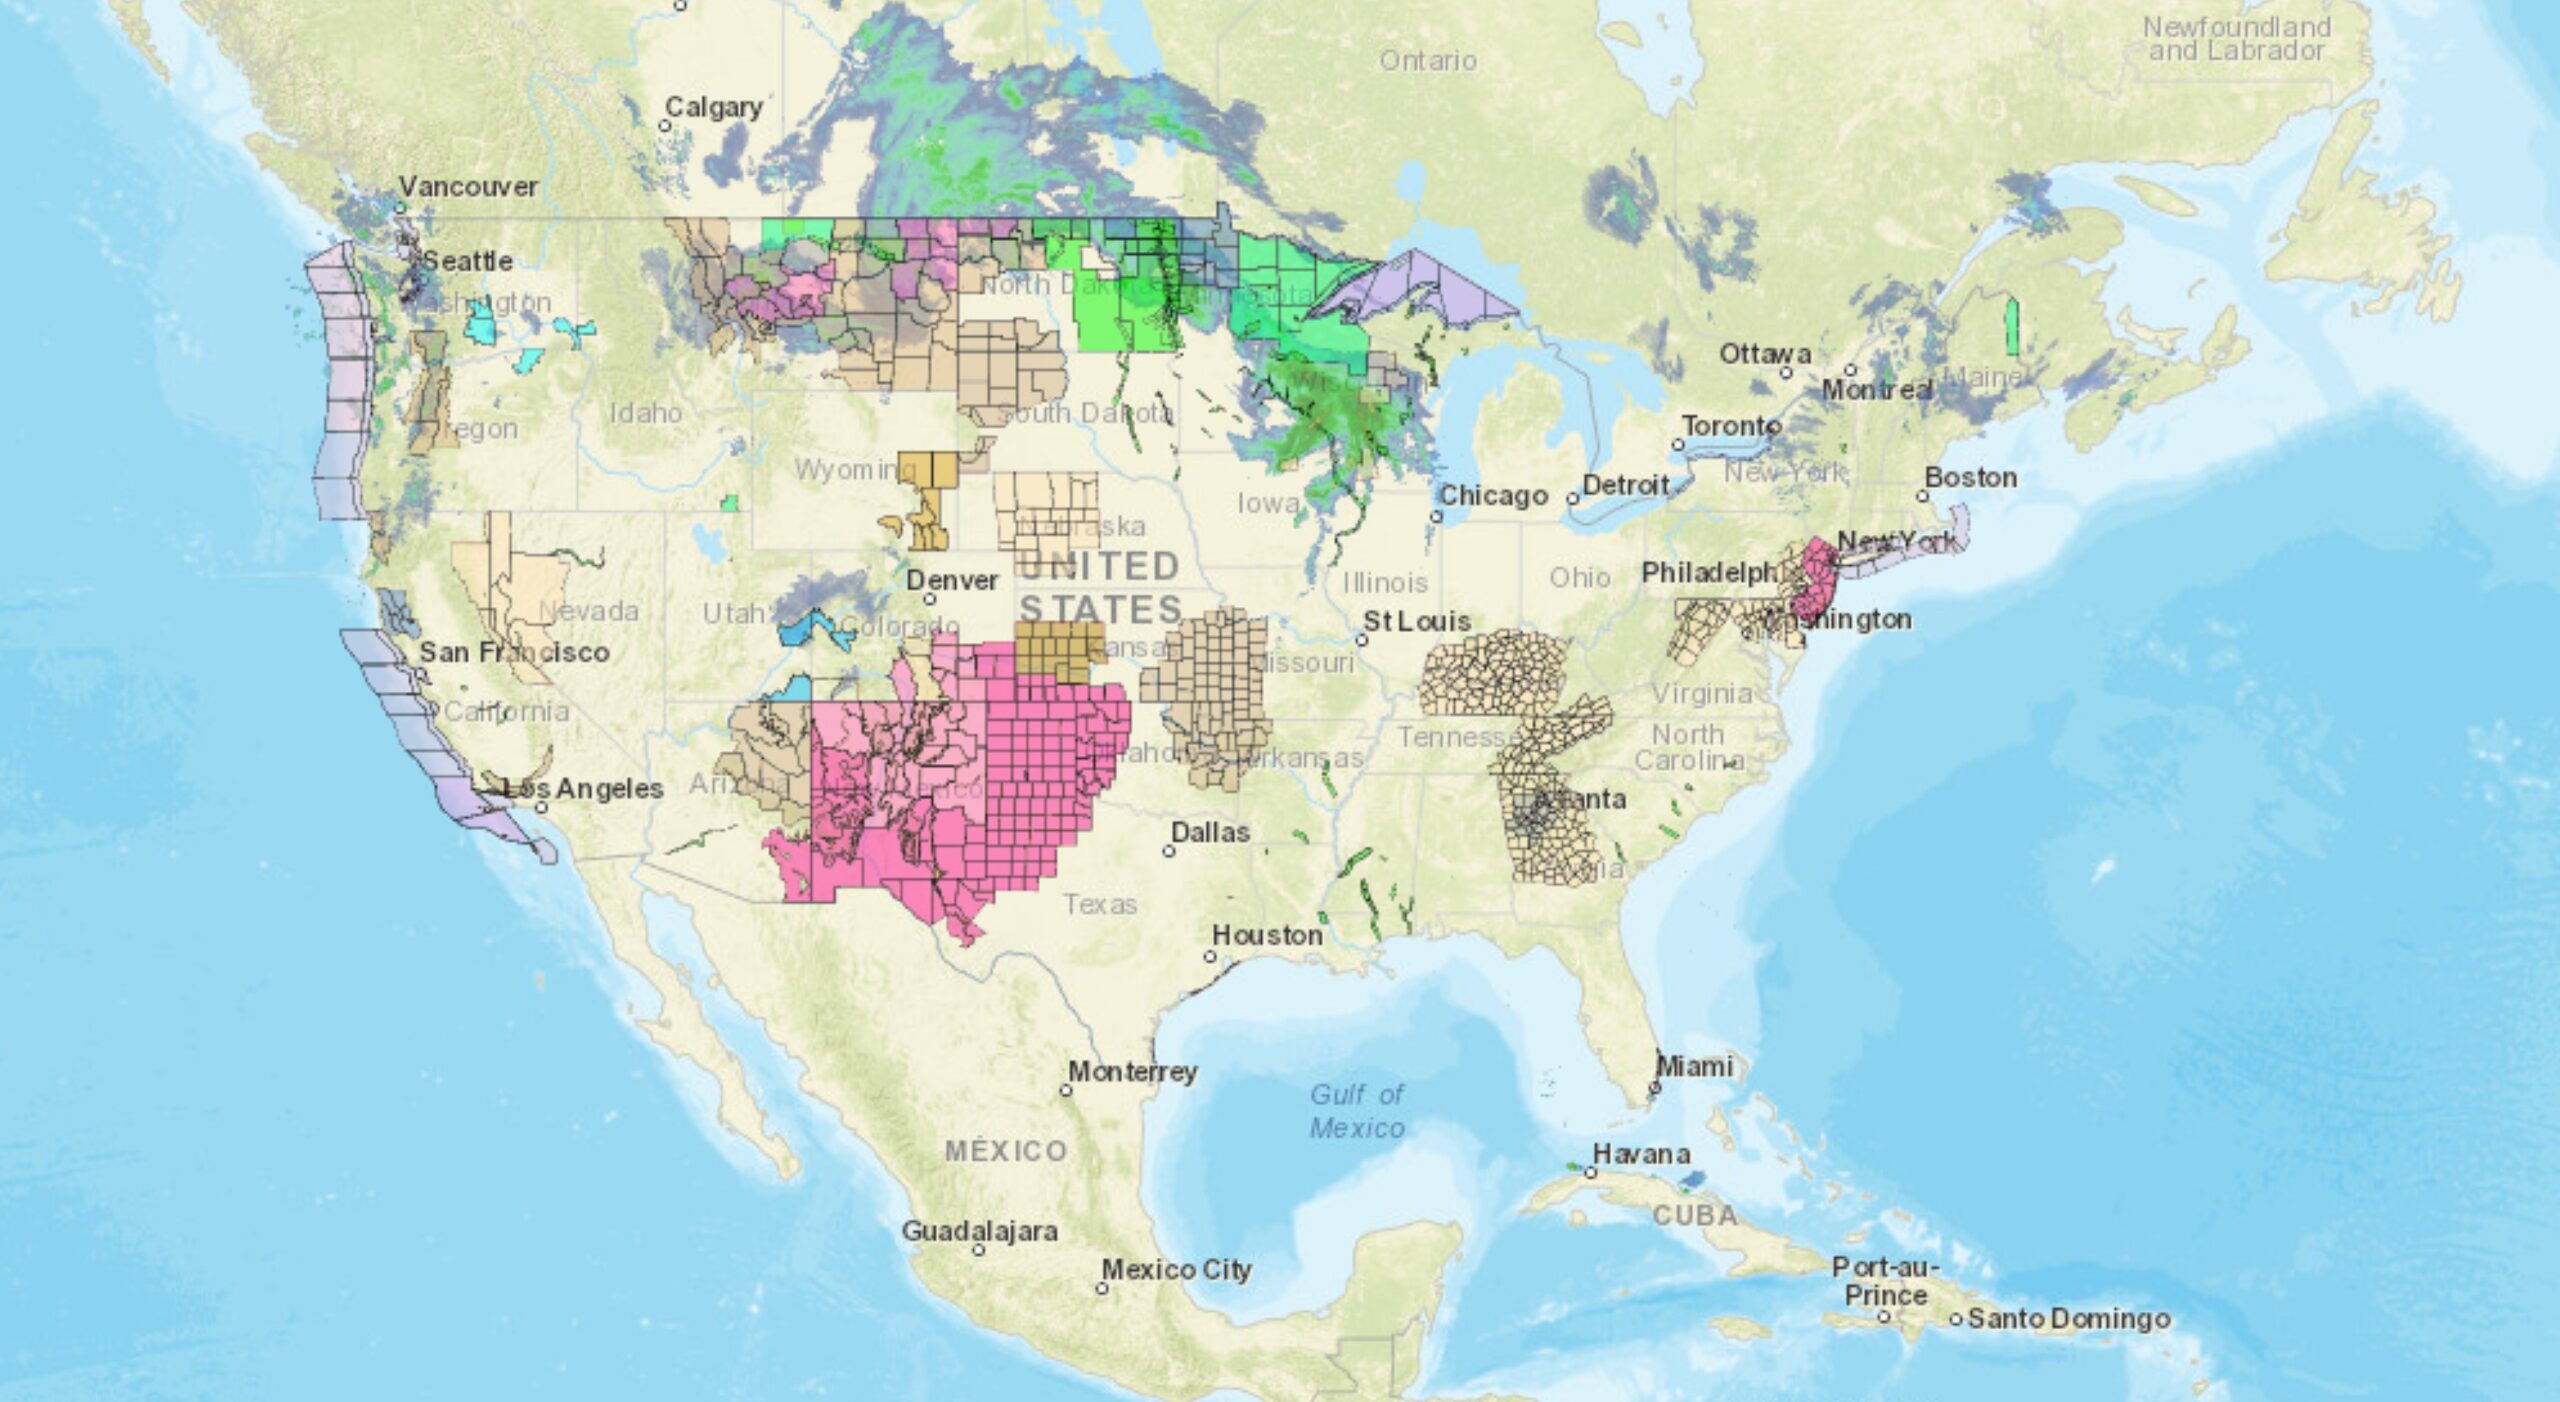
Radar maps are a type of map that uses radar technology to detect and track weather patterns, including precipitation and severe weather events. They are used by meteorologists, weather forecasters, and emergency responders to predict and respond to weather events, as well as by the general public to stay informed about weather conditions.
Types of Radar Maps
There are several types of radar maps, including reflectivity maps, velocity maps, and composite maps. Reflectivity maps show the intensity of precipitation, including rain, snow, and hail, as well as the size and shape of the precipitation particles. Velocity maps show the direction and speed of wind, which can help forecasters predict the movement of severe weather events.
Composite maps combine reflectivity and velocity data to provide a more complete picture of weather patterns and conditions. They are particularly useful for tracking severe weather events, such as thunderstorms and hurricanes.
Uses of Radar Maps
Radar maps are a critical tool for a variety of industries and individuals, providing real-time information about weather conditions and helping to predict and prepare for potential impacts from severe weather events.
- Meteorology and Weather Forecasting; One of the most significant uses of radar maps is in meteorology and weather forecasting. By analyzing radar data, meteorologists can predict weather patterns and conditions, including precipitation, wind speed and direction, and the movement of severe weather events such as thunderstorms and hurricanes. This information is critical for emergency response planning, as well as for informing the general public about potential weather hazards. They are also used to track weather conditions in real-time, allowing meteorologists to issue warnings and advisories as necessary. For example, radar maps can detect the formation of thunderstorms and issue warnings for high winds, lightning, and hail. They can also be used to track hurricanes and tropical storms, allowing for accurate predictions of the storm’s path and intensity.
- Emergency Response: Radar maps are an essential tool for emergency responders, allowing them to plan for and respond to severe weather events such as floods, tornadoes, and hurricanes. By providing real-time information about weather patterns and conditions, radar maps help emergency responders determine where to allocate resources and how to prepare for potential impacts. For example, if a radar map shows a severe thunderstorm approaching an area, emergency responders can prepare for potential power outages, downed trees, and flooding. They can also use radar maps to track the movement of storms and anticipate where they will make landfall or cause the most significant impact.
- Transportation: Radar maps are also essential for the transportation industry, including air travel, shipping, and road transportation. By providing real-time information about weather patterns and conditions, these maps help transportation companies plan routes, anticipate delays, and minimize potential impacts from severe weather events. For example, if a radar map shows a severe thunderstorm approaching an airport, air traffic controllers can divert flights or delay takeoffs and landings to ensure the safety of passengers and crew. Similarly, shipping companies can alter their routes to avoid potential hazards such as hurricanes and tropical storms, while road transportation companies can adjust their schedules to account for potential delays and closures due to severe weather events.
- Agriculture: Radar maps are also an essential tool for the agriculture industry, providing valuable information about weather patterns and conditions that can impact crop yields and quality. By analyzing radar data, farmers can anticipate weather conditions such as precipitation and wind, allowing them to plan their planting and harvesting schedules and mitigate potential impacts from severe weather events such as droughts and floods. For example, if these maps show that a severe thunderstorm is approaching an area, farmers can take steps to protect their crops, such as covering them with tarps or moving them to a sheltered location. Similarly, radar maps can be used to monitor soil moisture levels, helping farmers determine when to irrigate their crops and optimize their water usage.
Features of Radar Maps
Radar maps typically include a variety of features to help users understand weather patterns and conditions. These include colors to represent different intensities of precipitation, as well as symbols to represent different weather conditions, such as lightning and tornadoes.
Many modern radar maps are interactive, allowing users to zoom in and out, track weather patterns in real-time, and get detailed information about specific weather events. Some maps also include animations and time-lapse features, which can provide a more dynamic view of weather patterns over time.
Benefits of Radar Maps
The benefits of radar maps are numerous. They allow meteorologists and weather forecasters to predict weather conditions and plan for severe weather events, which can help save lives and prevent damage to property. They also provide valuable information for emergency responders and the general public, which can help them prepare for and respond to severe weather events.
Radar maps can also be a valuable resource for industries that are impacted by severe weather events, such as agriculture, transportation, and energy. By providing real-time information about weather conditions, these maps allow these industries to plan their activities and minimize potential impacts from severe weather events.
Learn more about Maps
- Topographical Maps: Representation of the physical features of a region or area.
- Contour Maps: Representation of the contours of the land surface or ocean floor.
- Raised Relief Maps: Representation of land elevations with raised features indicating landforms.
- Terrain Maps: Representation of the physical features of a terrain or landmass.
- USGS Topographic Maps: Representation of topographic features and land elevations based on USGS data.
- USGS Historical Topographic Maps: Representation of historical topographic maps created by the USGS.
- Watershed Maps: Representation of the areas where water flows into a particular river or lake.
- Elevation Maps: Representation of land and water elevations with high precision.
- Physical Maps: Representation of physical features of the Earth’s surface such as landforms, oceans, and plateaus.
- Bathymetric Maps: Representation of the topography and features of the ocean floor.
- NOAA Maps: Representation of atmospheric, oceanographic, and environmental data by NOAA.
- Nautical Maps: Representation of the underwater features and depth of an area for navigation purposes.
- Geologic Maps: Representation of the geologic features of an area such as rock types, faults, and folds.
- Satellite Maps: Representation of earth from high-definition satellite imagery.