Tectonic maps are geological maps that display the distribution of geological structures, rock types, and other features of the Earth’s crust that are formed due to the movement of tectonic plates. These maps are used to identify areas of geological activity and help researchers understand the structure and evolution of the Earth’s crust. Tectonic maps have become an essential tool for geologists, engineers, and planners who are involved in natural resource exploration, land-use planning, and disaster mitigation efforts.
Types of Tectonic Maps
Here are different types of tectonic maps that are used in geology and natural resource exploration.
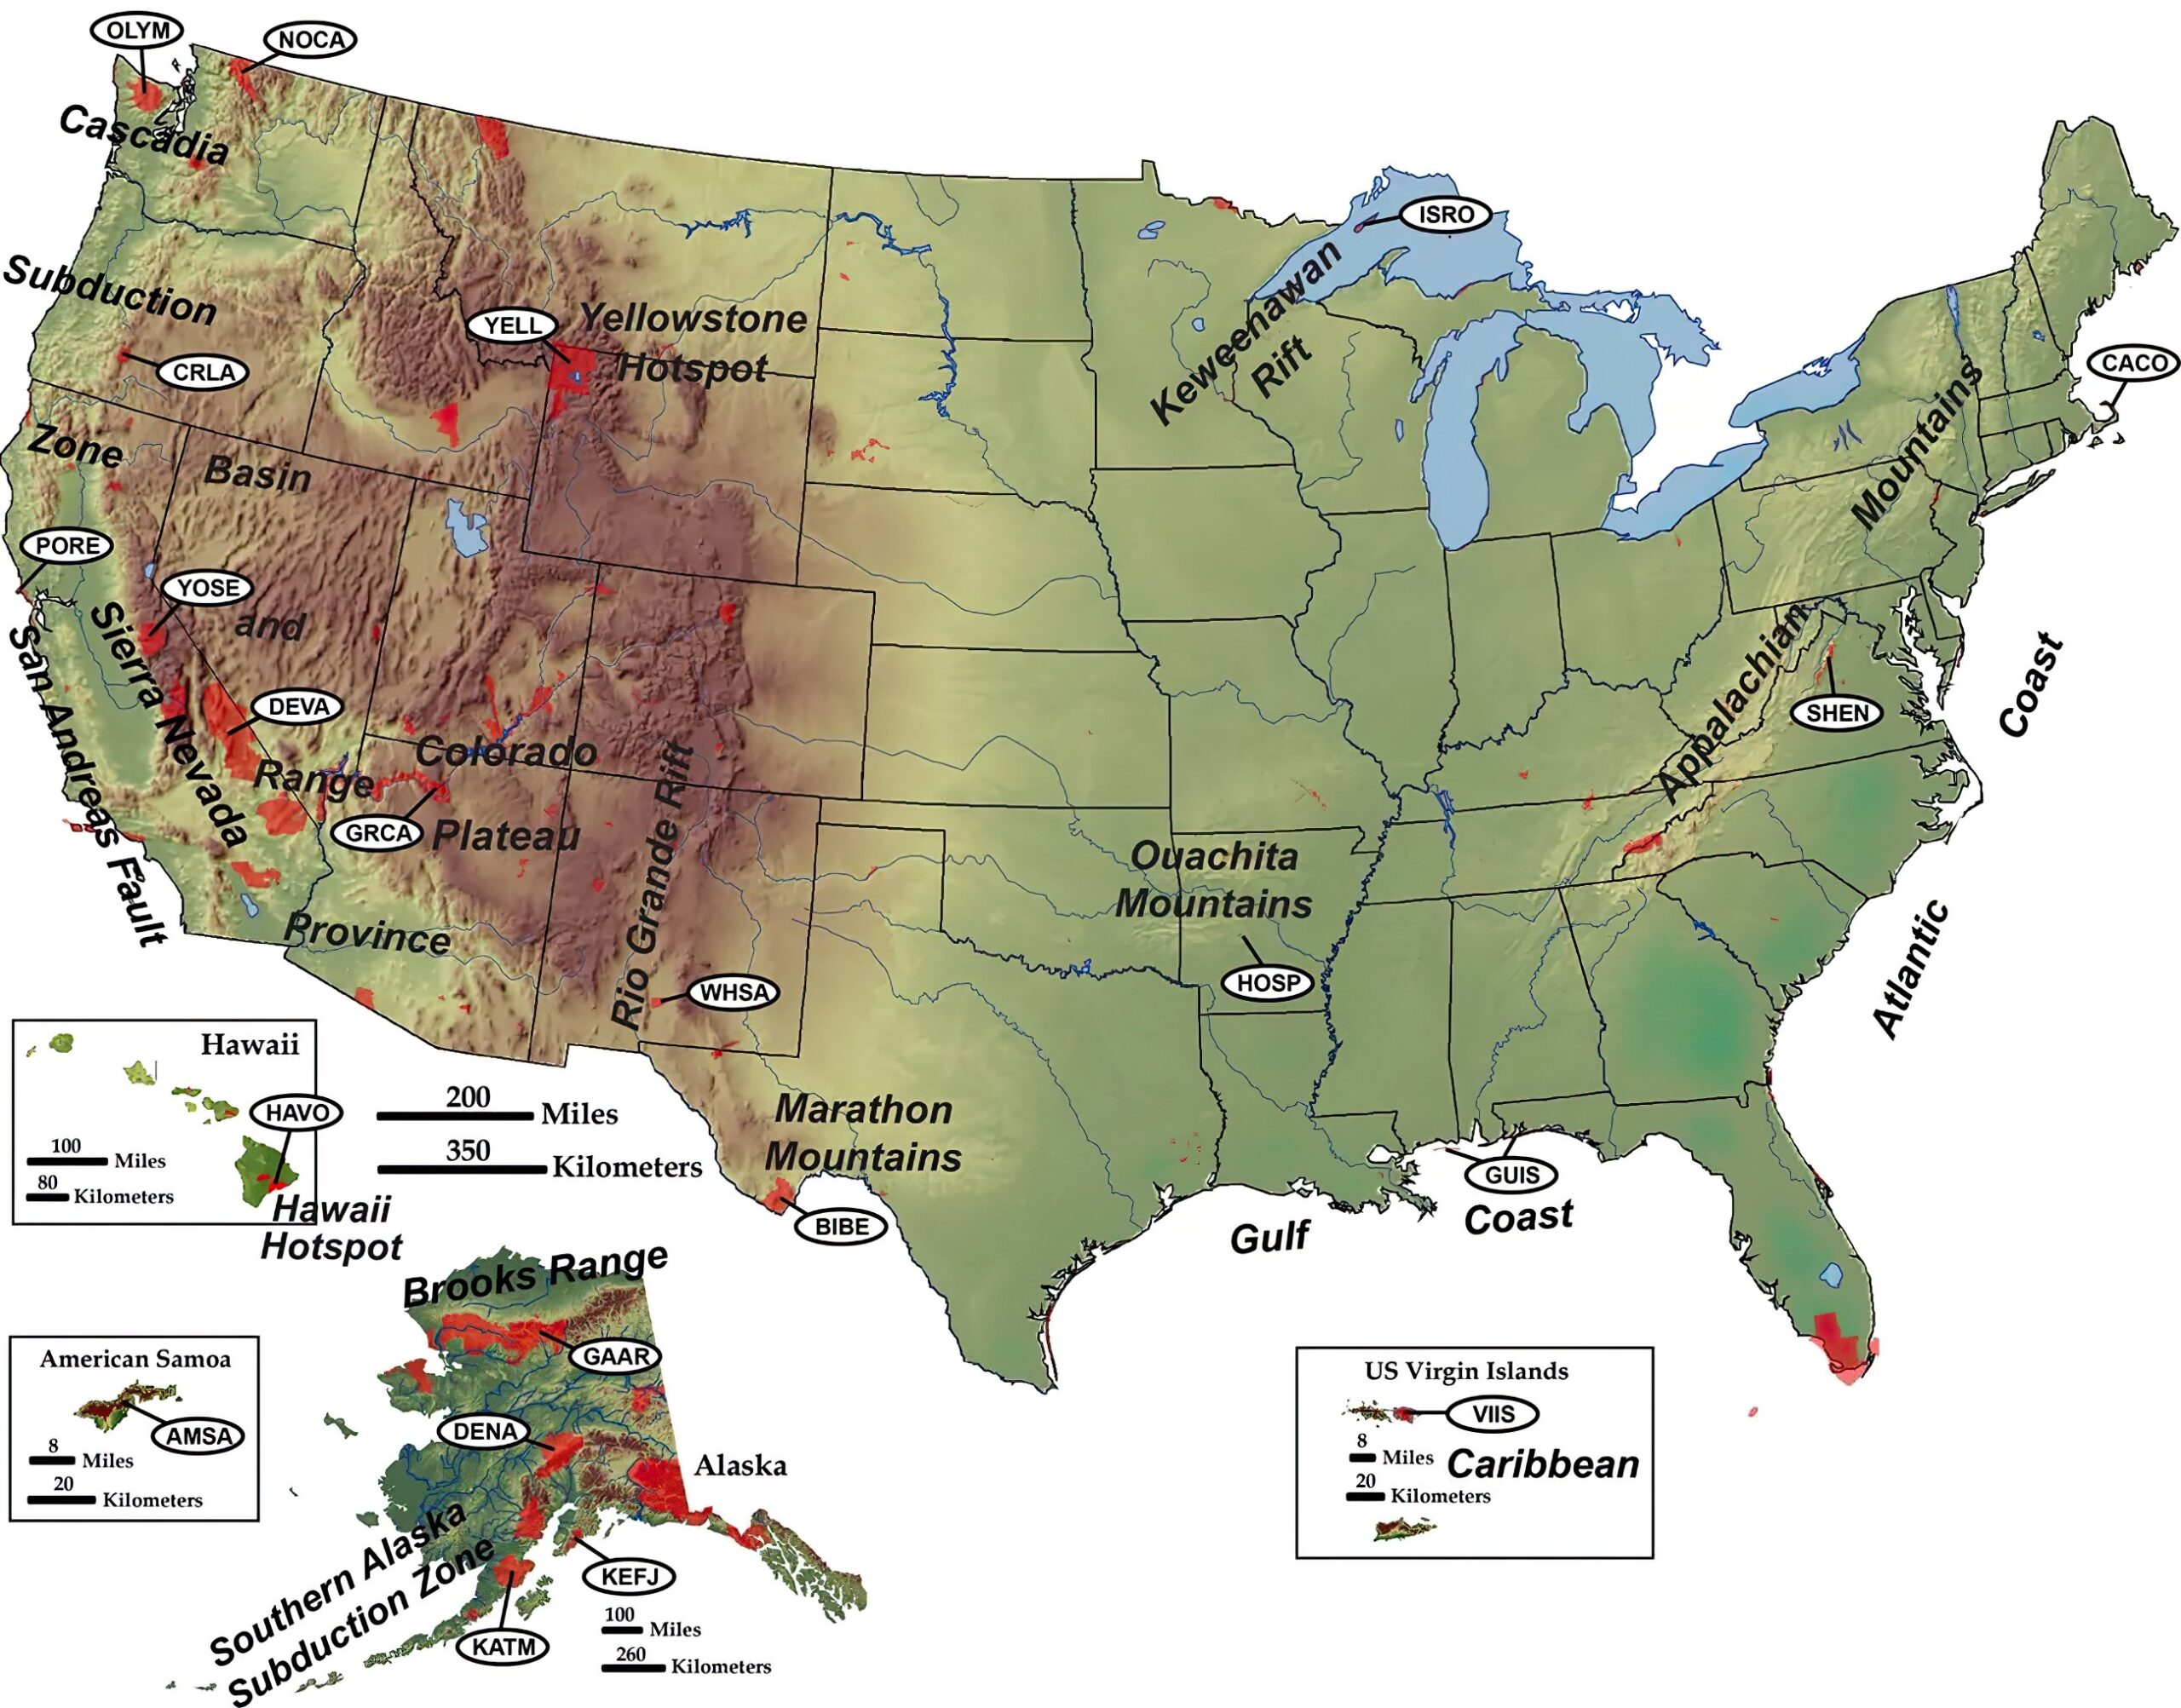
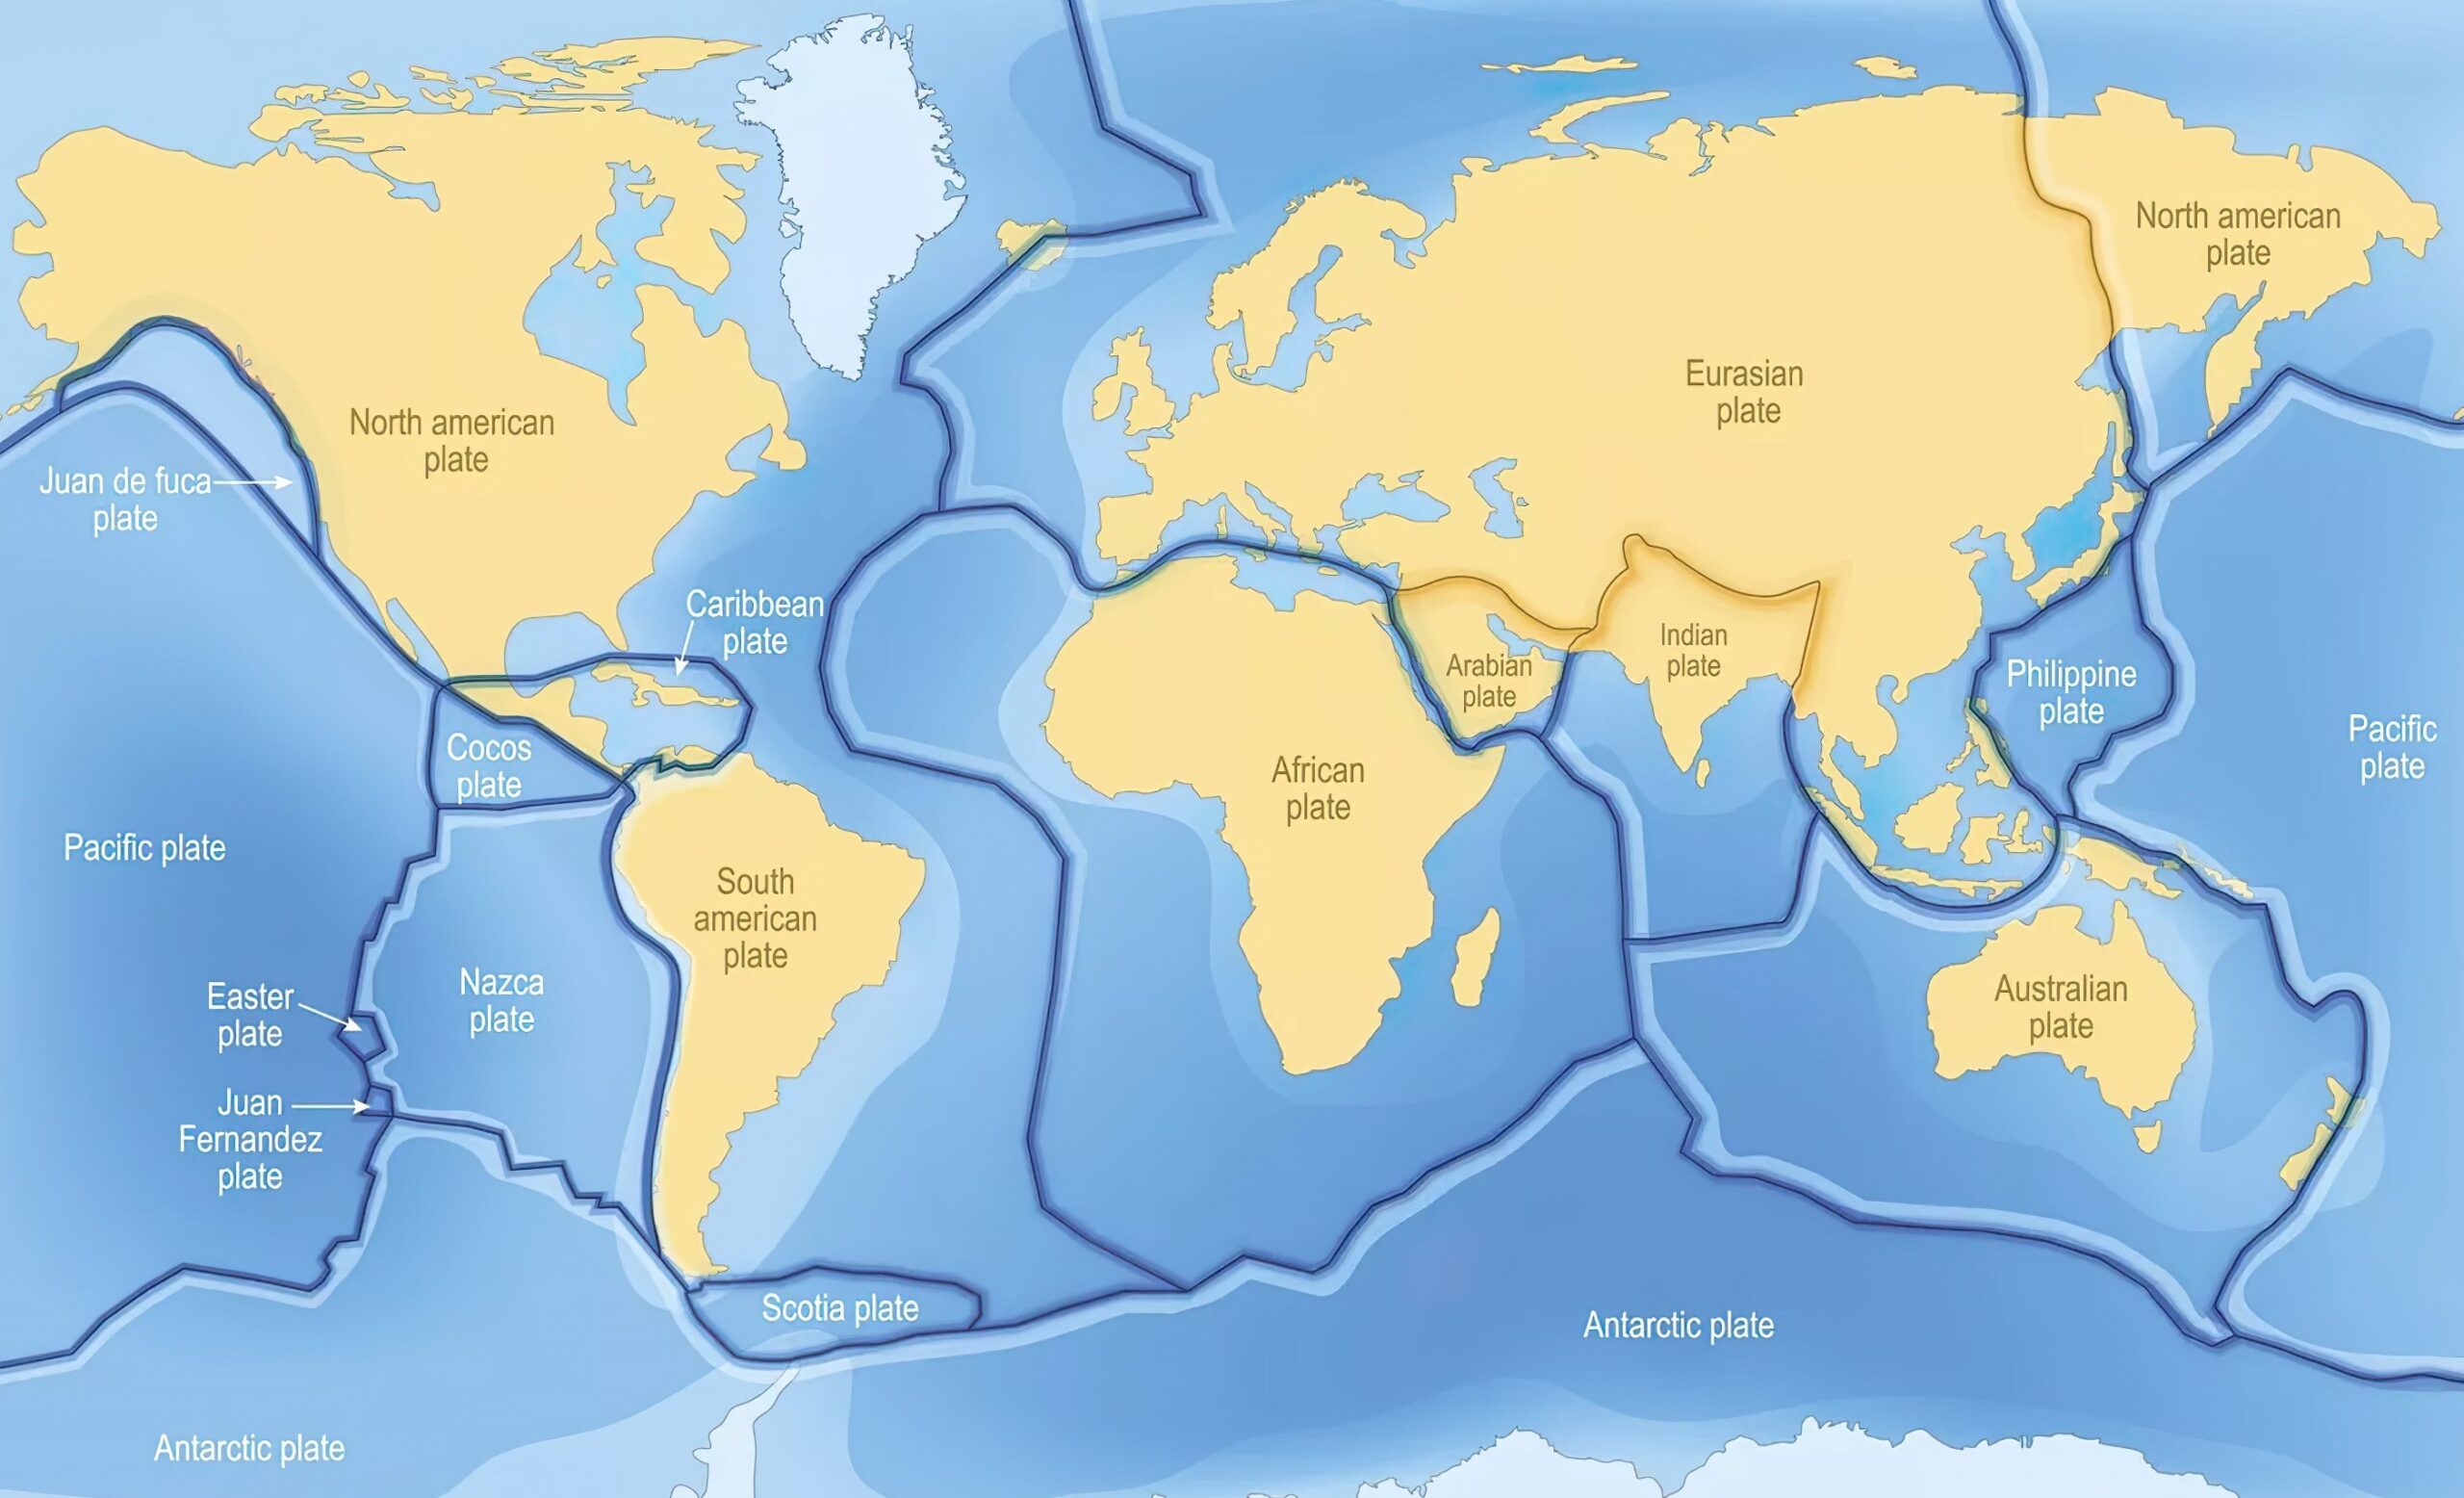
- Regional Tectonic Maps: Regional tectonic maps cover a large area, typically an entire country or continent, and show the broad patterns of geological structures, such as major fault systems, sedimentary basins, and volcanic provinces. These maps are used to identify and study the geological history of a particular region. They help geologists understand the broad-scale tectonic features of a region, such as the boundaries of tectonic plates and the movement of magma under the Earth’s surface. Regional tectonic maps are also used in natural hazard assessment, such as identifying areas at risk of earthquakes, volcanic eruptions, and landslides.
- Local Tectonic Maps: Local tectonic maps cover smaller areas, such as individual mountain ranges or sedimentary basins, and provide more detailed information about the geology of these areas. These maps are used to study the geological history of a specific area, including the types of rock formations present and their ages. Local tectonic maps are often used in mineral exploration and groundwater resource assessment, as they help identify areas of potential mineral deposits and water resources.
- Detailed Tectonic Maps: Detailed tectonic maps are produced for specific sites, such as mines or dams, and provide highly detailed information about the geological structures and rock types that are present. These maps are used in engineering and construction projects to identify potential hazards and design appropriate safety measures. Detailed tectonic maps are also used in oil and gas exploration to identify potential reservoirs and develop drilling plans.
- Geophysical Tectonic Maps: Geophysical tectonic maps are created using geophysical data, such as gravity and magnetic measurements, to identify and map geological structures. These maps are used in natural resource exploration, such as oil and gas exploration, as they can identify areas of potential mineral and hydrocarbon deposits. Geophysical tectonic maps are also used in natural hazard assessment, such as identifying areas at risk of earthquakes and landslides.
- Paleogeographic Tectonic Maps: Paleogeographic tectonic maps show the distribution of geological structures and land masses at different points in geological history. These maps are used to study the evolution of the Earth’s crust over time and help researchers understand the geological processes that have shaped the planet. Paleogeographic tectonic maps are also used in natural resource exploration, as they can identify areas where particular minerals or fossil fuels may be present.
Uses of Tectonic Maps
Tectonic maps are used in a wide variety of fields, including mineral exploration, oil and gas exploration, groundwater resource assessment, geothermal energy exploration, and natural hazard assessment. Tectonic maps help geologists identify areas of potential mineral deposits and oil and gas reserves, as these resources are often associated with specific geological structures, such as fault zones and sedimentary basins. Tectonic maps are also used to assess the risk of natural hazards such as earthquakes, landslides, and volcanic eruptions, as these hazards are often related to tectonic activity.
Features of Tectonic Maps
Tectonic maps can show a wide range of features that are important for understanding the geological history of a region:
- Faults: One of the most important features shown on tectonic maps are faults, which are fractures in the Earth’s crust where one block of rock has moved relative to another. Faults are often associated with earthquakes and can indicate areas of tectonic activity. Tectonic maps show the location and extent of faults, which can be used to understand the nature and history of earthquakes in a particular region.
- Rock Types: These maps also show the different types of rocks present in a region. This information can be used to understand the geological history of the area and the processes that have shaped the landscape. For example, sedimentary rocks can indicate the presence of ancient oceans or lakes, while volcanic rocks can suggest the presence of past volcanic activity.
- Structures: Tectonic maps can show a range of geological structures, including folds, domes, and basins. These structures can provide insights into the tectonic history of a region and the forces that have acted on the Earth’s crust. Folds, for example, can indicate areas where the Earth’s crust has been compressed, while domes can suggest areas of volcanic activity.
- Topography: Tectonic maps often show the topography of a region, which can provide important information about the landscape and the forces that have shaped it. For example, mountain ranges can be indicative of tectonic activity, while valleys and basins can suggest areas of sediment accumulation.
- Stratigraphy: These maps can also show the relative ages of different rock formations, which can be used to construct a geological timeline of a region. This information can be used to understand the geological history of the area and the processes that have shaped it over time.
- Geological Symbols: Finally, tectonic maps often use a range of geological symbols to represent different features and rock types. These symbols can include different colors and patterns to represent different types of rock formations, as well as symbols for faults, folds, and other geological structures.
Benefits of Tectonic Maps
The benefits of tectonic maps are numerous. They provide important information for natural resource exploration, land-use planning, and disaster mitigation efforts. Tectonic maps can help identify areas of potential mineral deposits and oil and gas reserves, which can lead to economic development and job creation. They can also help identify areas of high risk for natural hazards, allowing for better planning and preparation to mitigate the impact of these hazards. In addition, tectonic maps can help researchers understand the geological history and evolution of the Earth’s crust, which is essential for understanding the planet’s overall geological processes.
Learn more about Maps
- Topographical Maps: Representation of the physical features of a region or area.
- Contour Maps: Representation of the contours of the land surface or ocean floor.
- Raised Relief Maps: Representation of land elevations with raised features indicating landforms.
- Terrain Maps: Representation of the physical features of a terrain or landmass.
- USGS Topographic Maps: Representation of topographic features and land elevations based on USGS data.
- USGS Historical Topographic Maps: Representation of historical topographic maps created by the USGS.
- Watershed Maps: Representation of the areas where water flows into a particular river or lake.
- Elevation Maps: Representation of land and water elevations with high precision.
- Physical Maps: Representation of physical features of the Earth’s surface such as landforms, oceans, and plateaus.
- Bathymetric Maps: Representation of the topography and features of the ocean floor.
- NOAA Maps: Representation of atmospheric, oceanographic, and environmental data by NOAA.
- Nautical Maps: Representation of the underwater features and depth of an area for navigation purposes.
- Geologic Maps: Representation of the geologic features of an area such as rock types, faults, and folds.
- Satellite Maps: Representation of earth from high-definition satellite imagery.