Thermal maps, also known as thermographic maps or infrared images, are visual representations of the temperature distribution of a particular area. These maps are created using infrared imaging technology, which captures the infrared radiation emitted by objects and converts it into visible images. Thermal maps are used in a wide range of applications, including engineering, building construction, energy management, and environmental monitoring.
Types of Thermal Maps
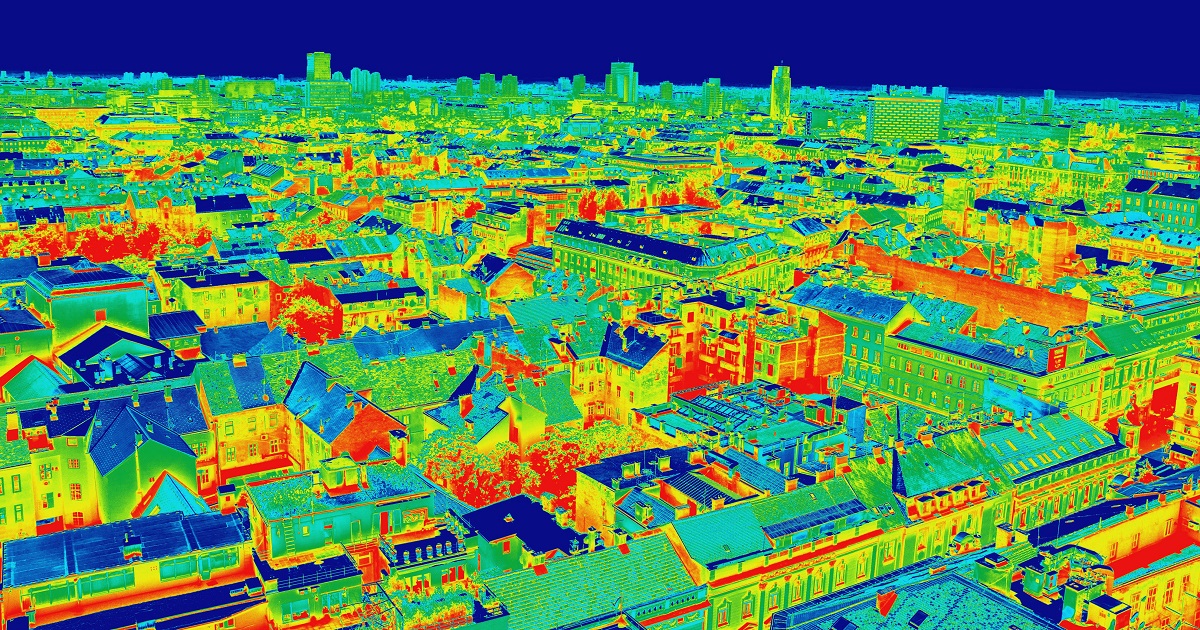
There are two main types of thermal maps: qualitative and quantitative. Qualitative thermal maps are visual representations of the temperature distribution of an area, where warmer areas are represented by different colors or shades, such as red, orange, and yellow, while cooler areas are represented by blue and green colors. Quantitative thermal maps provide more detailed information about the temperature distribution, including the actual temperature values of each pixel. These maps are commonly used in scientific research and engineering applications.
Uses of Thermal Maps
Thermal maps have a wide range of uses, including:
Building construction and maintenance: Thermal maps are used in building construction and maintenance to identify areas with poor insulation or air leakage. By identifying these areas, building owners and managers can take corrective action to improve energy efficiency and reduce heating and cooling costs.
Electrical and mechanical engineering: Thermal maps are used in electrical and mechanical engineering to identify hotspots and areas of overheating in machinery and equipment. By identifying these areas, engineers can take corrective action to prevent equipment failure and reduce downtime.
Environmental monitoring: Thermal maps are used in environmental monitoring to identify areas with high or low temperatures, which can indicate areas of interest for further study, such as areas with geothermal activity or water leakage.
Agriculture: Thermal maps are used in agriculture to identify areas with different soil temperatures, which can affect plant growth and yield. By identifying these areas, farmers can take corrective action to improve crop yields and reduce the use of fertilizers and pesticides.
Features of Thermal Maps
Thermal maps have several features that make them useful for a wide range of applications. These features include:
Temperature sensitivity: Thermal maps are highly sensitive to temperature changes, allowing for the detection of even small temperature differences.
Non-contact measurement: Thermal maps can be created without physically contacting the object being measured, making them ideal for use in hazardous or hard-to-reach areas.
Real-time imaging: Thermal maps can be created in real-time, allowing for the detection of temperature changes as they occur.
High resolution: Modern thermal imaging cameras have high resolution, allowing for detailed images and accurate temperature measurements.
Benefits of Thermal Maps
Thermal maps offer several benefits, including:
Improved energy efficiency: By identifying areas with poor insulation or air leakage, thermal maps can help building owners and managers improve energy efficiency and reduce heating and cooling costs.
Improved safety: By identifying hotspots and areas of overheating in machinery and equipment, these maps can help prevent equipment failure and reduce the risk of fire or explosion.
Improved crop yields: By identifying areas with different soil temperatures, thermal maps can help farmers improve crop yields and reduce the use of fertilizers and pesticides.
Improved environmental monitoring: By identifying areas with high or low temperatures, these maps can help identify areas of interest for further study, such as areas with geothermal activity or water leakage.
Learn more about Maps
- Topographical Maps: Representation of the physical features of a region or area.
- Contour Maps: Representation of the contours of the land surface or ocean floor.
- Raised Relief Maps: Representation of land elevations with raised features indicating landforms.
- Terrain Maps: Representation of the physical features of a terrain or landmass.
- USGS Topographic Maps: Representation of topographic features and land elevations based on USGS data.
- USGS Historical Topographic Maps: Representation of historical topographic maps created by the USGS.
- Watershed Maps: Representation of the areas where water flows into a particular river or lake.
- Elevation Maps: Representation of land and water elevations with high precision.
- Physical Maps: Representation of physical features of the Earth’s surface such as landforms, oceans, and plateaus.
- Bathymetric Maps: Representation of the topography and features of the ocean floor.
- NOAA Maps: Representation of atmospheric, oceanographic, and environmental data by NOAA.
- Nautical Maps: Representation of the underwater features and depth of an area for navigation purposes.
- Geologic Maps: Representation of the geologic features of an area such as rock types, faults, and folds.
- Satellite Maps: Representation of earth from high-definition satellite imagery.