Weather maps are a type of map that provides information about weather patterns and conditions in a particular region. They are used by meteorologists and weather forecasters to predict weather conditions, plan for severe weather events, and inform the public about potential weather hazards.
Types of Weather Maps
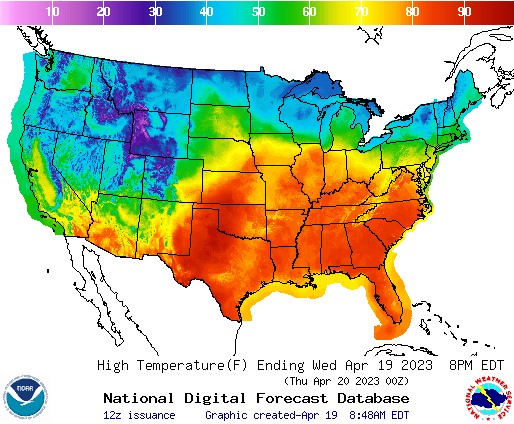
There are several types of weather maps, including surface maps, upper-level maps, radar maps, and satellite maps. Surface maps show weather conditions at ground level, including temperature, precipitation, and wind direction. Upper-level maps show weather conditions at higher altitudes, including jet streams and other atmospheric patterns.
Radar maps use radar technology to detect precipitation and other weather events in real-time. They are particularly useful for tracking severe weather, such as thunderstorms and hurricanes. Satellite maps use images from satellites in space to show cloud cover and other weather patterns.
Another type of weather map is a climate map, which shows average weather conditions over a period of time, typically 30 years. Climate maps are used to track long-term trends in weather patterns, such as changes in temperature and precipitation.
Uses of Weather Maps
Weather maps are an essential tool for meteorologists, researchers, and weather enthusiasts. These maps provide a visual representation of the current and future weather conditions, allowing individuals to make informed decisions based on the information provided.
- Planning outdoor activities: Weather maps play a crucial role in planning outdoor activities such as sports events, picnics, and camping trips. The map provides information about the weather conditions in a particular area, including temperature, humidity, precipitation, wind speed, and direction. This information can help individuals make decisions about what to wear, what to bring, and whether or not to proceed with the planned activity.
- Aviation: Weather maps are also vital for the aviation industry. Pilots use these maps to plan their routes and avoid dangerous weather conditions such as thunderstorms, turbulence, and icing. They provide information about the current and future weather conditions along a specific flight path, allowing pilots to adjust their flight plans accordingly.
- Agriculture: Agriculture is another sector that relies heavily on weather maps. Farmers use these maps to make decisions about planting and harvesting crops. For example, they can use the maps to determine the best time to plant crops based on the temperature, precipitation, and soil moisture. They can also use the maps to monitor drought conditions and make decisions about irrigation.
- Emergency management: Weather maps are an essential tool for emergency management agencies. These agencies use these maps to monitor and predict severe weather conditions such as hurricanes, tornadoes, and floods. The maps help emergency managers plan for potential disasters by identifying areas that may be affected by severe weather and mobilizing resources to respond quickly.
- Energy industry: The energy industry also relies on weather maps. Energy companies use weather maps to predict energy demand and adjust their supply accordingly. For example, during hot summer months, energy companies can use these maps to predict high demand for air conditioning and increase their power supply accordingly.
- Construction: Weather maps are also used in the construction industry. Contractors use them to plan construction projects based on weather conditions. For example, they can use the maps to determine the best time to pour concrete based on the temperature and humidity. They can also use the maps to plan for potential weather-related delays.
- Media: Weather maps are a common feature in news broadcasts and newspapers. Meteorologists use maps to inform viewers and readers about the current and future weather conditions. The maps help to explain weather patterns and provide context for weather-related stories.
- Transportation: Weather maps are also essential for transportation. Commuters use these maps to plan their daily commute and avoid traffic delays caused by severe weather. Transportation companies use the maps to plan for potential weather-related disruptions, such as flight cancellations or train delays.
- Recreation: Weather maps are also useful for individuals planning recreational activities such as hiking, fishing, and skiing. These individuals can use maps to plan their activities based on the weather conditions in the area. For example, a skier can use the map to determine the best time to hit the slopes based on the temperature and snowfall.
- Education: Finally, weather maps are also used in education. Teachers use maps to teach students about weather patterns, climate change, and the impacts of severe weather. Students can learn about weather patterns by analyzing weather maps and making predictions about future weather conditions.
Features of Weather Maps
Weather maps typically include a variety of features to help users understand weather patterns and conditions. These include symbols to represent different weather conditions, such as clouds, rain, and snow. They may also include lines to show temperature and pressure gradients, as well as arrows to show wind direction and speed.
Many modern weather maps are interactive, allowing users to zoom in and out, track weather patterns in real-time, and get detailed information about specific weather events. Some maps also include animations and time-lapse features, which can provide a more dynamic view of weather patterns over time.
Benefits of Weather Maps
The benefits of weather maps are numerous. They allow meteorologists and weather forecasters to predict weather conditions and plan for severe weather events, which can help save lives and prevent damage to property. They also provide valuable information for farmers, airlines, and other industries that rely on weather conditions to plan their activities.
These maps can also be a valuable resource for the general public. By providing real-time information about weather conditions, they allow people to plan their activities and stay safe during severe weather events. They also provide a greater understanding of weather patterns and conditions, which can help people better appreciate the natural world.
Learn more about Maps
- Topographical Maps: Representation of the physical features of a region or area.
- Contour Maps: Representation of the contours of the land surface or ocean floor.
- Raised Relief Maps: Representation of land elevations with raised features indicating landforms.
- Terrain Maps: Representation of the physical features of a terrain or landmass.
- USGS Topographic Maps: Representation of topographic features and land elevations based on USGS data.
- USGS Historical Topographic Maps: Representation of historical topographic maps created by the USGS.
- Watershed Maps: Representation of the areas where water flows into a particular river or lake.
- Elevation Maps: Representation of land and water elevations with high precision.
- Physical Maps: Representation of physical features of the Earth’s surface such as landforms, oceans, and plateaus.
- Bathymetric Maps: Representation of the topography and features of the ocean floor.
- NOAA Maps: Representation of atmospheric, oceanographic, and environmental data by NOAA.
- Nautical Maps: Representation of the underwater features and depth of an area for navigation purposes.
- Geologic Maps: Representation of the geologic features of an area such as rock types, faults, and folds.
- Satellite Maps: Representation of earth from high-definition satellite imagery.