
What Is a Bathymetric Map? Planning a Physical Depth Display
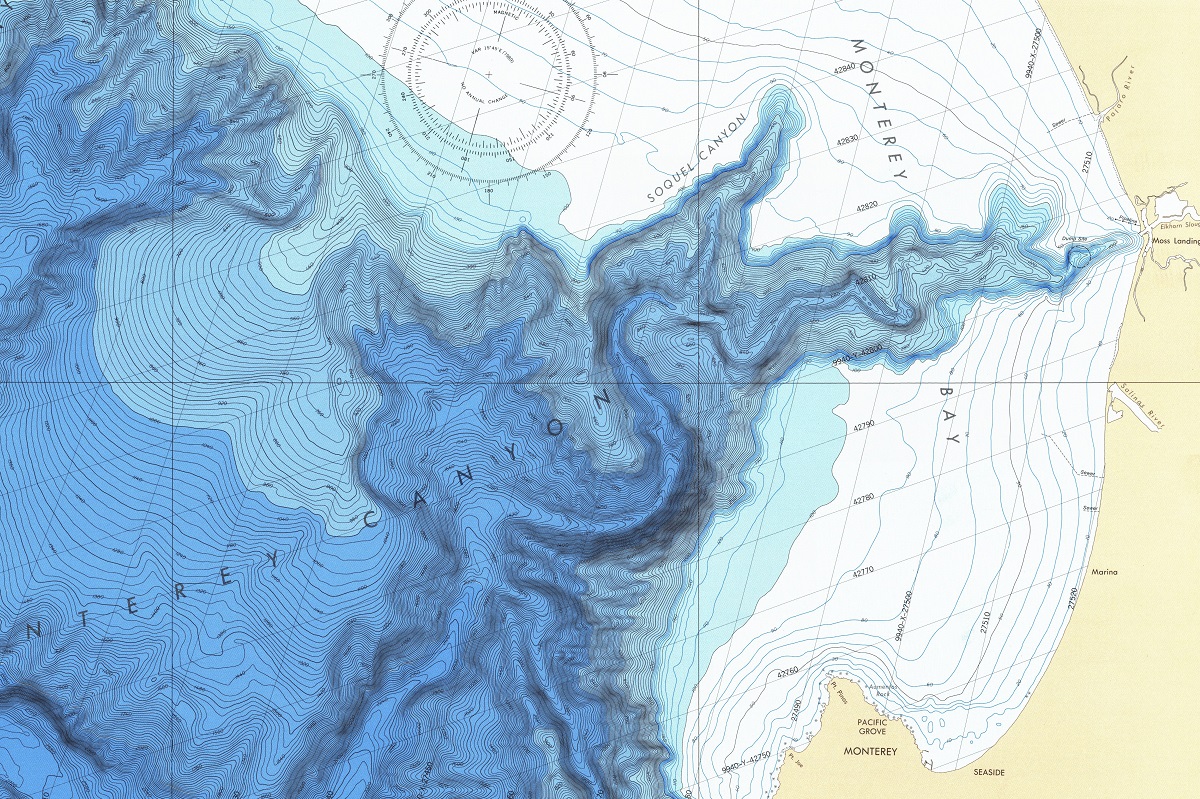
A bathymetric map represents the depths and shapes of underwater terrain. NOAA describes bathymetry as the study of the beds or floors of water bodies, with depth contours or isobaths used to show changes across the seafloor or lakebed. A custom physical display turns that information into a map or model that can be read from above, across a room, or at close range.
Define the water body and geographic extent
Begin with the exact area to show: a lake, bay, harbor, river reach, coastline, offshore feature, or broader marine region. State the shoreline, islands, channels, inlets, boundaries, and nearby land that should remain in context. The chosen extent affects the scale, label density, amount of surrounding terrain, and the physical size needed for depth patterns to remain legible.
Identify the depth data
A useful brief names the bathymetric source, coverage, coordinate system, vertical reference, resolution, and any gaps or restrictions that need attention. Do not treat a display model as a substitute for a hydrographic survey or navigation product. The model should represent the selected source data in a clear physical form, while project-specific accuracy and data-use questions stay with the appropriate technical team.
Choose contours, color, and relief
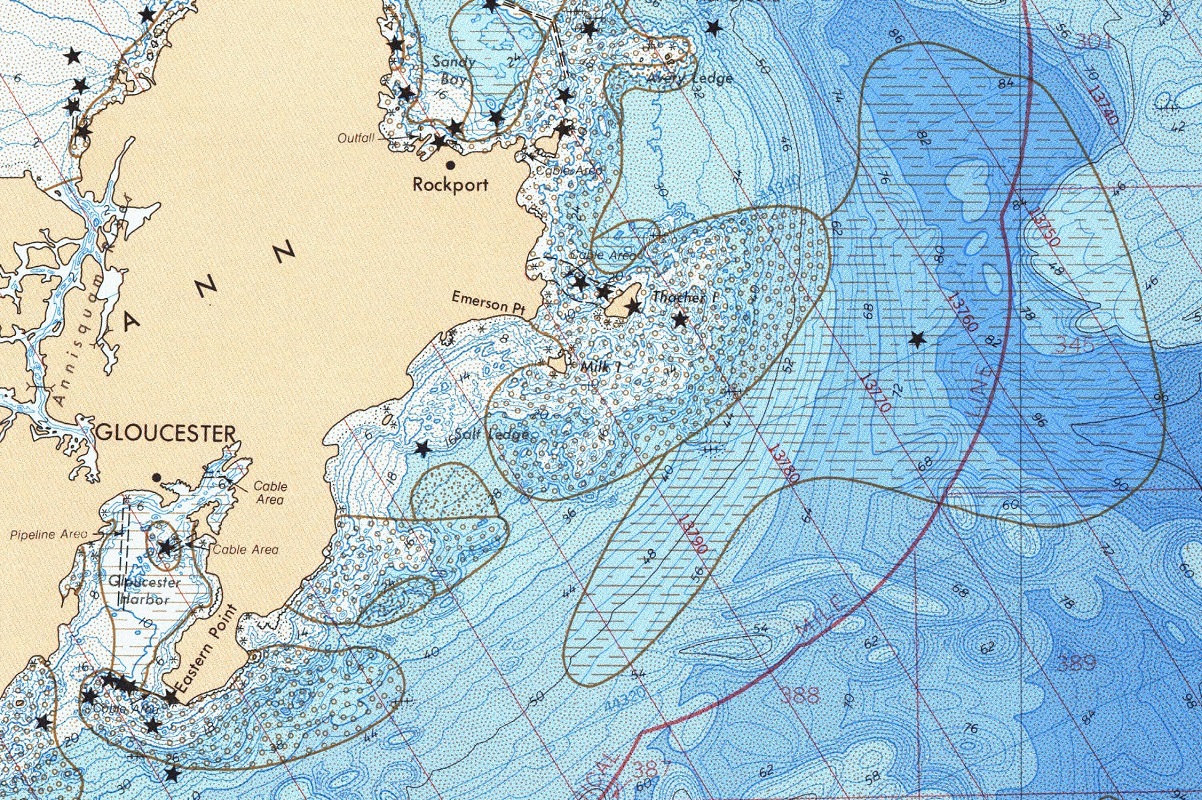
Depth contours, color bands, shading, labels, and a raised surface can communicate different aspects of underwater terrain. Decide whether the display should emphasize a deep channel, a shelf, a basin, a reef, a harbor approach, or the overall shape of the water body. Vertical or depth exaggeration may help a broad area read in a room, but it should be treated as a display decision and clearly distinguished from the underlying measurement scale.
Decide how much shoreline and land context belongs
Some bathymetric displays are strongest when the shoreline is kept simple and the underwater form carries the focus. Others need beaches, islands, ports, roads, cities, terrain, or property boundaries so viewers can orient themselves. Make the relationship between land and water explicit in the brief, especially when the model will be used for interpretation or education.
Plan for viewing distance
A close tabletop model can support fine contours, markers, and small labels. A lobby, museum, classroom, or visitor-center display needs a stronger hierarchy and fewer competing annotations. Record the viewing height, approach direction, lighting, display footprint, and whether people will walk around the piece. These decisions influence the physical depth, base, edge treatment, and label size.
Bathymetric display planning checklist
- Named water body, shoreline, boundary, orientation, and geographic extent
- Bathymetric files, depth units, vertical reference, resolution, and source notes
- Contours, color bands, labels, channels, islands, reefs, or other features to emphasize
- Preferred physical dimensions, scale, depth exaggeration, and viewing distance
- Flat printed map, raised-relief model, combined land-and-water model, or exhibit format
- Delivery route, installation setting, storage, schedule, and any review requirements
Keep the map useful to its audience
The strongest bathymetric displays do more than make a surface look dimensional. They guide the viewer to a relationship between depth, shoreline, terrain, and place. A clear legend, restrained color system, carefully chosen contours, and a well-defined geographic boundary usually communicate more effectively than adding every available layer.
Plan a custom bathymetric model or map
Share the water-body boundary, depth data, display size, relief direction, labels, viewing conditions, and schedule through the custom topographical models service. The 3D topographical model gallery provides useful context for comparing physical relief, printed information, and display furniture.
Related bathymetric-map resources
Explore custom topographical models and physical depth displays while you plan data, contours, relief, scale, and placement.
Custom 3D Map Quote
Share the size, placement, finish, timing, and reference files available for your project.