Geologic Maps

What is a Geologic Map?

We build 2D and 3D Geologic Maps

Table of Contents

Geologic Maps

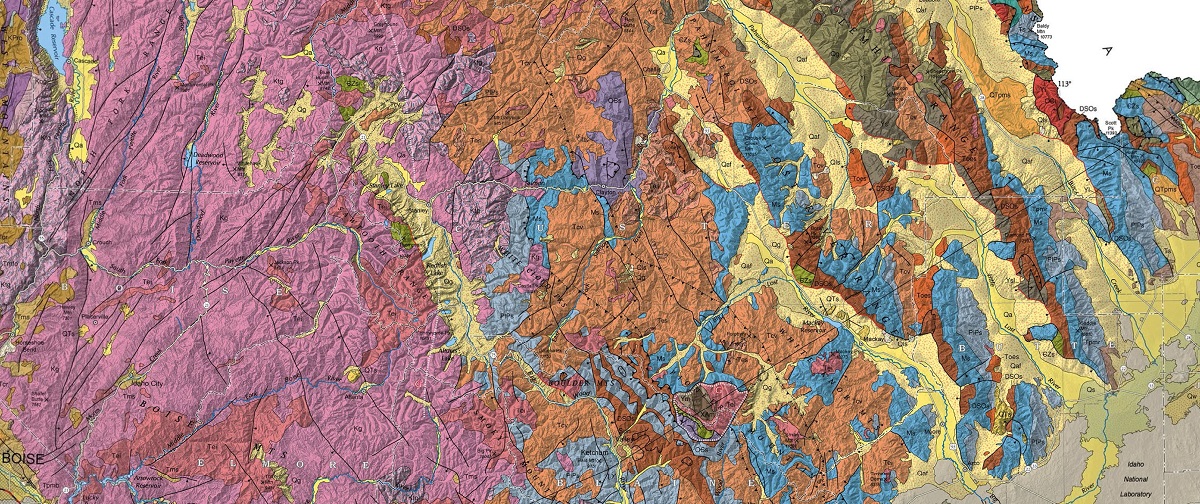
Geologic maps are not just dry, technical documents for geologists and mining companies.  They are stunning visual representations of the geological history of our planet, full of colors, patterns, and shapes that tell stories of the Earth’s past and present.  With these maps, we can unravel the mysteries of ancient rock formations, pinpoint mineral deposits, and trace the movements of tectonic plates.  They are a gateway to a world hidden beneath our feet, waiting to be explored and understood.

But beyond their practical applications, geologic maps also hold a great deal of aesthetic appeal.  Their colorful and intricate patterns draw the eye and spark the imagination, inviting us to explore the hidden depths of the Earth.  From the winding lines of fault zones to the jagged peaks of mountains, each feature tells a story of the forces that shaped it and the dynamic interplay between geologic processes.

Geologic Bedrock Map Iowa
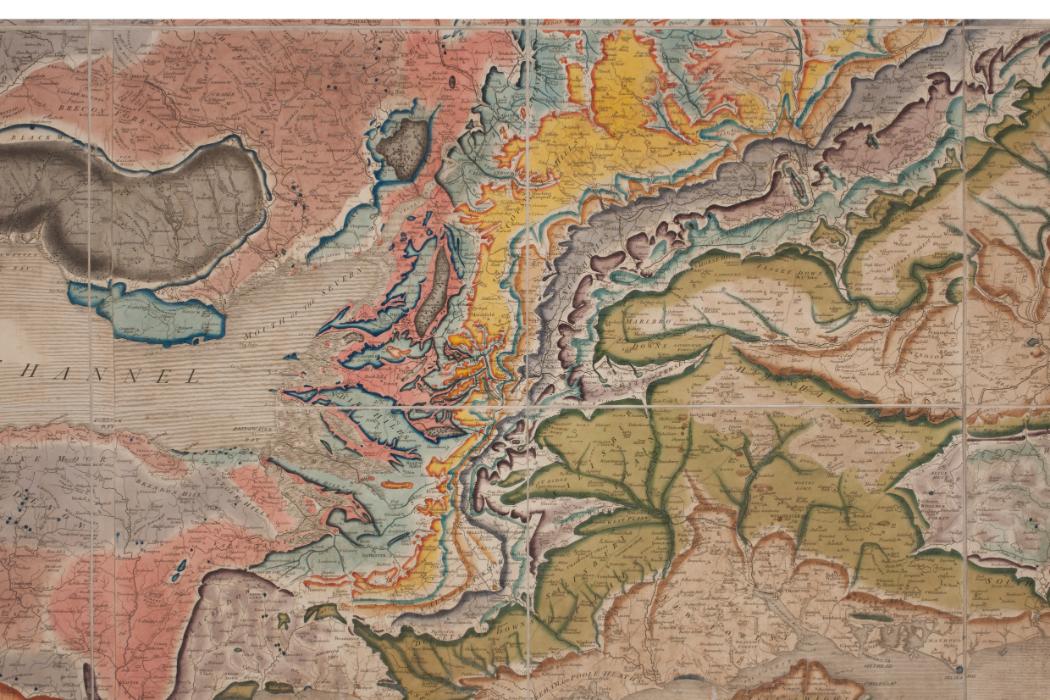
Geologic maps have a rich history that spans centuries.  Early maps were often rudimentary, based on surface observations and limited data.  But as our understanding of geology grew, so did the sophistication of these maps.  Today, we have access to cutting-edge technologies like remote sensing, GIS, and digital modeling, which enable us to create highly detailed and accurate maps that capture the complexity of the Earth’s surface in unprecedented detail.

Despite these advances, geologic mapping remains a challenging and dynamic field.  Every region presents its own unique set of geological features and processes, requiring careful observation and analysis to accurately capture its geologic history.  And as our planet continues to evolve, so too must our maps, as we strive to keep pace with the ever-changing face of the Earth.

Geologic Map Missouri

Geologic maps are powerful tools that have a wide range of uses in various fields.  From mining and construction to environmental management and natural disaster planning, these maps provide invaluable information about the Earth’s surface and its underlying geology. 

  • Mining and Exploration:  One of the most obvious uses of geologic maps is in mining and exploration.  These maps provide critical information about the location, distribution, and characteristics of mineral resources, such as coal, oil, gas, and metals.  By analyzing the geological features of an area, miners and geologists can determine where to drill and dig, reducing the cost and time required for exploration.  Geologic maps also help to identify the presence of hazardous minerals or materials, such as asbestos or radioactive elements, which can pose a serious risk to human health and the environment.  This information is crucial for ensuring safe and responsible mining practices, minimizing the negative impact on the surrounding ecosystems.
  • Construction and Engineering:  Another important use of geologic maps is in construction and engineering.  By analyzing the geological features of an area, engineers can determine the stability of the ground and assess the risk of natural hazards, such as landslides, earthquakes, and floods.  This information is essential for designing and building infrastructure that can withstand the forces of nature, reducing the risk of damage and loss of life.  Geologic maps are also used to identify potential sources of construction materials, such as sand, gravel, and clay.  This information is crucial for planning and executing large-scale construction projects, reducing the cost and environmental impact of transporting materials from distant locations.

Geologic Map Utah

  • Environmental Management:  Geologic maps are also used to manage and protect the environment.  By analyzing the geological features of an area, environmental scientists can determine the location and distribution of important natural resources, such as groundwater, that support local ecosystems and human communities.  This information is crucial for developing sustainable management strategies that balance economic development with environmental conservation.   Geologic maps also help to identify potential sources of pollution or contamination, such as abandoned mines or industrial sites.  By mapping these areas and assessing the risk of contamination, environmental scientists can develop remediation plans that minimize the impact on the surrounding ecosystems and human health.
  • Natural Disaster Planning:  Finally, geologic maps are essential for planning and preparing for natural disasters.  By analyzing the geological features of an area, geologists can identify areas that are prone to these types of hazards and assess the risk of damage or loss of life.  This information is critical for developing emergency response plans and mitigation strategies that can reduce the impact of natural disasters.  For example, geologic maps can help to identify safe evacuation routes and areas for temporary shelter, reducing the risk of injury or death.

Geologic Map Ohio

Geologic maps are visual representations of the geology of an area, showing the distribution of rock units, faults, folds, and other geological features.  There are several types of geologic maps, each with its own unique purpose and application.
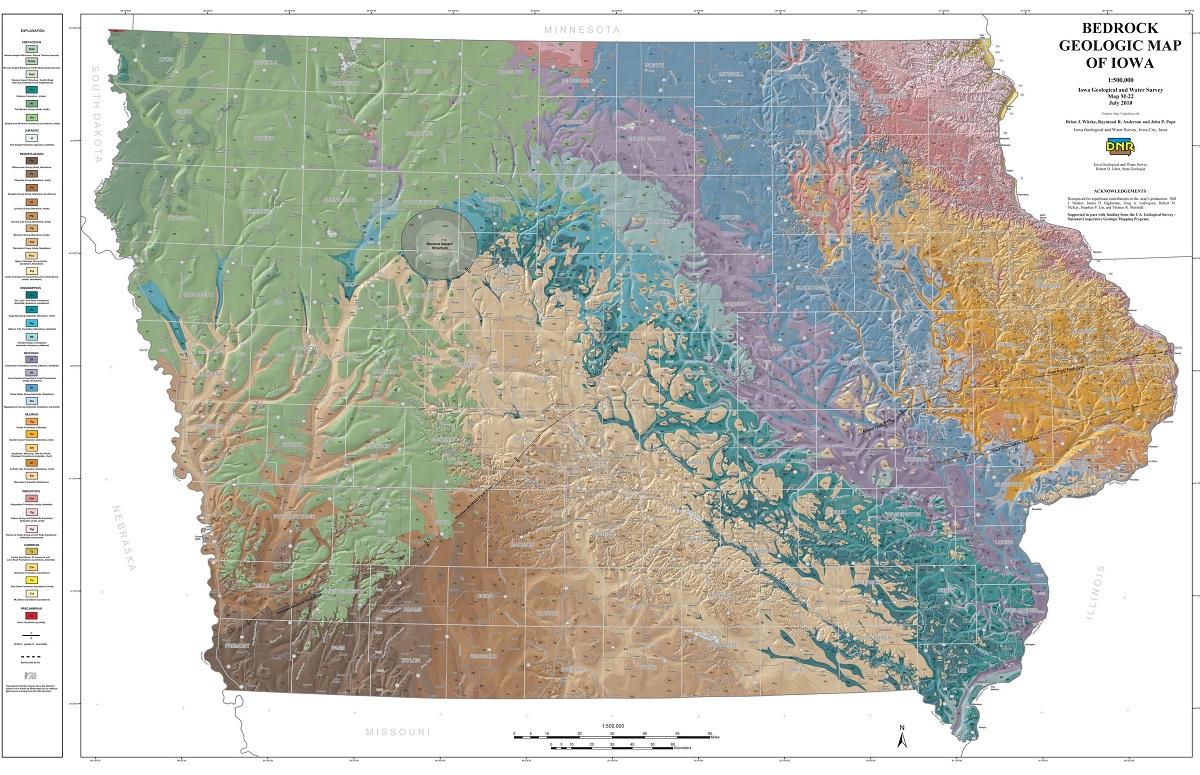
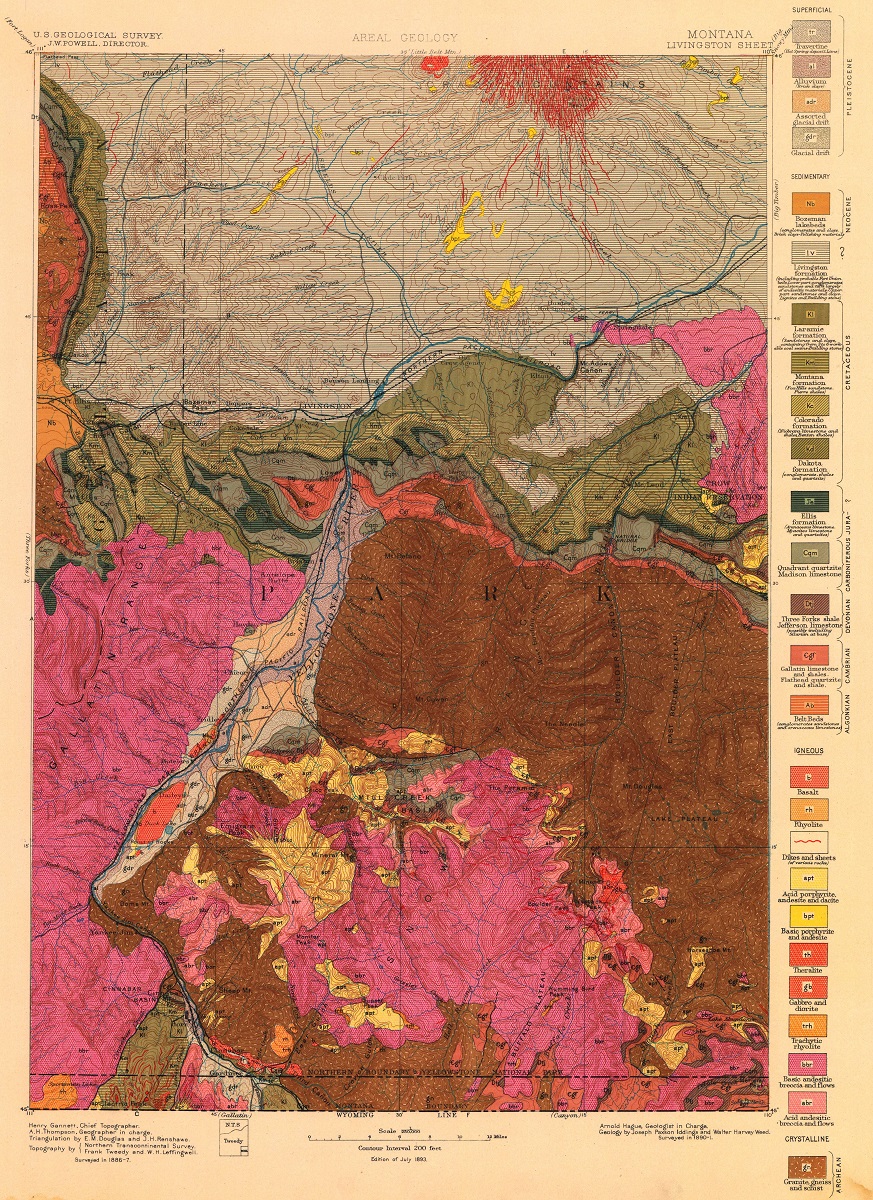
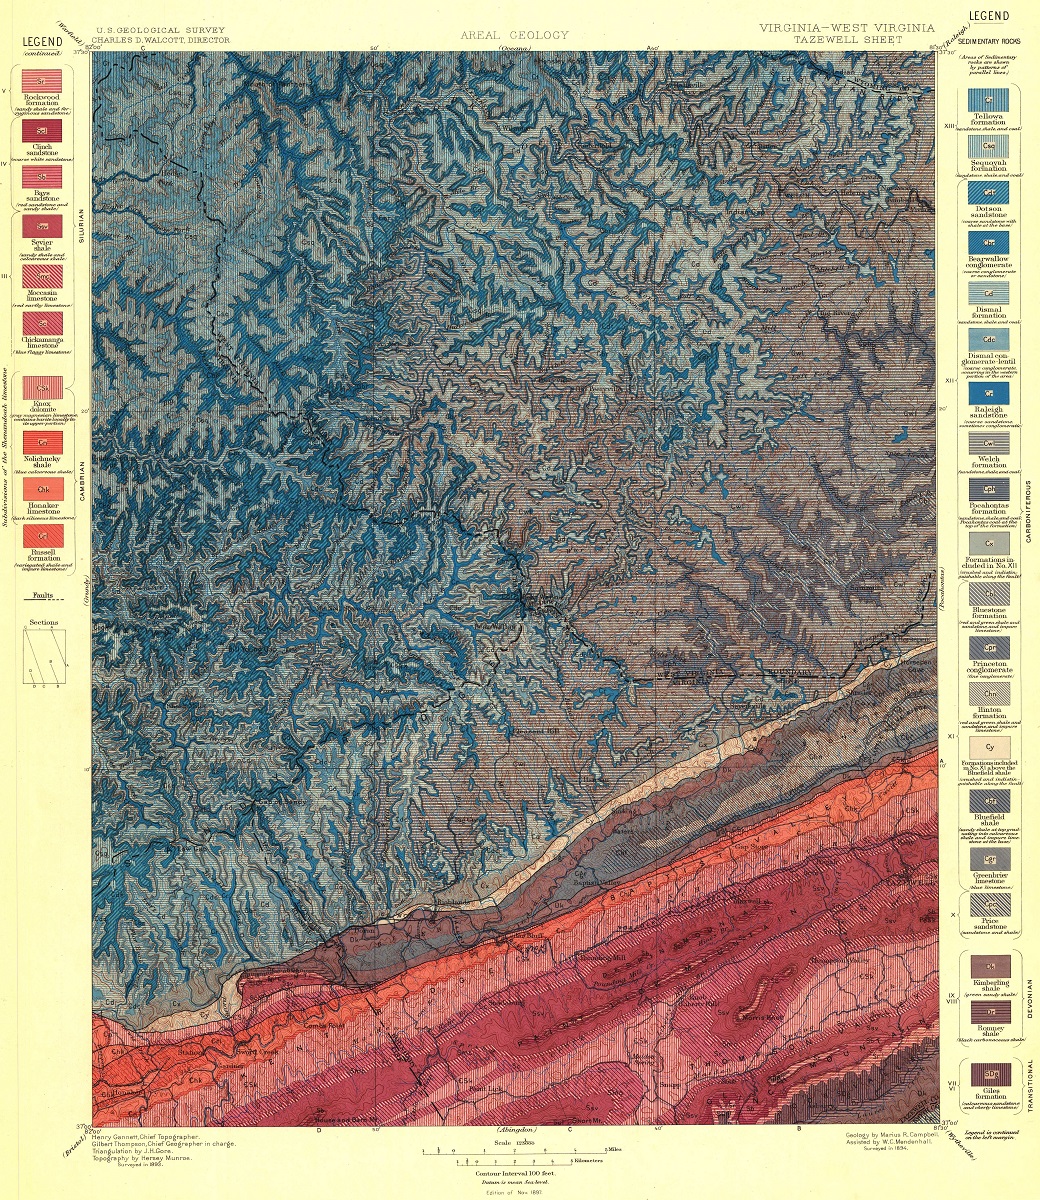
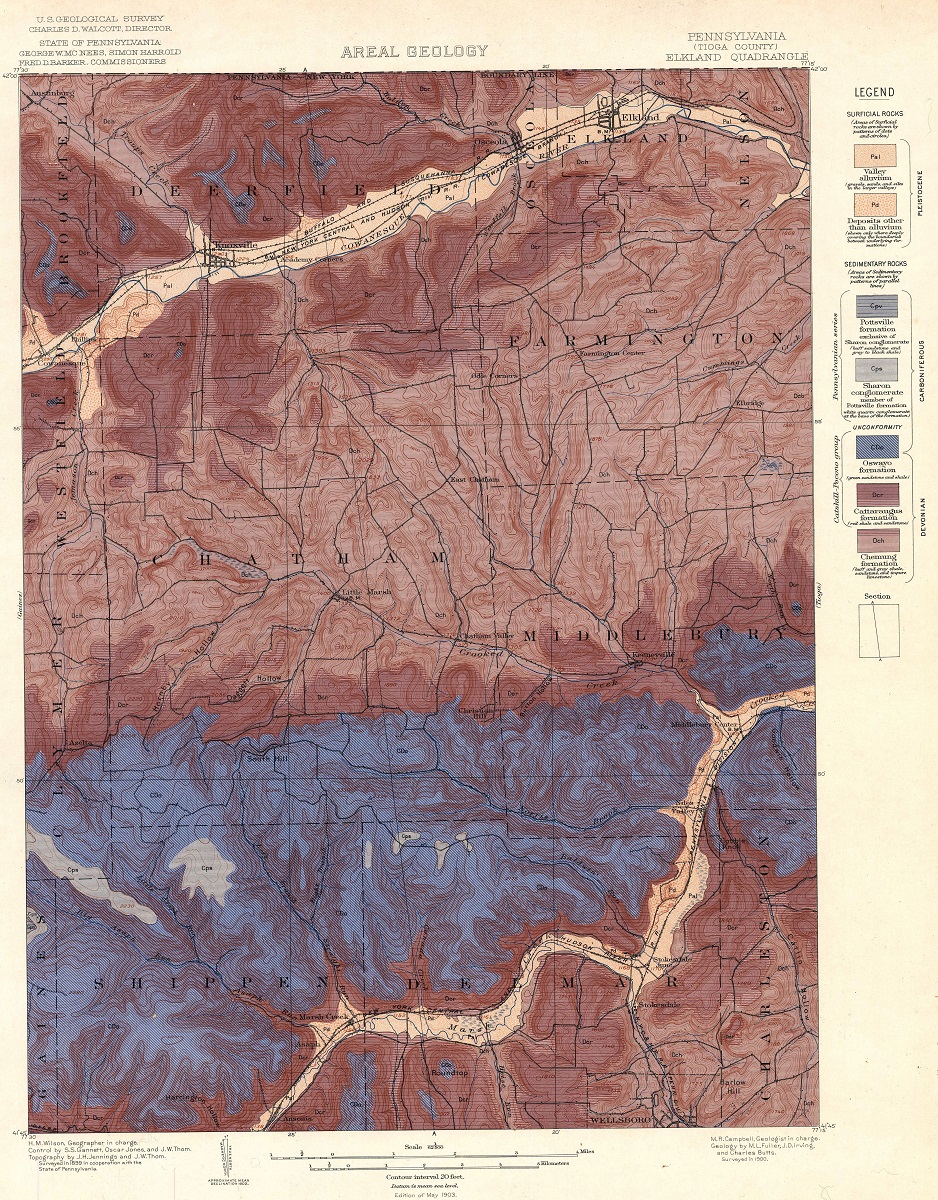
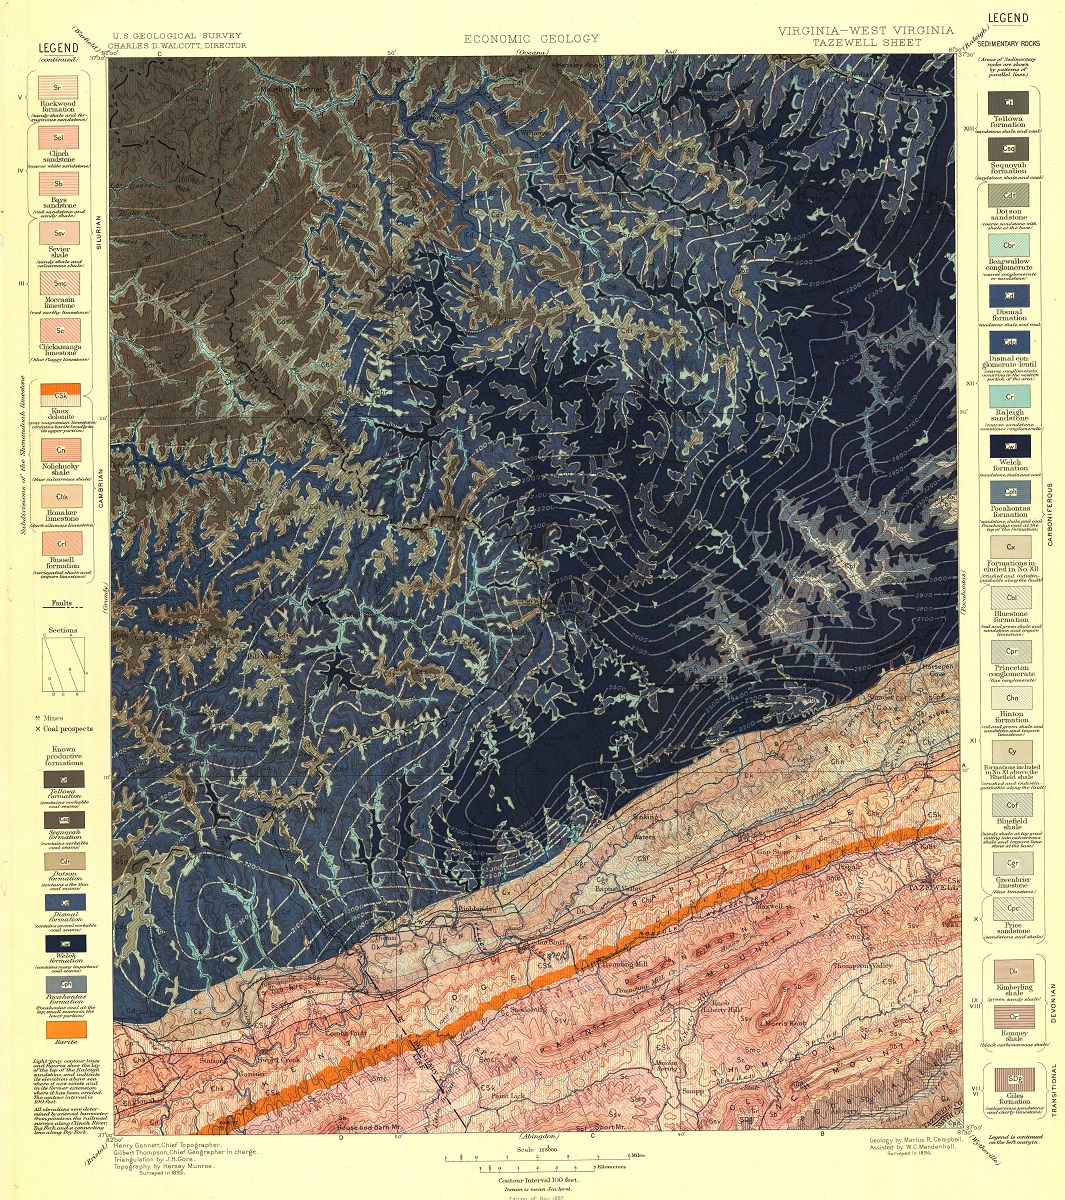
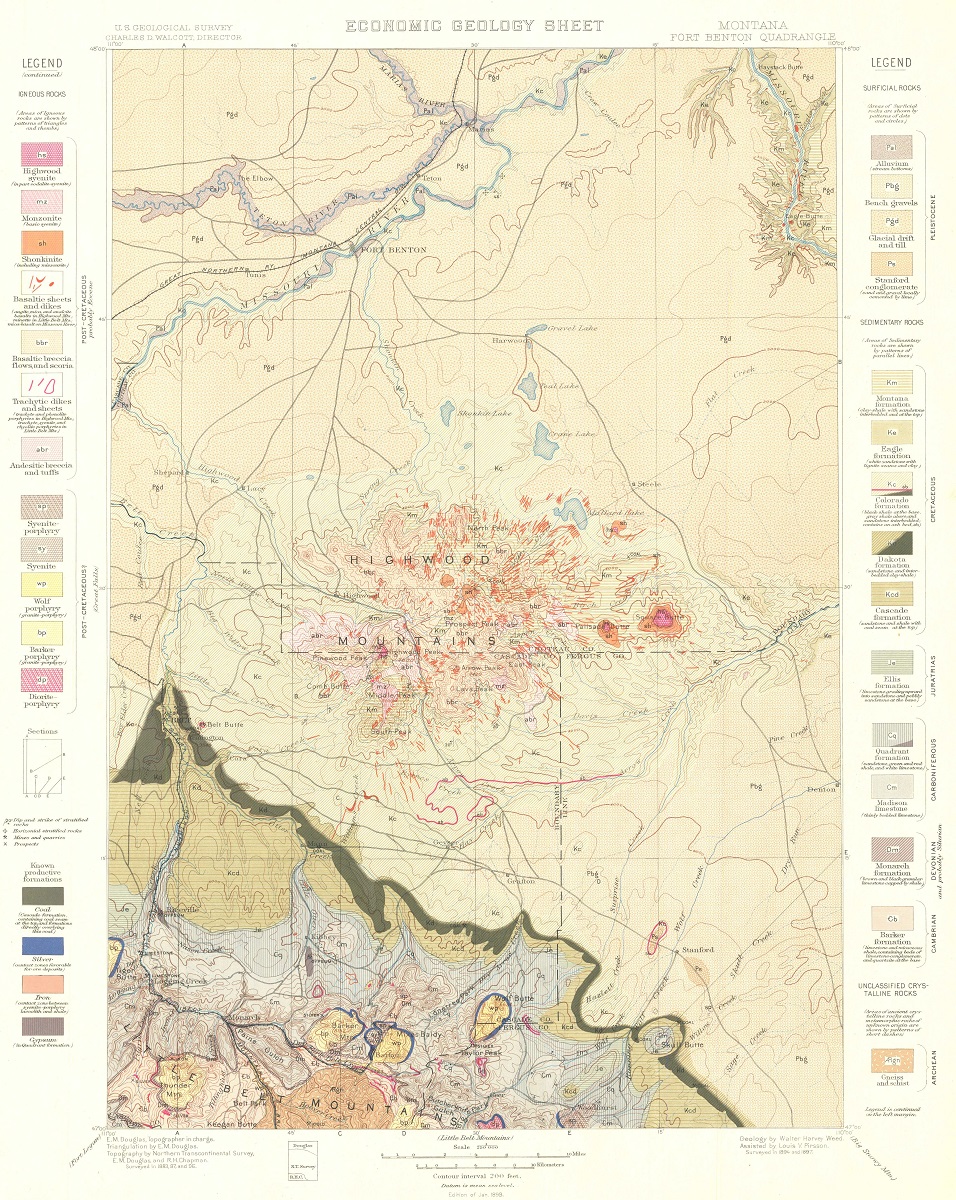
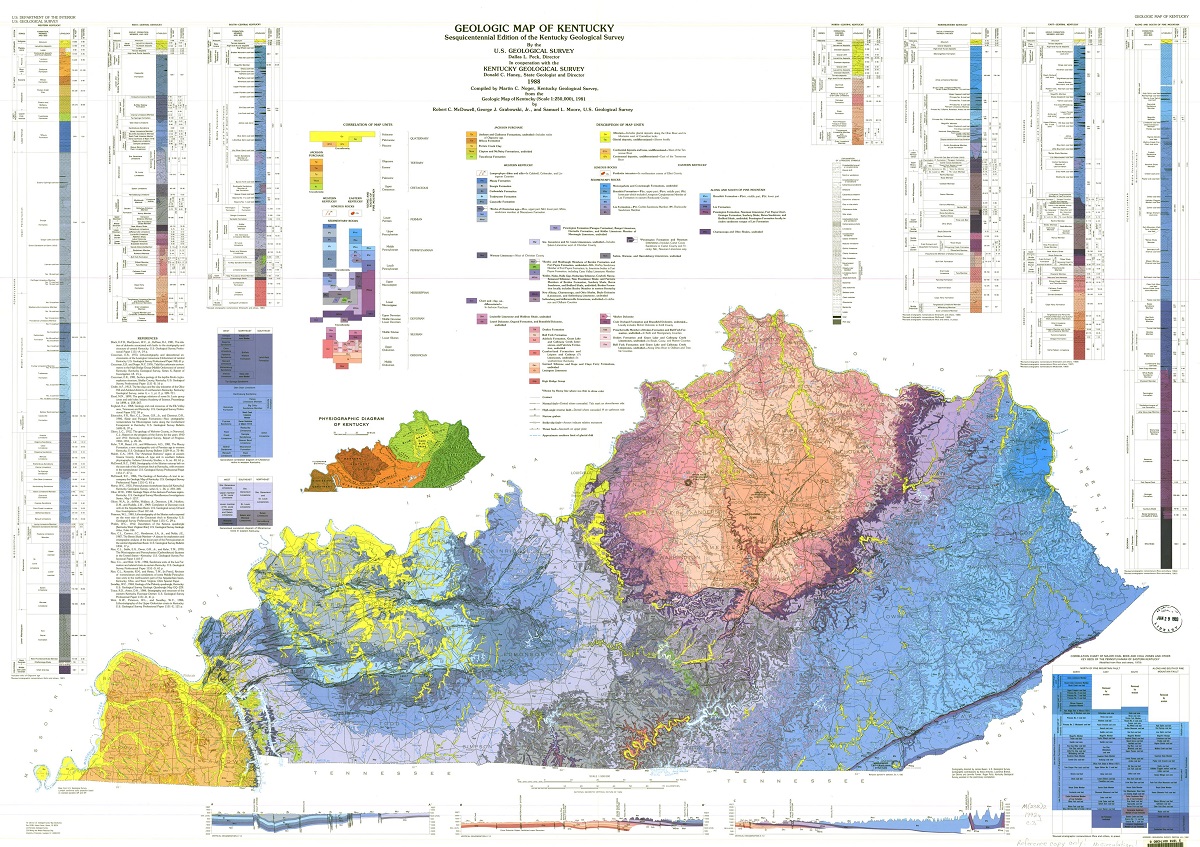
  • Bedrock Maps:  Bedrock maps are the most common type of geologic maps and show the distribution of the underlying rock units in an area.  These maps are essential for identifying mineral resources, assessing the stability of the ground for construction, and understanding the geological history of the region.  Bedrock maps typically use different colors to represent different rock units, with labels indicating the age and type of rock.  They may also include symbols or patterns to indicate geological features such as faults or folds.
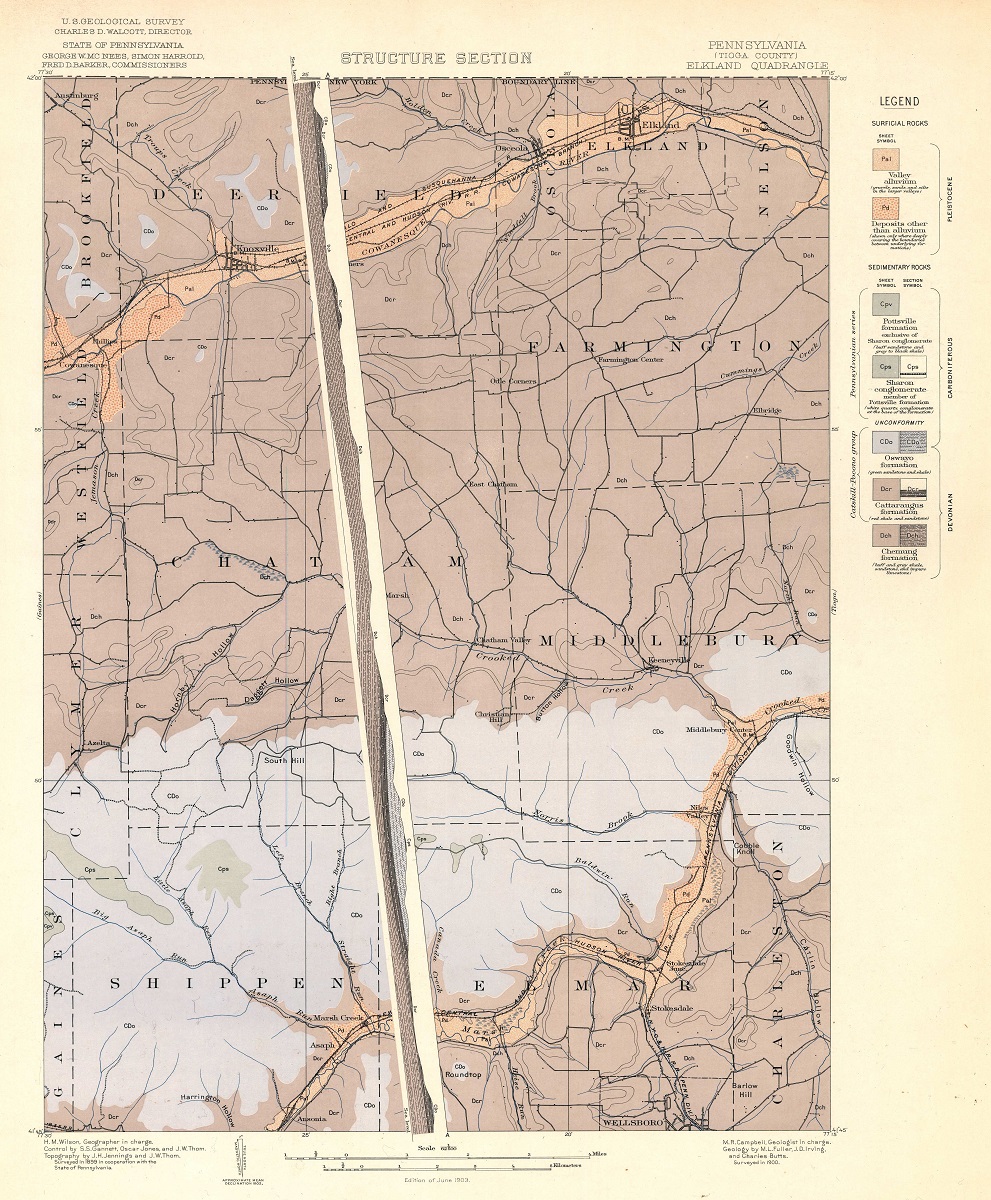
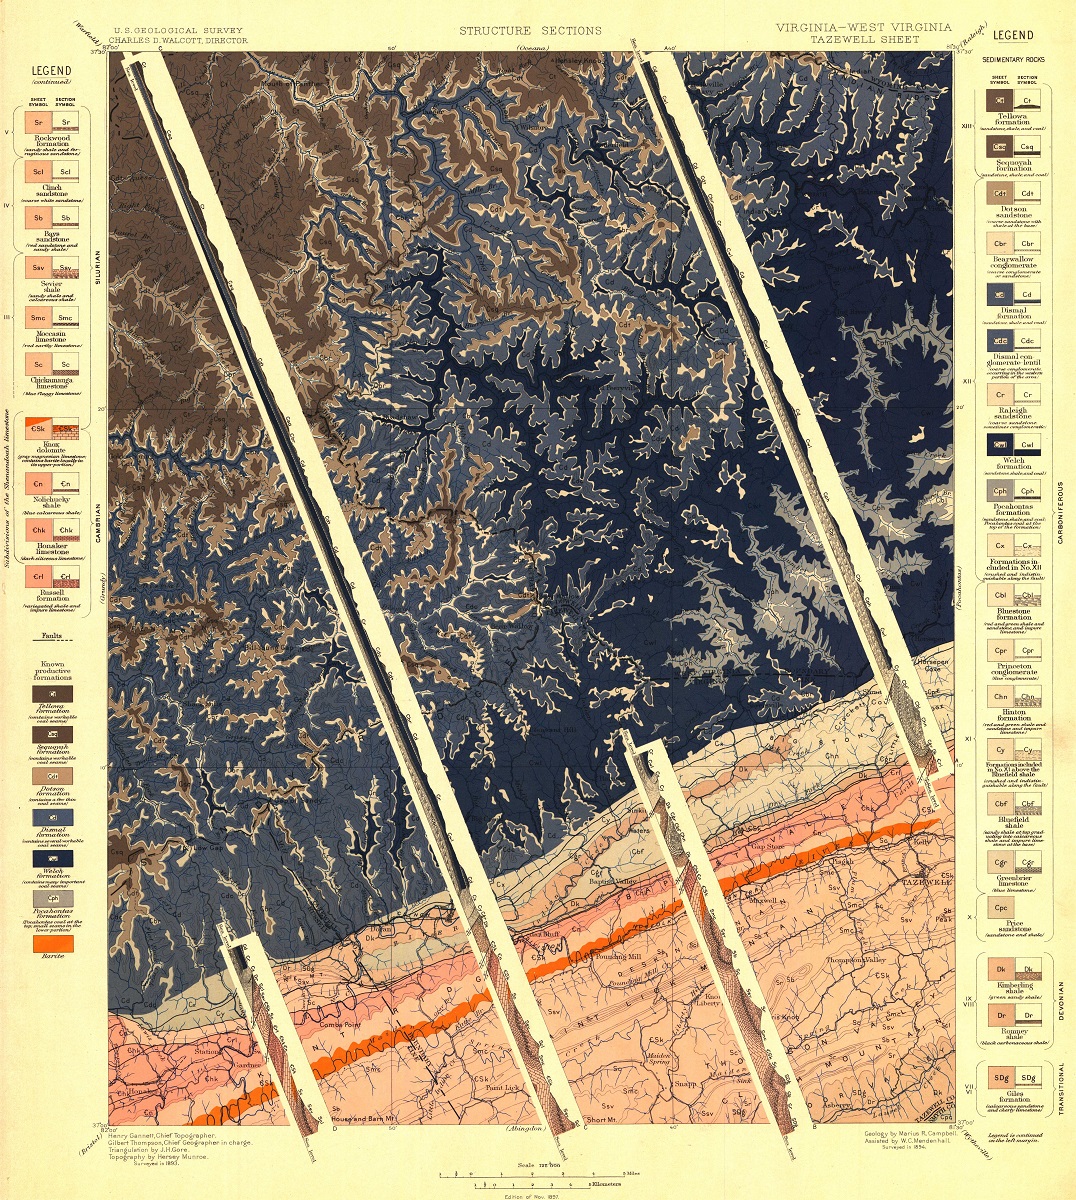
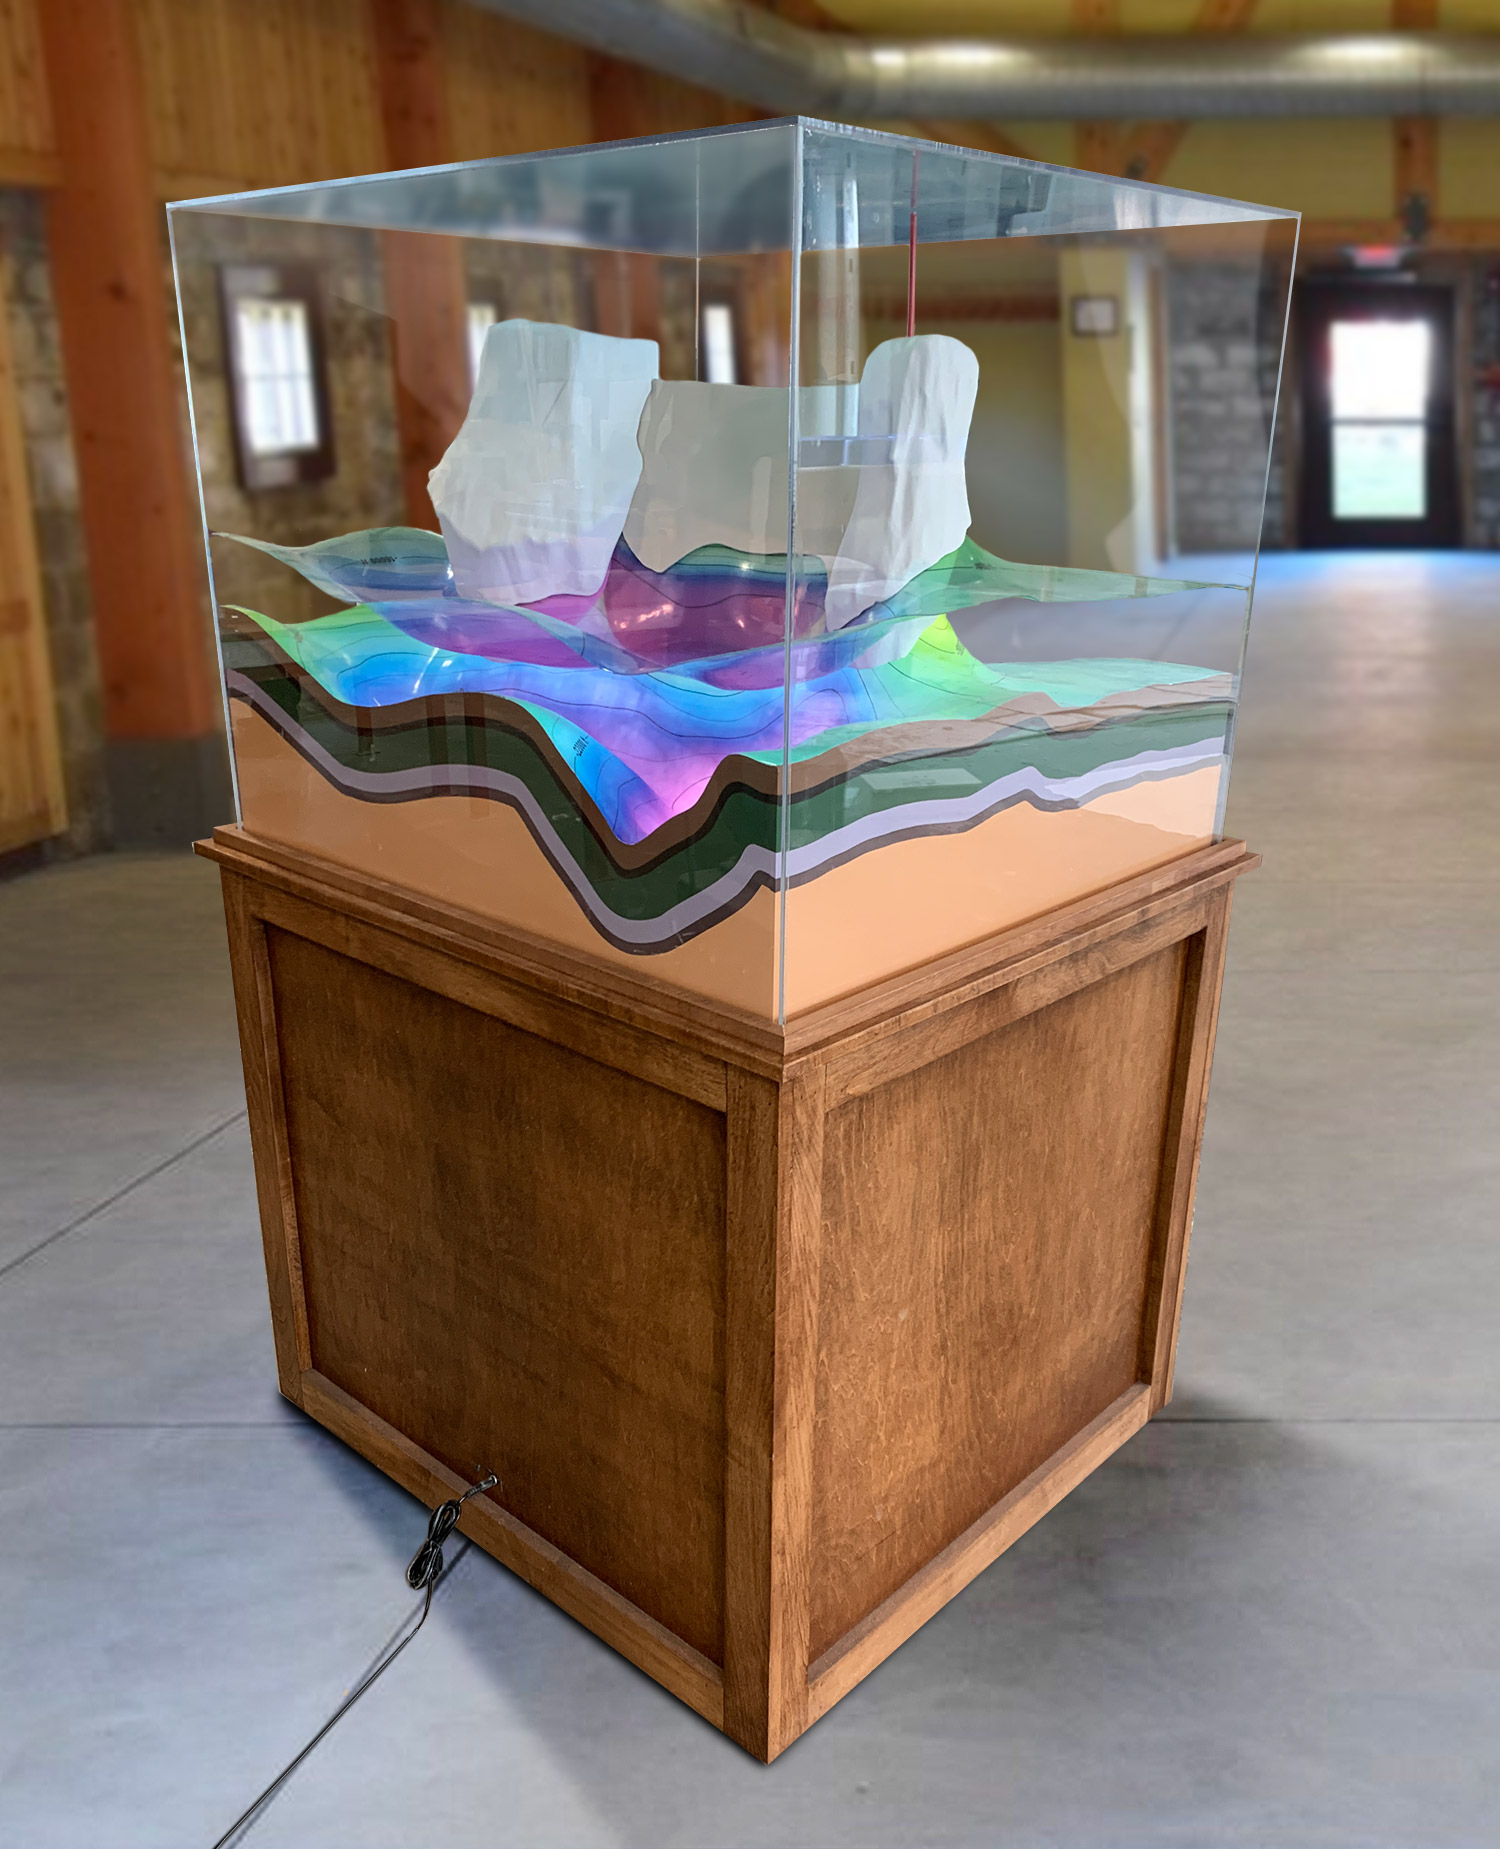
  • Structural Maps:  Structural maps show the orientation and distribution of geological structures such as faults, folds, and joints.  These maps are essential for understanding the tectonic history of an area and identifying potential sources of natural hazards, such as earthquakes or landslides.  Structural maps typically use symbols to represent different types of structures, with arrows indicating the orientation of the structures relative to north.  These maps may also include cross-sections or 3D views to provide a more detailed understanding of the geological structures in the area.
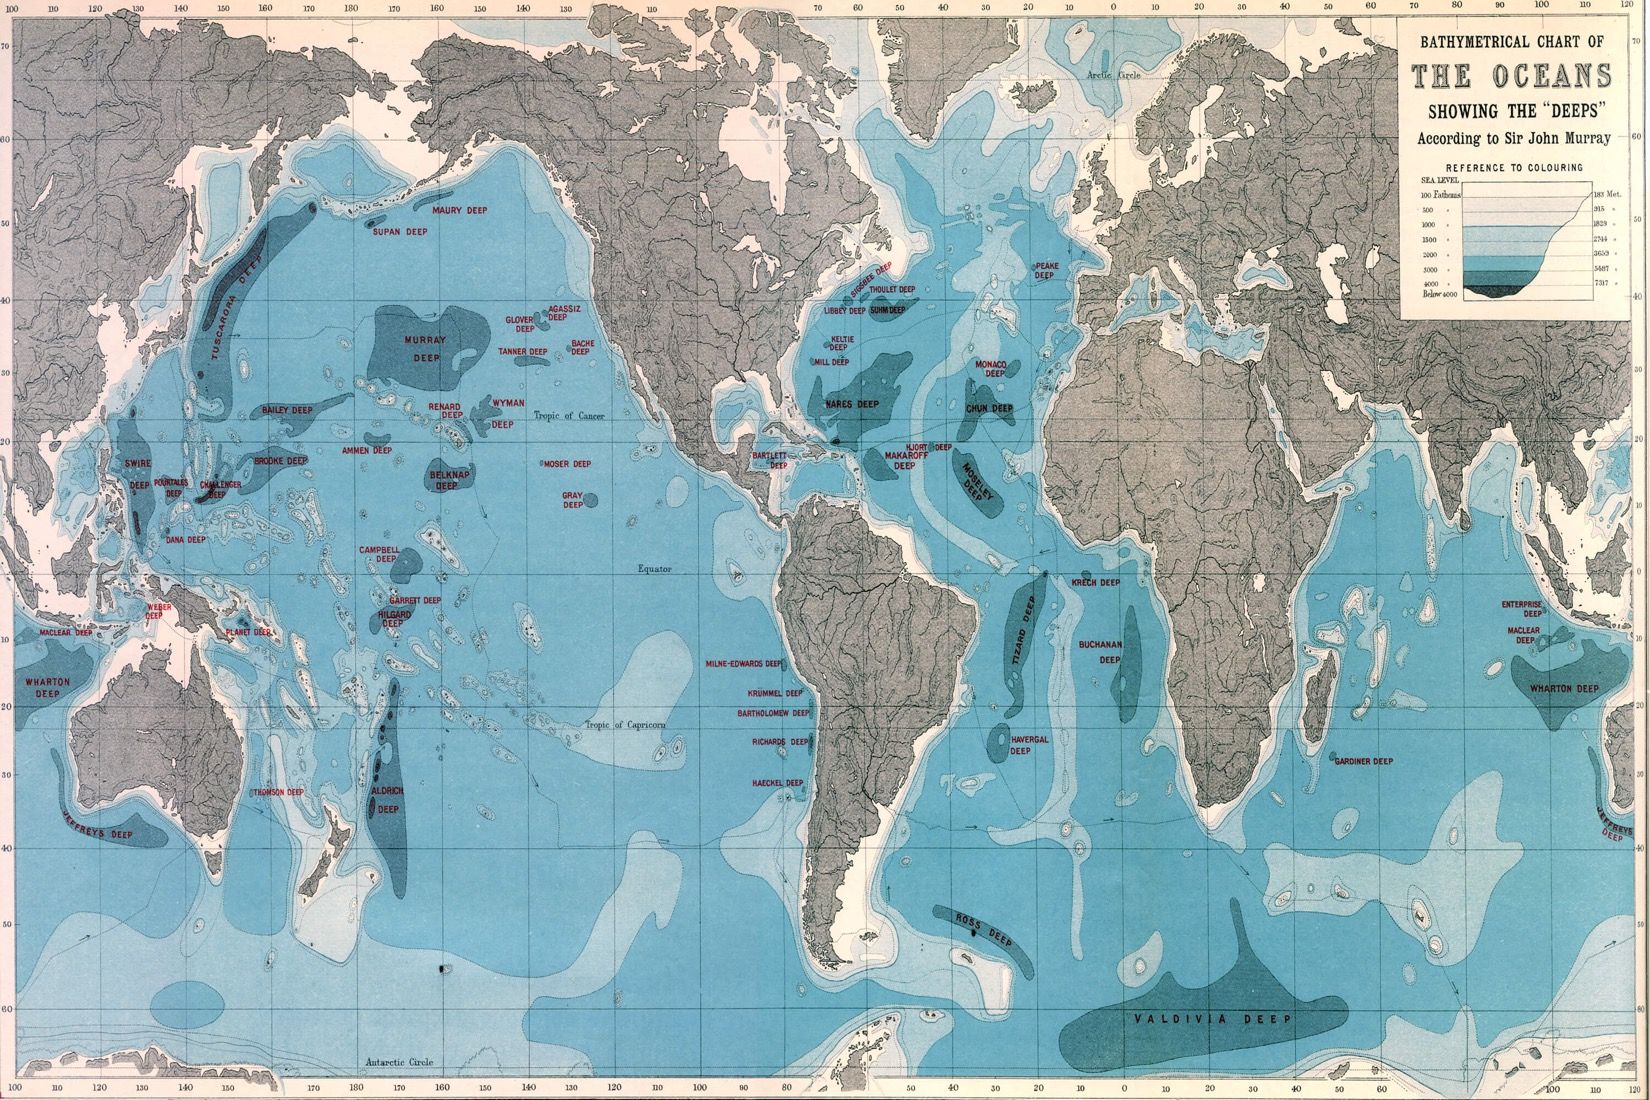
  • Geophysical Maps:  Geophysical maps show the distribution of physical properties of the Earth’s subsurface, such as magnetism, gravity, or electrical conductivity.  These maps are used to identify the presence of mineral resources, oil and gas deposits, and groundwater reservoirs.  Geophysical maps typically use contour lines to represent variations in the physical properties of the subsurface, with different colors indicating the intensity of the variation.  These maps may also include annotations or cross-sections to provide a more detailed understanding of the subsurface structure.
  • Geomorphological Maps:  Geomorphological maps show the distribution of landforms and their related geological processes, such as erosion, deposition, or tectonic activity.  These maps are essential for understanding the evolution of the landscape and identifying potential sources of natural hazards, such as landslides or flooding.  Geomorphological maps typically use different colors or shading to represent different landforms, with labels indicating the age and type of landform. These maps may also include symbols or patterns to represent geological processes such as erosion or deposition.

Geologic Map USA Geologic maps are a crucial tool for understanding the Earth’s geology and the various processes that shape our planet.  These maps are designed to represent the geology of an area by showing the distribution, age, and type of rocks and other geological features.   Here are some of the key features of geologic maps and how they are used by geologists and other scientists.

  • Rock Units:  One of the most important features of geologic maps is the representation of rock units.  Rock units are areas of the Earth’s crust that share similar properties such as age, composition, and texture.   Geologic maps typically use a variety of colors and patterns to represent different rock units, making it easy for geologists to visualize the distribution and extent of each unit.
  • Age:  Another critical feature of geologic maps is the representation of the age of rock units. Geologists use various techniques to determine the age of rocks, including radiometric dating and stratigraphy.  By mapping the age of rock units, geologists can gain a better understanding of the geological history of an area.
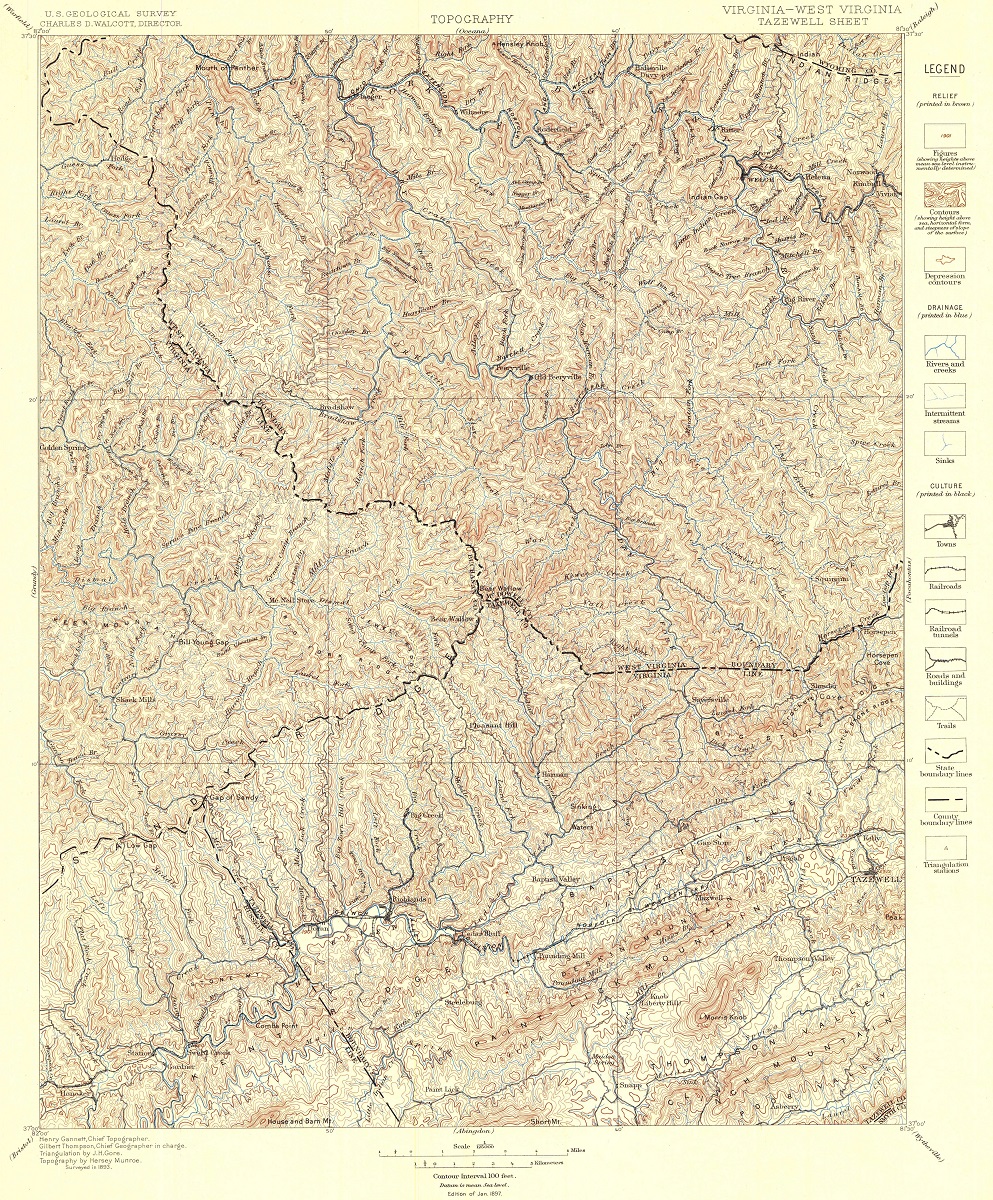
  • Structures:  Geologic maps also depict various geological structures such as faults, folds, and joints. These structures are important because they can provide information on the tectonic processes that shaped the Earth’s crust.  Faults, for example, are zones of weakness in the Earth’s crust where rocks have broken and moved relative to each other.  By mapping the distribution of faults, geologists can identify areas at risk of earthquakes and other natural hazards.
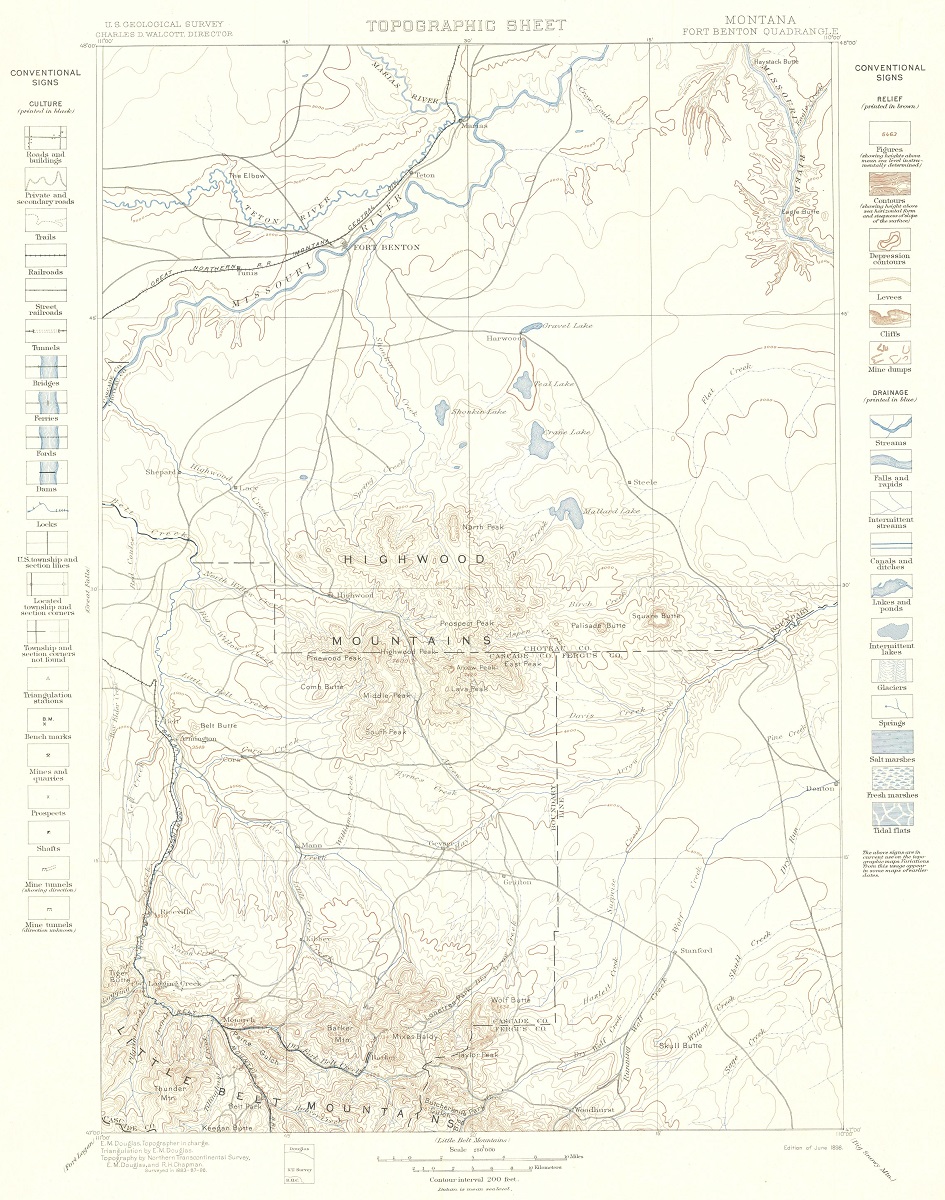
  • Symbols and Legends:  Geologic maps also use symbols and legends to represent various geological features such as rock types, faults, and folds.  These symbols and legends provide a key to understanding the map and make it easy for geologists to identify different features.  For example, a wavy line on a geologic map may represent a fault, while a circle may represent a volcano.
  • Scale:  Geologic maps also include a scale to indicate the size of the area represented on the map.  This is important because it allows geologists to accurately measure distances and areas between different geological features.
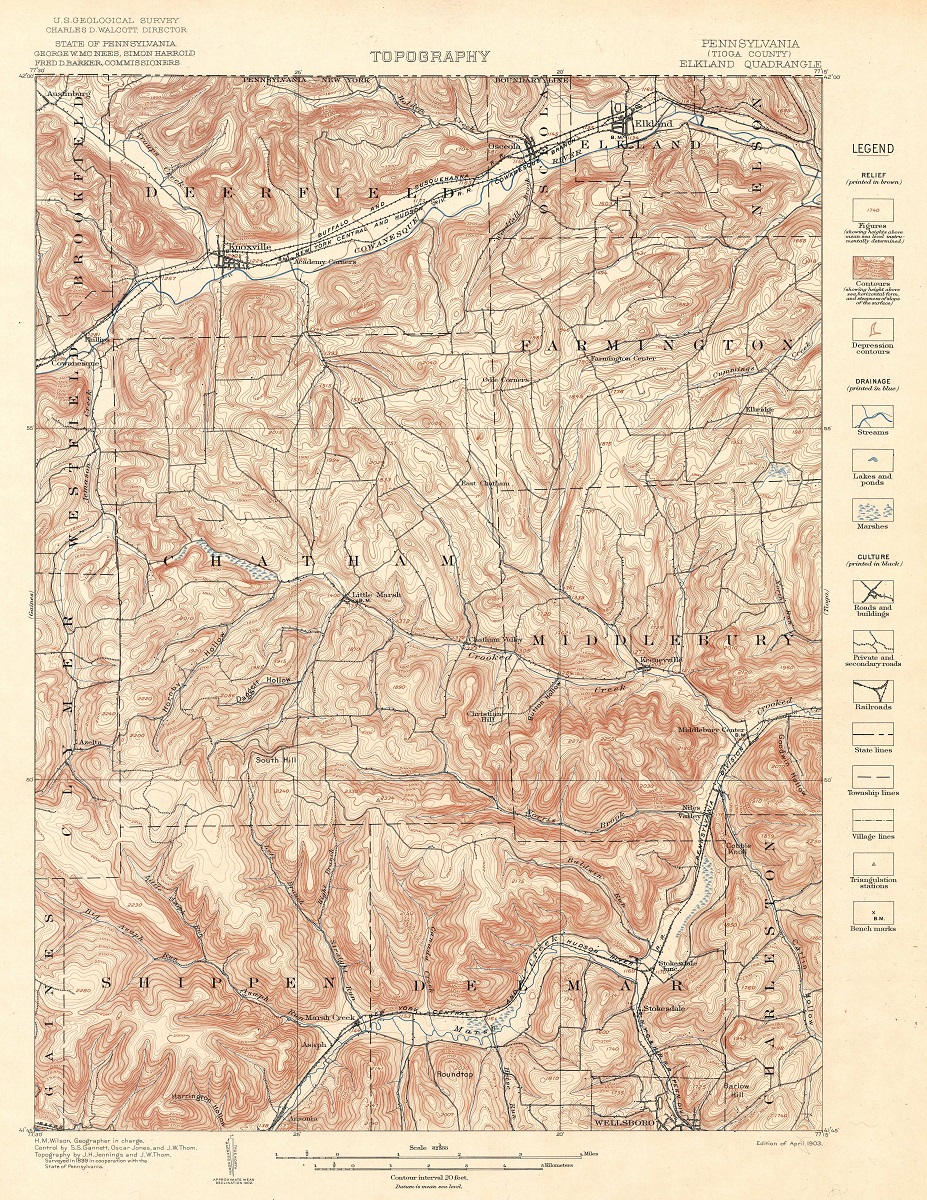
  • Topography:  Finally, geologic maps also include topographic information such as elevation and contour lines.  This information is important because it can help geologists understand the relationship between geology and topography.  For example, sedimentary rocks are often found in low-lying areas such as river valleys, while igneous and metamorphic rocks are often found in mountainous areas.

Gallery of Geologic Maps

There are many sources available for geologic maps.  WhiteClouds can help you with this process.  Example geologic maps are shown below.  

2D Geologic Maps - Sample State Section Maps

2D Geologic Maps - Sample State Maps

2D Geologic Maps - Sample Historical Structure Maps

2D Geologic Maps - Sample Historical Areal Maps

2D Geologic Maps - Sample Historical Topographic Maps

2D Geologic Maps - Sample Historical Economic Maps

There are many benefits with Geologic Maps:

  • Mineral Resource Exploration:  Geologic maps are critical for identifying areas of mineral potential.  By analyzing the distribution and age of rock units, geologists can identify areas where minerals are likely to be found.  For example, gold deposits often occur in areas where there are volcanic rocks or in association with certain types of faults.  Copper deposits, on the other hand, are commonly found in sedimentary rocks.  Geologic maps also help in identifying potential locations for oil and gas deposits.  By analyzing the subsurface structure and the distribution of rock units, geologists can predict where oil and gas may be found.  This information is essential for exploration and production companies to plan their drilling programs and maximize their chances of success.
  • Natural Hazard Assessment:  Geologic maps are also critical for assessing natural hazards such as earthquakes, landslides, and floods.  By analyzing the distribution of faults, folds, and other geological structures, geologists can identify areas at risk of earthquakes.  Similarly, by analyzing the slope and stability of the ground, they can identify areas at risk of landslides.  In coastal areas, geologic maps are used to identify areas at risk of flooding due to sea-level rise or storm surges. By analyzing the elevation of the land and the type of sediment, geologists can predict which areas are likely to be inundated during a storm or a high tide event.

Geologic Map Kentucky 

  • Construction and Development:  Geologic maps are critical for planning and constructing infrastructure such as roads, bridges, and buildings.  By analyzing the subsurface structure and the stability of the ground, geologists can identify areas suitable for construction and those that may require additional reinforcement.  For example, if a construction project is planned in an area with soft sedimentary rocks, geologists can advise on the appropriate foundation design to prevent settlement or subsidence.  Similarly, if an area is prone to earthquakes, geologists can recommend appropriate building codes and construction techniques to ensure the safety of the occupants.
  • Environmental Management:  Geologic maps are also critical for environmental management, such as identifying areas at risk of contamination or degradation.  By analyzing the distribution of rock units and the subsurface structure, geologists can identify areas where groundwater resources may be at risk of contamination from pollutants or waste products.  Similarly, geologic maps are used to identify areas where soils may be prone to erosion or where vegetation may be at risk of degradation.  This information is essential for planning land use and conservation strategies to protect the environment and ensure sustainable development.

Geologic maps are a vital tool for understanding the Earth’s geology and the various processes that shape our planet.  From identifying mineral resources to assessing natural hazards and planning construction projects, geologic maps provide a wealth of information that is essential for a range of applications.  By utilizing these maps, we can continue to unlock the secrets of our planet’s geology and ensure that we make informed decisions that promote sustainable development and protect our environment.

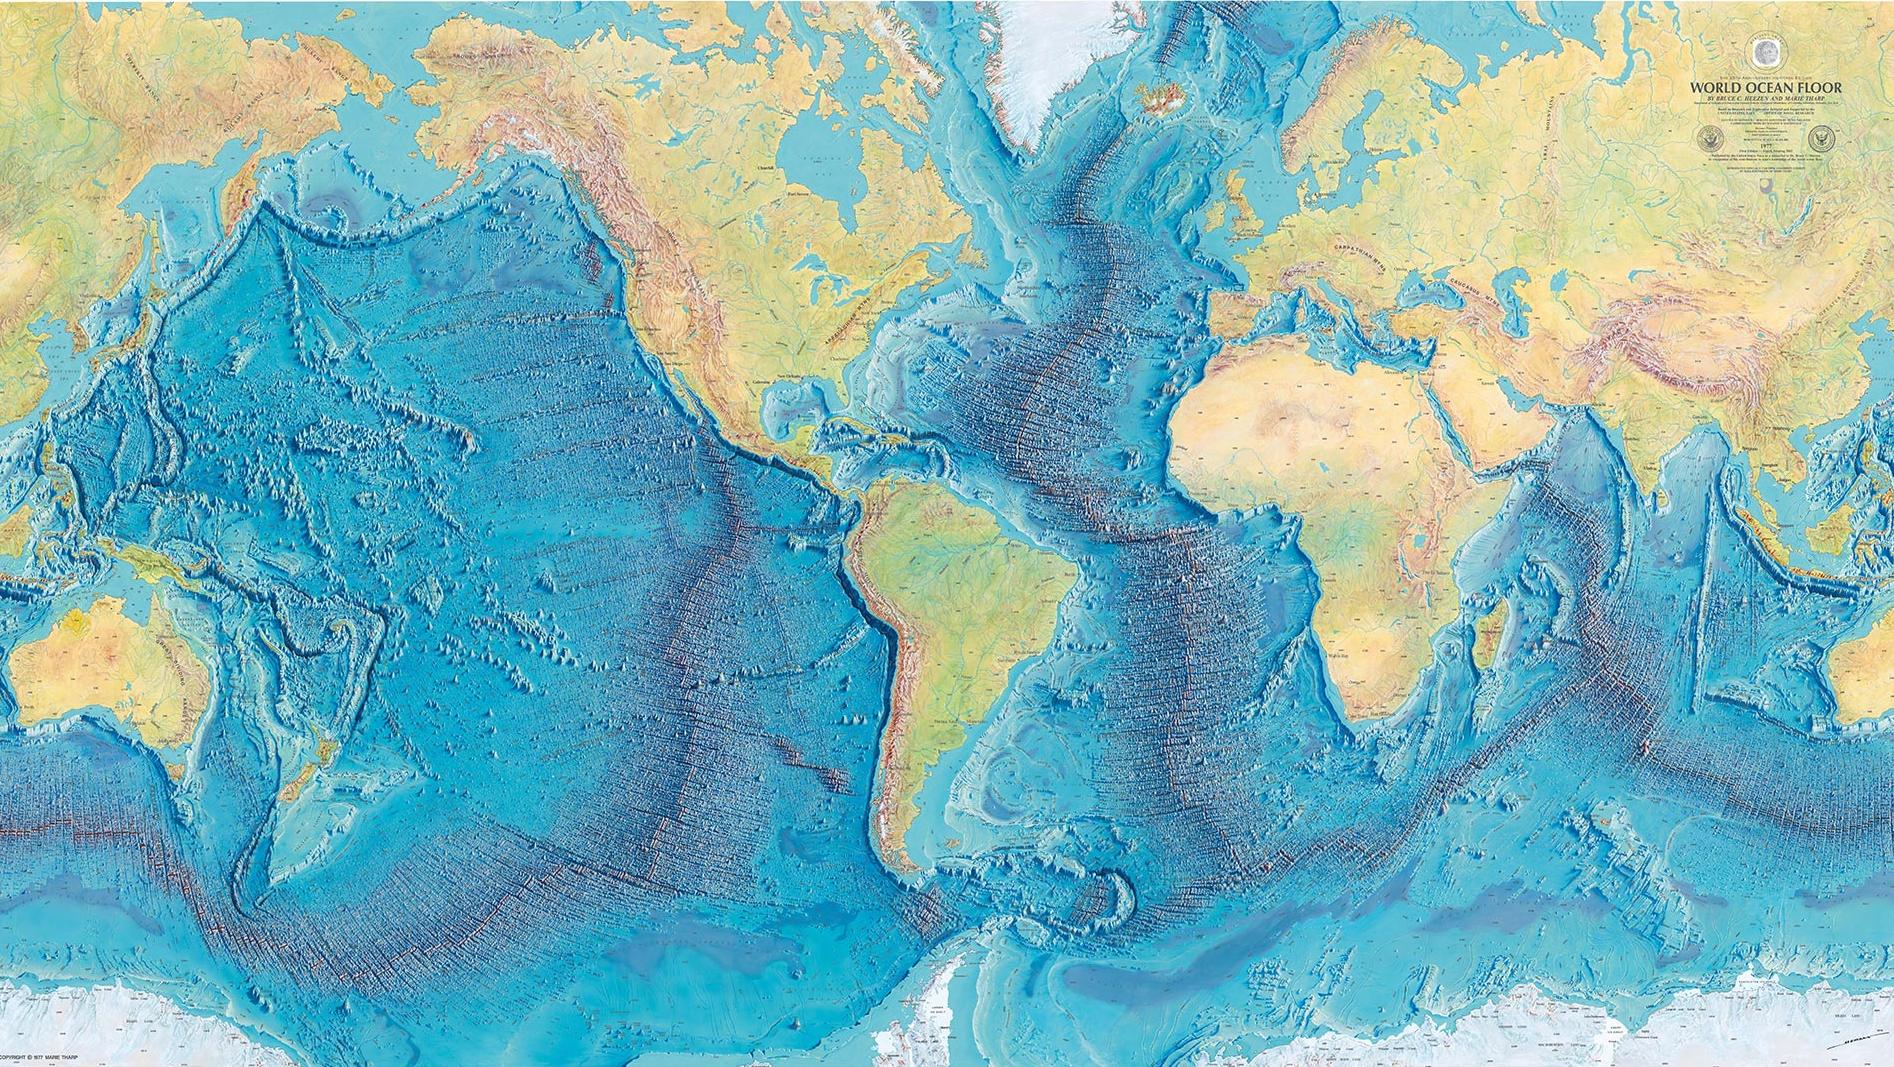
We meld top-of-the-line technologies with professional cartography resources to create stunning bathymetric maps and models.  Our expertise in 3D printing enables us to allow more markets to benefit from purchasing durable, portable, and affordable models. 


Gallery of Custom 3D Map Projects

Where can I Find Geologic Maps

Here are links for the state geologic websites:
Geologic Map of USA:  USGS Geologic Maps USA
Geologic Map of Alabama:  Geological Survey of Alabama
Geologic Map of Alaska:  Department of Natural Resources-Geological and Geophysical Surveys
Geologic Map of Arizona:  Arizona State University
Geologic Map of Arkansas:  Arkansas Geological Survey
Geologic Map of California:  California Department of Conservation
Geologic Map of Colorado:  Colorado Geological Survey
Geologic Map of Connecticut:  Connecticut Geological Survey
Geologic Map of Delaware:  Delaware Geological Survey
Geologic Map of Florida:  Florida Geological Survey
Geologic Map of Georgia:  Georgia Geologic Survey
Geologic Map of Hawaii:  Hawaii Office of Planning 
Geologic Map of Idaho:  Idaho Geological Survey
Geologic Map of Illinois:  Illinois State Geological Survey
Geologic Map of Indiana:  Indiana Geological & Water Survey
Geologic Map of Iowa:  Iowa Geological Survey
Geologic Map of Kansas:  Kansas Geological Survey
Geologic Map of Kentucky:  Kentucky Geological Survey
Geologic Map of Louisiana:  Louisiana Geological Survey
Geologic Map of Maine:  Maine Geological Survey
Geologic Map of Maryland:  Maryland Geological Survey
Geologic Map of Massachusetts:  Massachusetts Geological Survey
Geologic Map of Michigan:  Michigan Geological Survey
Geologic Map of Minnesota:  Minnesota Geological Survey
Geologic Map of Mississippi:  Mississippi Geological Survey
Geologic Map of Missouri:  Missouri Geological Survey
Geologic Map of Montana:  Montana Bureau of Mines & Geology
Geologic Map of Nebraska:  Nebraska Geological Survey
Geologic Map of Nevada:  Nevada Bureau of Mines & Geology
Geologic Map of New Hampshire:  New Hampshire Geological Survey
Geologic Map of New Jersey:  New Jersey Geological Survey
Geologic Map of New Mexico:  New Mexico Bureau of Geology & Mineral Resources
Geologic Map of New York:  New York State Museum
Geologic Map of North Carolina:  North Carolina Geological Survey
Geologic Map of North Dakota:  North Dakota Geological Survey 
Geologic Map of Ohio:  Ohio Department of Natural Resources
Geologic Map of Oklahoma:  Oklahoma Geological Survey
Geologic Map of Oregon:  Oregon Department of Geology & Mineral Industries
Geologic Map of Pennsylvania:  Pennsylvania Geological Survey 
Geologic Map of Rhode Island:  Rhode Island Geological Survey 
Geologic Map of South Carolina:  South Carolina Geological Survey 
Geologic Map of South Dakota:  South Dakota Geological Survey 
Geologic Map of Tennessee:  Tennessee Geological Survey 
Geologic Map of Texas:  Texas Water Development Board
Geologic Map of Utah:  Utah Geological Survey 
Geologic Map of Vermont:  Vermont Geological Survey 
Geologic Map of Virginia:  Virginia Division of Geology & Mineral Resources
Geologic Map of Washington:  Washington Division of Geology & Earth Resources 
Geologic Map of West Virginia:  West Virginia Geological & Economic Survey 
Geologic Map of Wisconsin:  Wisconsin Geological & Natural History Survey 
Geologic Map of Wyoming:  Wyoming State Geological Survey
Geochemical Map of USA:  USGS National GeoChemical Database
Geophysical Survey Maps of USA:  USGS Geophysical Surveys
Geologic Map Data of USA:  USGS Geologic Map Data
Geologic Mineral Resource Maps of USA:  USGS Mineral Resource Occurrences
Geologic National Map Database:  USGS National Geologic Database

How 3D Geologic Maps are Made

There are several techniques used to create 3D geologic maps, and the process can vary depending on the scale and complexity of the map.  However, the basic steps involved in making a geologic map are as follows:

  1. Create a base map. The first step in making a geologic map is to create a base map of the area. This can be done using imagery from a standard two-dimensional map, aerial photographs, satellite images, or WhiteClouds can do it for you.
  2. Determine the design style of the map. There are over 40 styles to choose from.  Popular ones include satellite, terrain, topography, raised relief, and satellite hybrid.
  3. Add any special design features not included in the source map, such as special features, landmarks, legends, roads, cities, symbols, etc.
  4. Add elevation data. The next step is to add elevation data to the map. This can be done using a variety of techniques, such as contour lines, shading, or digital elevation models (DEMs).
  5. Print the Map Overlay.  Latex vinyl materials are used for the map details and colors.  
  6. Create the 3D physical map. Once the elevation data has been added to the map, a physical 3D structure is created that replicates the topography of the area. This can be done using 3D printed plastic or thermoformed molding/casting.  Either approach is combined with the Vinyl overlay.
  7. Finish the map.  This is where any excess materials are cutaway.  Any special sealers, matte finishes, hardeners, or UV protection is applied.  Wood, metal or plastic bases are built and border flocking may be applied.


Features & Benefits of Geologic Maps

  • Remarkably Strong:  You can drive a 1-ton truck over our geologic maps.
  • Precision:  We print our physical maps to scale as accurately as are the original files and images.
  • Excitement:  It is much easier to get excited about 3D views of your topography than flat printed maps.
  • Stain and Water Resistance:  Spills are easy to wipe up.
  • Communication:  Geologic maps are simple to understand with a quick glance.
  • Affordability:  Our 3D technologies allow you to order custom 3D maps for a reasonable price.
  • Testability:  3D technologies are affordable enough to test designs, such as several versions of planned work.
  • Consistency:  Using modern print and casting technologies, you can easily recreate identical 3D maps.
  • Portability:  We use lighter materials than what was available in the past, making our geologic maps easy to transport.

Videos of 3D Maps

Map Design Styles of Geologic Maps

Many design styles, or base maps, serve as a starting point for your geologic map. We source and create our base maps using the same digital tools that expert cartographers use to create maps. Once you have selected your base map, everything else is fully customizable. We can layer informational text (such as landmarks or other points of interest) and even change the colors to suit your preferences.

Complex layers can be added such as streams and lakes, terrain, roads, and even more detail like political boundaries, religious, and other population-based demographics.  Multiple layers can also be added to the same physical map.  Take a look at the map style categories below for inspiration.

Technology and Materials Used in Geologic Maps

  • With 3D printing technology, you are not limited to straight lines and boxes. The curves and cliffs are captured accurately and beautifully in astonishing detail.
  • Your vision of the final 3D map determines which materials we will choose to produce the best results. We help you to determine the materials that best suit your project.
  • We use fabrication technologies such as 3D printing, CNC cutting, and molding/casting.
  • Geologic maps show incredible detail.
  • Our maps are printed in full color (with over 17 million variations of color) for awe-inspiring presentations and displays. No painting required!
  • Typically, we use a special process for finishing the sides of the raised relief maps in a suede-like material, similar to the finish of a jewelry box.
  • Our in-house paint booth gives us flexibility in different types and grades of paint and finishing capabilities; we can provide UV-resistant coatings to protect the coloration of your 3M map for many years.
  • We also offer customized additions to our 3D maps and models. Our in-house carpentry shop will build elegant bases, tables, or cabinetry to display any map you choose. Worried about dust? We can customize a case to protect your display as well. Our skilled artisans can hand-paint details to make your map a true work of art. 

WhiteClouds Marscapes: A Captivating Collection of 3D Raised Landscape Art for Home or Office Decor

Pricing of Custom Geologic Maps

The price of 3D maps and models are generally based on your size requirements, specific design needs, and the amount of work it will take to produce. Each map is custom-built and charged for accordingly. The best way to determine cost is to email us, call us at 385-206-8700, or fill out the form below and let us bid on your project.

Get a Free Price Estimate for a Custom Geologic Map

Custom Fabrication Workflow

Common Questions & Answers

  • What is the largest map you can fabricate?  There is no limit to the size of a map we can build.  There are practical limits that will impact shipping and installation, but we work closely with our customers on these special requirements.
  • Can you fabricate with different technologies and materials? Yes.  Our most common fabrication technology is 3D Printing, but we can also build 3D Maps with CNC Cutting, 3D Foam, Molding/Casting, Thermoforming, and Sculpting.
  • What materials can you 3D print in?  We match the correct material and fabrication process to your requirements in terms of presentation, size, and transportability.  We can 3D print in PLA, FDM, Full-Color Sandstone, UV-cured resin, plastic, rubber-like, acrylic, and nylon – as well as combining multiple technologies.
  • Can you sign a Non-disclosure Agreement that you supply?  Yes.
  • How long will it take to create my map?  That depends on the design and size of the map.  A more complex or detailed map will take longer than a simple map, we can’t really say exactly how long it will take until we have the chance to understand what type of map you want fabricated.  Generally, smaller standard maps can be a couple of weeks and large museum exhibition maps can be 6 months.
  • What do you need from me to start the map fabrication?  Boundaries are a good place to start.  Determining map styles, sizes, height (may be exaggerated), and cabinetry needs are all part of the process.  Special design features can also be added.
  • What is a geologic map?  A geologic map is a type of map that displays information about the geological features and formations present in a particular area.  Geologic maps use a variety of symbols, colors, and other graphical elements to represent different types of rocks, minerals, and other geological features.  These maps are typically used by geologists, scientists, and other researchers to better understand the geological history and composition of a particular area.  They can also be used for a variety of practical purposes, such as identifying potential mineral resources, studying the movement of groundwater, and assessing potential natural hazards.
  • What is on a geologic map?  A geologic map typically displays information about the different types of rocks, minerals, and other geological features present in a particular area.  These maps use a variety of symbols, colors, and other graphical elements to represent different geological features.  For example, different colors may be used to represent different types of rocks or geologic formations, while symbols may be used to represent the presence of faults, folds, or other geological features.  In addition to these graphical elements, geologic maps may also include annotations or other notes to provide additional information about the area being studied.
  • How do I read a geologic map?  Reading a geologic map can be intimidating for those who are not familiar with the symbols and conventions used in geology.  However, with a bit of practice, it is possible to learn how to read and interpret these maps.  Here are some basic steps to help you get started:
    • Understand the map key:  The map key, also known as a legend, is the most important part of a geologic map. It explains the symbols, colors, and other graphical elements used on the map.  Take the time to familiarize yourself with the key before you begin.
    • Look for the rock formations:  Different types of rocks are usually represented by different colors or patterns on a geologic map.  Use the key to identify the different rock formations present in the area.
    • Look for faults and folds:  Faults and folds are represented by different symbols on a geologic map. These features are important because they can affect the movement of water and other resources in the area.
    • Pay attention to contour lines:  Contour lines are used to show the elevation of the land.  By understanding the contours, you can get a better sense of the topography of the area.
    • Consider the age of the rock formations:  The age of the rock formations can be an important factor in understanding the geological history of the area.  Geologic maps often include information about the relative ages of the different rock formations present.
    • By following these steps and taking the time to study the key, you can learn to read and interpret geologic maps with greater confidence and accuracy. With practice, you can develop a deeper understanding of the geological features and history of the area being studied.
  • What types of geologic maps are available?  There are several types of geologic maps available, each with their own unique characteristics and uses.  Some of the most common types of geologic maps include:
    • Bedrock geologic maps:  These maps display the distribution of bedrock formations, which are the solid rock layers that make up the Earth’s crust.  Bedrock geologic maps are often used for mineral exploration, as well as for understanding the geological history of an area.
    • Surficial geologic maps:  These maps display the distribution of surficial materials, such as soil, sand, and gravel.  Surficial geologic maps are often used for engineering and land-use planning purposes, as well as for studying the movement of groundwater.
    • Geologic hazard maps:  These maps display information about geologic hazards, such as earthquakes, landslides, and volcanic activity.  Geologic hazard maps are used for emergency planning and preparedness, as well as for assessing the risk of natural disasters.
    • Structural geologic maps: These maps display information about the orientation and arrangement of rock layers, faults, and folds.  Structural geologic maps are often used for mining and oil exploration, as well as for understanding the tectonic history of an area.
    • Geologic maps of specific features:  These maps display information about specific geologic features, such as caves, karst landscapes, and hot springs. These maps are often used for recreational purposes, as well as for scientific research.
  • What is the difference between geologic maps and topographic maps?  Geologic maps and topographic maps are two different types of maps that serve different purposes.  Here are the main differences between the two:
    • Content:  Geologic maps display information about the geological features and formations present in an area, such as rock types, faults, and folds.  Topographic maps, on the other hand, display information about the physical features of the land, such as elevation, contour lines, and bodies of water.
    • Purpose:  Geologic maps are used by geologists and other researchers to better understand the geological history and composition of the Earth’s surface, as well as for practical purposes such as mineral exploration and engineering.  Topographic maps, on the other hand, are used for navigation, land-use planning, and other purposes that require knowledge of the physical features of the land.
    • Scale:  Geologic maps are typically drawn at a larger scale than topographic maps. This is because geologic maps need to display more detail about the specific geological features present in an area. Topographic maps, on the other hand, are drawn at a smaller scale to show a broader view of the land.
    • Symbols:  Geologic maps use symbols and colors to represent different geological features, such as rock types and faults.  Topographic maps, on the other hand, use contour lines and shading to represent elevation and other physical features.
  • What are the 4 geologic areas?  There are four main geologic areas, also known as provinces, that make up the Earth’s surface.  These provinces are based on differences in geological history, processes, and rock types.  Here are the four geologic areas:
    • Craton:  The craton is the stable interior of a continent that has not undergone significant tectonic activity for a long period of time. It is made up of ancient rocks that are highly metamorphosed and deformed.  The craton is the oldest and most stable part of the Earth’s crust.
    • Orogen:  The orogen is an area of the Earth’s crust where tectonic plates have collided and created mountain ranges.  These areas are characterized by highly deformed rocks, intense metamorphism, and significant volcanic activity.
    • Platform:  The platform is a flat or gently sloping region of the Earth’s crust that is covered by sedimentary rocks.  These areas are often found on the edges of continents and are formed by the accumulation of sediment over time.
    • Fold-Thrust Belt:  The fold-thrust belt is an area of the Earth’s crust where two tectonic plates have collided and one has been pushed over the other.  This creates a series of folds and thrust faults in the rocks, and can result in the formation of mountains.
  • How are geologic maps made?  Geologic maps are created using a combination of field observations, laboratory analysis, and mapping techniques.  Here is a general overview of the process of making a geologic map:
    • Fieldwork:  Geologists begin by conducting fieldwork to observe the geological features and formations in the area of interest.  They take notes on the rock types, structures, and other features they observe, and record their observations on a field map.
    • Laboratory analysis:  Geologists may also collect samples of rocks, minerals, or fossils from the area for laboratory analysis.  This can help them determine the chemical composition, age, and other properties of the rocks.
    • Data integration:  The field observations and laboratory data are then integrated into a geologic map. Geologists use symbols and colors to represent different rock types, structures, and other geological features on the map.
    • Compilation and interpretation:  Once the data is integrated into the map, geologists compile and interpret the data to better understand the geological history of the area.  They may use cross-sections, stratigraphic columns, and other techniques to visualize the geology in three dimensions.
    • Refinement:  The geologic map is refined and revised based on new data and observations as they become available.
    • Modern geologic maps are often created using digital mapping tools and geographic information systems (GIS) software.  These tools allow geologists to create detailed maps that can be easily updated and shared with others.
    • What three things are shown on most geologic maps?  Most geologic maps show three main things: rock units, structural features, and geologic age.
    • Rock units are different types of rock formations that can be distinguished from each other based on their physical characteristics, such as color, texture, and composition.  On a geologic map, rock units are typically represented by different colors, patterns, or symbols.
    • Structural features refer to the various ways in which rocks can be deformed, such as folding, faulting, and tilting.  These features are important because they can provide information about the forces that have acted on the rocks over time.  Structural features are often shown on geologic maps using lines or symbols that indicate the orientation and type of deformation.
    • Geologic age is an important aspect of geologic maps, as it provides information about the relative timing of events in the Earth’s history.  Age is usually indicated on a geologic map using a stratigraphic column, which shows the various rock units in order of their relative ages, with the oldest rocks at the bottom and the youngest rocks at the top.
  • What are the 6 geological structures?  There are six main types of geological structures:
    • Folds:  Folds are the result of the bending or buckling of rock layers due to compression forces.  They are commonly found in regions where tectonic plates are colliding, such as mountain ranges.
    • Faults:  Faults occur when rock layers are broken and displaced along a fracture or fault plane.  They are often associated with earthquakes and can create distinctive landscapes, such as fault scarps and rift valleys.
    • Joints:  Joints are fractures in rock that do not involve any displacement.  They are commonly found in areas where rocks have been subjected to stress, such as in mountain ranges or along coastlines.
    • Domes:  Domes are circular or elliptical structures in which rock layers have been uplifted and arched upwards.  They are often associated with volcanic activity and can be found in areas with hotspots or mantle plumes.
    • Basins:  Basins are large, low-lying areas where rock layers have been depressed or subsided.  They are often associated with sedimentary deposits and can contain important oil and gas reserves.
    • Igneous intrusions:  Igneous intrusions occur when magma or molten rock is forced into existing rock layers and solidifies.  They can create distinctive features, such as dikes, sills, and batholiths.
  • What is an example geologic area?  One example of a geologic area is the Grand Canyon in Arizona, USA.  The Grand Canyon is a large, steep-sided gorge carved by the Colorado River, and it exposes nearly two billion years of Earth’s geological history.  The rocks and formations found in the Grand Canyon are a testament to the complex geological processes that have shaped the region over millions of years, including uplift, erosion, and sedimentation.
  • How do I draw a geologic map?  Drawing a geologic map is a complex and technical process that requires specialized knowledge and training.  However, the basic steps involved in creating a geologic map are as follows:
    • Gather data:  The first step in drawing a geologic map is to gather data about the area of interest.  This typically involves conducting fieldwork to observe the rock formations and other geological features, as well as collecting rock samples for analysis.
    • Analyze the data:  Once the data has been collected, it must be analyzed to identify the different rock types and geological structures present in the area.  This may involve using specialized equipment, such as microscopes or geophysical instruments.
    • Create a base map:  Before creating the geologic map, a base map must be created that shows the topography and other physical features of the area.  This can be done using satellite imagery, aerial photographs, or topographic maps.
    • Draw the geologic units:  Using the data and analysis gathered in steps 1 and 2, the geologic units can be identified and represented on the base map.  Each unit is typically given a unique color or pattern to make it easily distinguishable from other units.
    • Add symbols and annotations:  To make the geologic map more informative, various symbols and annotations can be added to indicate the location of faults, folds, and other geological structures, as well as the age and type of rock formations.
    • Finalize the map:  Once the geologic map has been drawn, it should be reviewed and checked for accuracy.  Any errors or inconsistencies should be corrected, and the final map should be produced in a format suitable for printing or publication.
    • Overall, drawing a geologic map is a complex and time-consuming process that requires a thorough understanding of geology, cartography, and data analysis.  It is typically carried out by trained geologists or cartographers using specialized software and tools.
  • How does a geologic map work?  A geologic map works by providing a visual representation of the geology of a specific area, including the location and types of rock formations, geological structures, and other features.  This information is used by geologists, engineers, and other professionals to better understand the geological history of the area and to plan and design projects such as mining operations, construction projects, and environmental remediation efforts.
    • Geologic maps typically use a combination of colors, patterns, symbols, and annotations to convey information about the geology of an area.  Different rock formations are typically assigned distinct colors or patterns, while symbols and annotations are used to indicate the presence of faults, folds, and other geological structures.  The age and composition of the rock formations may also be indicated on the map.
    • To use a geologic map, one typically starts by identifying the specific area of interest on the map. This may involve zooming in on a specific location or using a reference point such as a city or landmark to orient oneself.  Once the area of interest has been identified, one can begin to analyze the geologic information provided on the map to better understand the geological features and history of the area.
    • For example, a geologist studying a particular area might use a geologic map to identify the location of different types of rock formations, such as sandstone or shale.  They might also use the map to identify the location of faults or other geological structures that could impact the stability of the ground or the availability of natural resources. This information can then be used to make informed decisions about geological hazards, resource extraction, or construction projects.
  • How are colors chosen for a geologic map?  Geologic maps use a variety of colors to represent different types of geological features.  The colors chosen for these maps are typically based on the rock types and geological structures that are present in the area being mapped.  For example, red is often used to represent areas of volcanic rock, while shades of green and gray may be used to represent sedimentary rocks.  Blues and purples may be used to indicate areas of metamorphic rocks, and shades of brown and yellow are often used for areas of sandstone and limestone.   The specific colors chosen for a geologic map will depend on the location being mapped, as well as the preferences of the cartographer creating the map. It is important to note that the colors used on a geologic map are not arbitrary, but are carefully selected to accurately represent the geology of the area being mapped.

Do you have a question we didn’t answer? Don’t hesitate to contact us at 1-385-206-8700 or [email protected].

Worldwide Delivery

WhiteClouds has delivered maps around the world.

History of Geologic Maps

Geologic maps are an essential tool for understanding the Earth’s geology and its history.  These maps provide valuable information on the types of rocks and minerals that make up the Earth’s surface, as well as the various geological processes that have shaped our planet over millions of years. But where did the idea of creating geologic maps originate, and how have they evolved over time? 

The origins of geologic mapping can be traced back to the late 18th and early 19th centuries, when geologists began to recognize the importance of understanding the Earth’s geology.  At this time, geologists were primarily interested in studying the economic potential of rocks and minerals, such as coal and iron, and mapping the locations of these resources.

One of the earliest examples of geologic mapping comes from William Smith, an English geologist who is often called the “father of geology.”  In the early 1800s, Smith began creating detailed maps of the geology of England, using data from coal mines and other sources to identify different rock layers and their ages.  These maps were essential for identifying the locations of coal and other mineral resources, and helped to lay the foundation for modern geologic mapping.

The mid to late 19th century is often referred to as the “golden age” of geologic mapping, as advancements in technology and scientific understanding allowed for more detailed and accurate maps to be created. During this time, geologists began to develop new techniques for studying the Earth’s geology, including stratigraphy, the study of rock layers, and paleontology, the study of fossils.

One of the most famous geologic maps from this period is the Geological Map of Europe, created by the Austrian geologist Eduard Suess in 1875.  This map was the first to depict the geological history of an entire continent, and helped to lay the groundwork for modern geologic mapping techniques.

In the 20th century, geologic mapping continued to evolve, with new technologies and techniques making it easier to create more detailed and accurate maps.  The development of aerial photography and satellite imagery allowed geologists to map large areas quickly and efficiently, while advances in computer modeling allowed for more sophisticated and detailed maps to be created.

Today, geologic maps continue to play a crucial role in our understanding of the Earth’s geology and history.  These maps provide valuable information on the locations of mineral resources, geological hazards such as earthquakes and volcanic eruptions, and the impact of human activities on the environment.

The history of geologic mapping is a testament to the ingenuity and persistence of scientists who have sought to understand the complex processes that shape our planet.  From the early maps of William Smith to the sophisticated computer models of today, geologic maps have played a crucial role in our understanding of the Earth’s geology and history.  As we continue to explore and study our planet, geologic maps will undoubtedly continue to be a vital tool for scientists and researchers around the world.

William Smith First Geologic Map
Bathymetric Map-Sir John Murray
The Oceans by Sir John Murray
Bathymetric Map-Marie Tharp
First Map of the Atlantic Ocearn Floor by Marie Tharp

Get a free quote

Get a Free Quote