Elevation Maps
What is an Elevation Map?
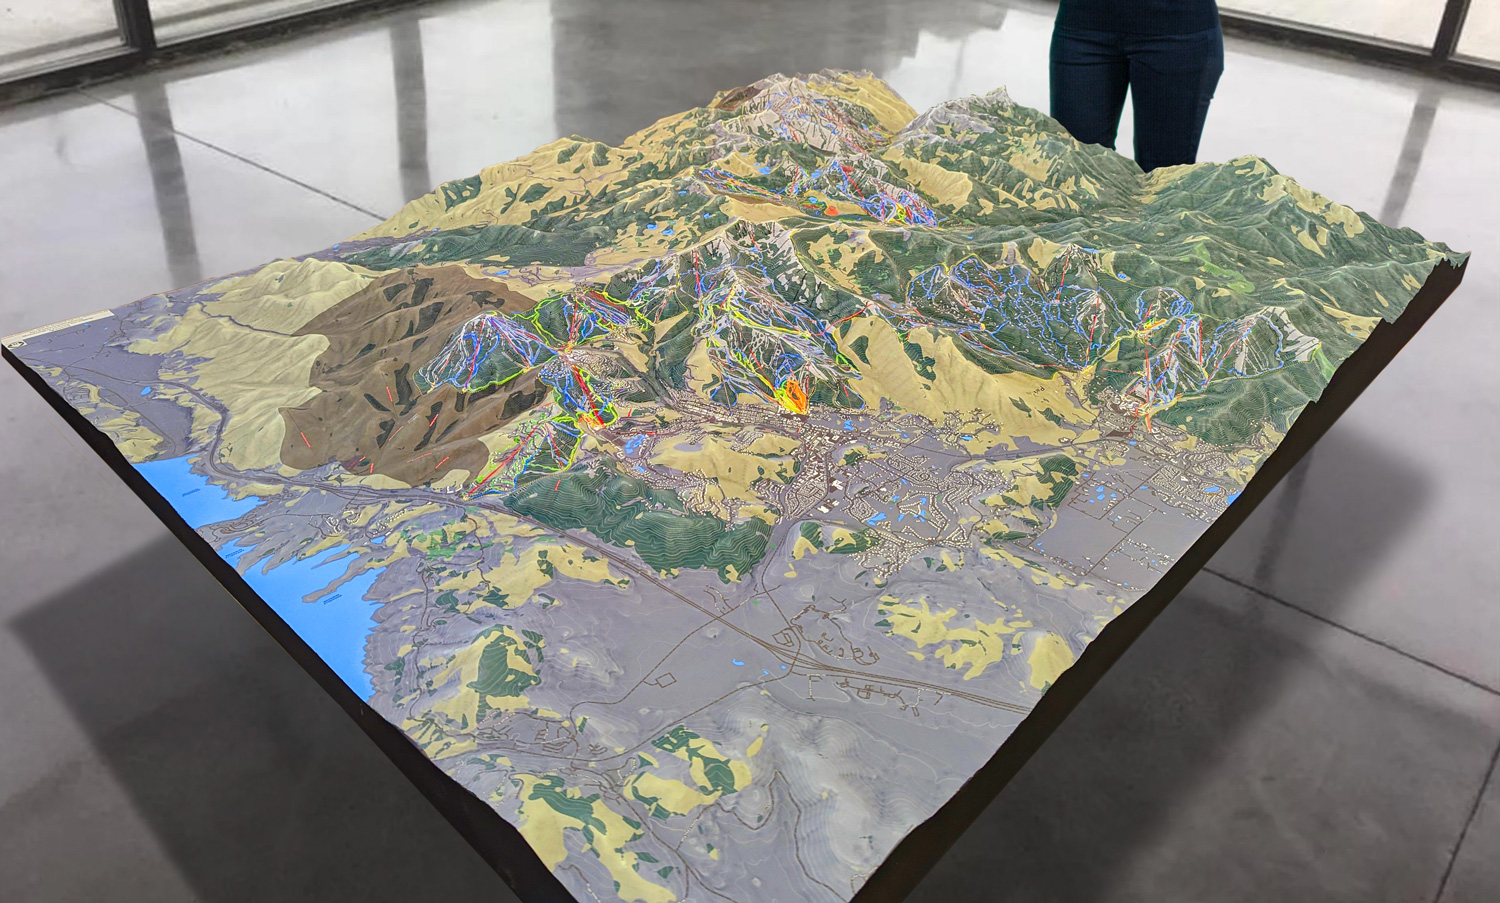
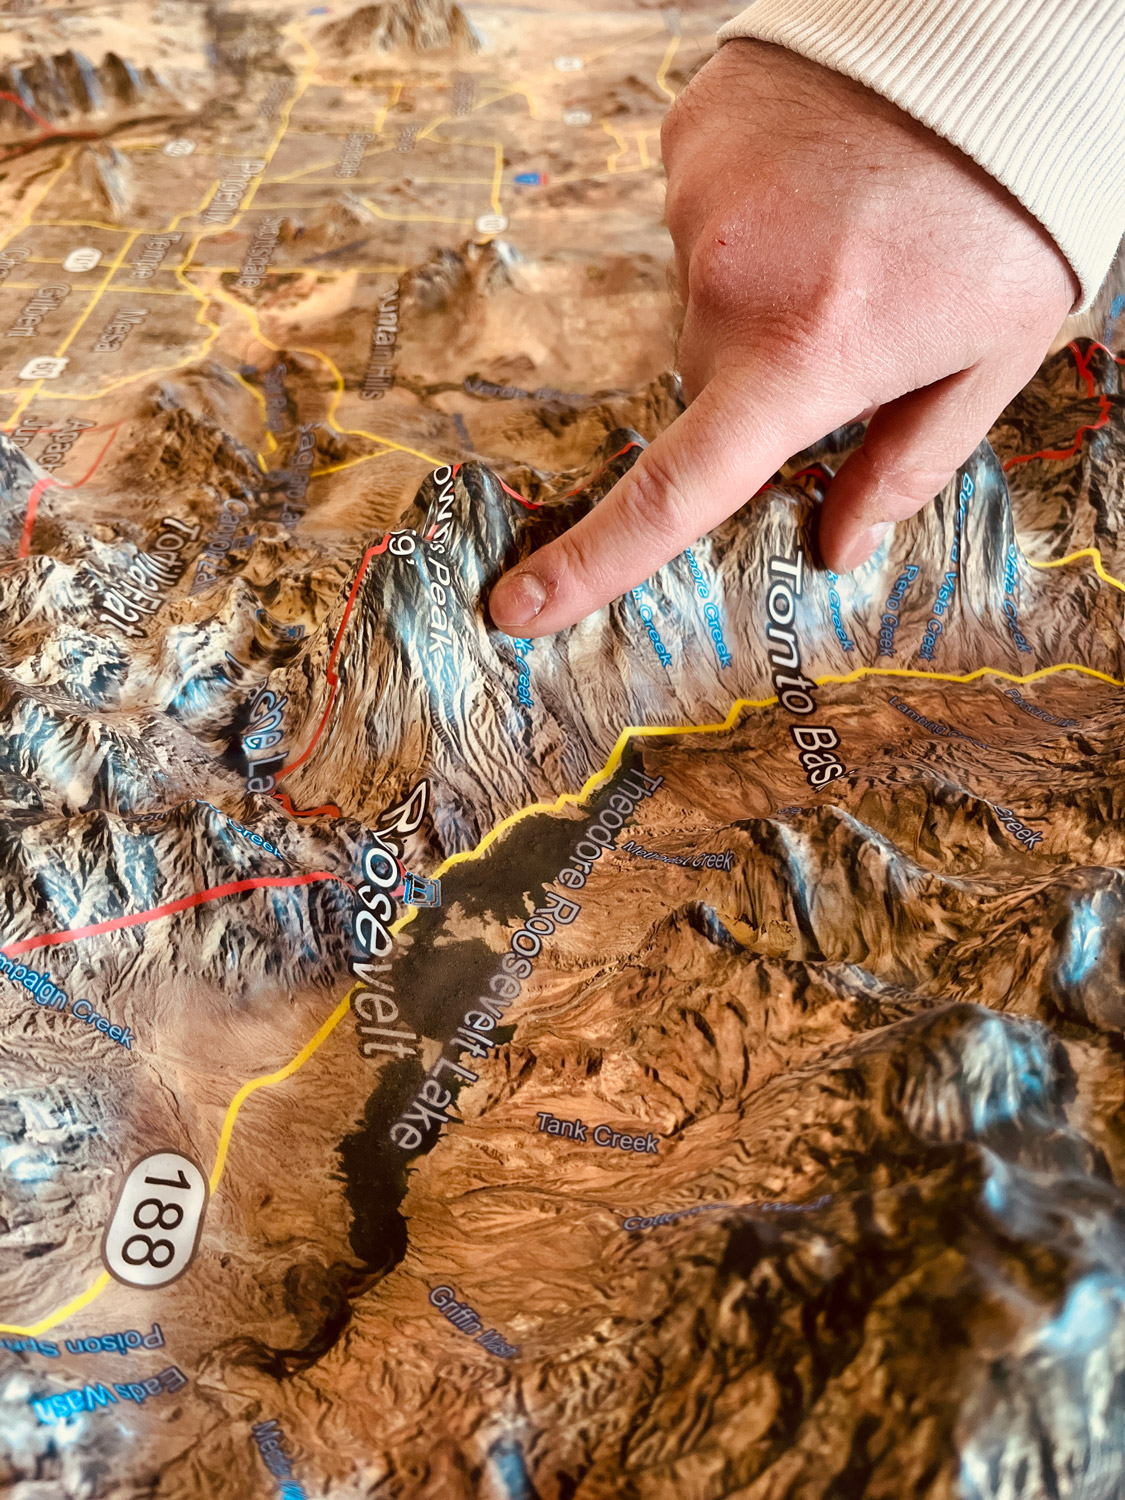
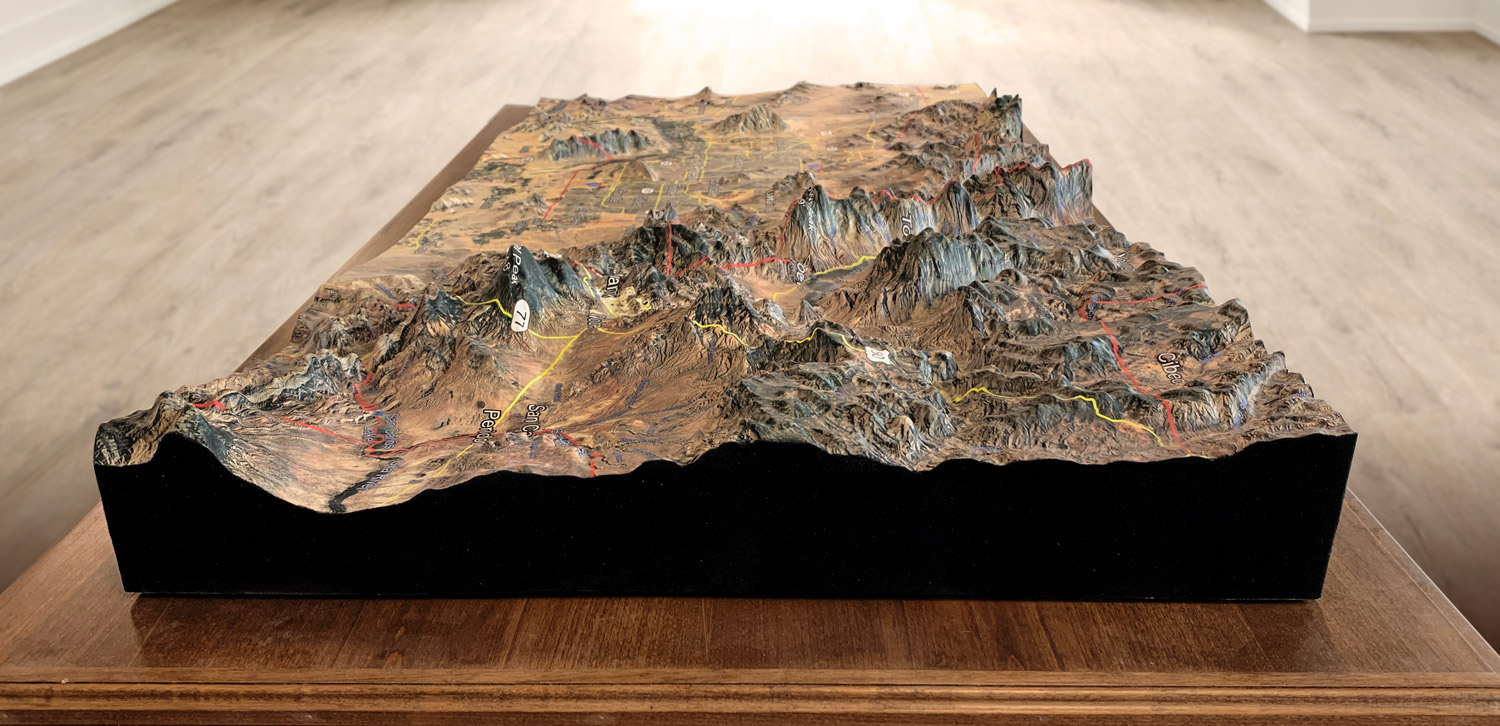
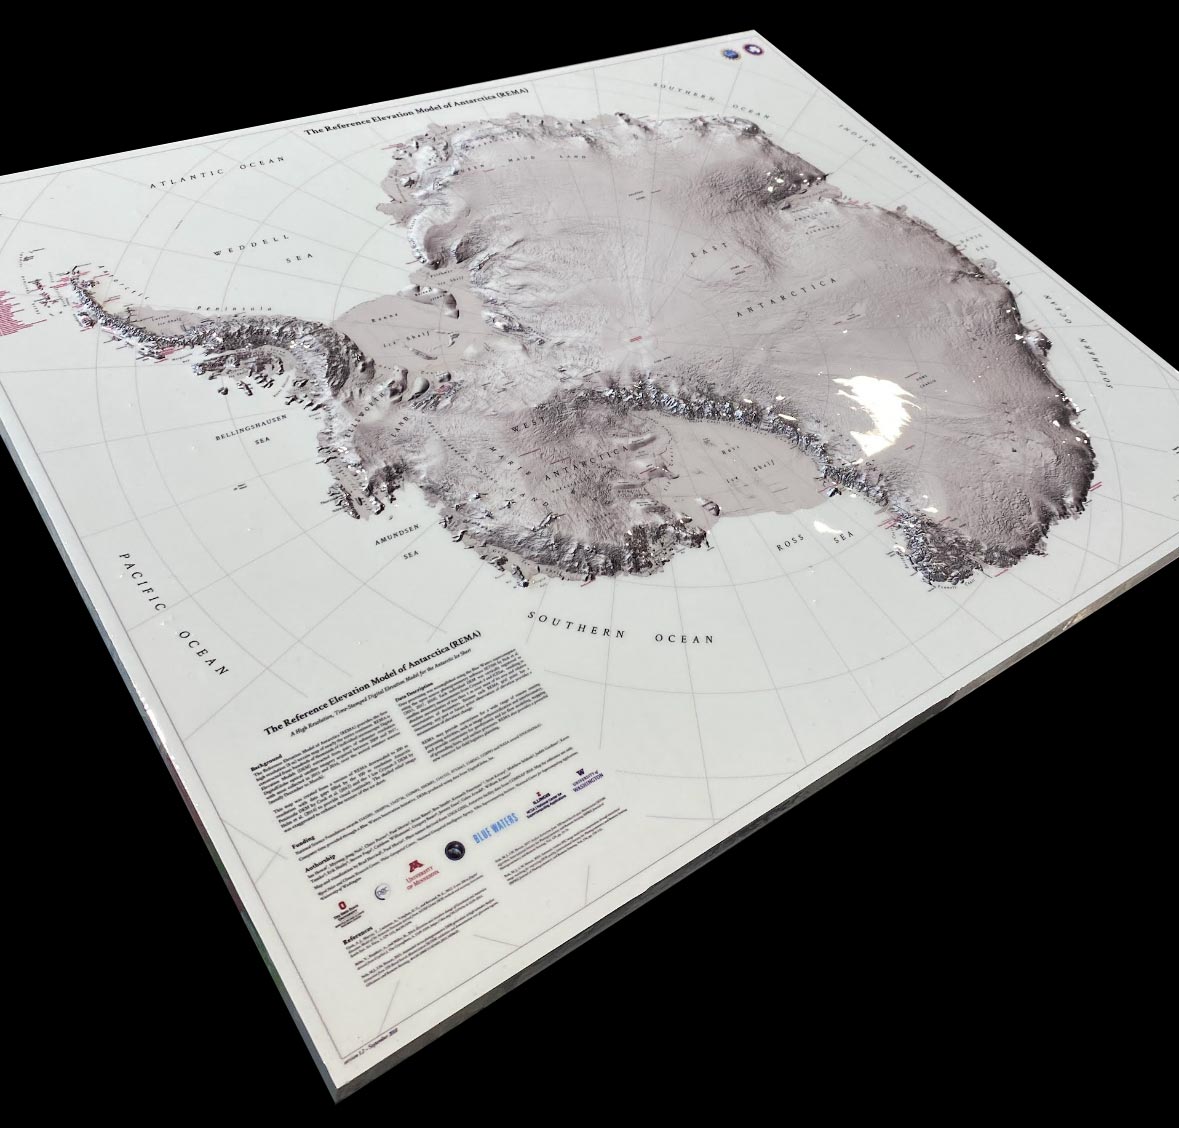
We build 2D and 3D Elevation Maps
Table of Contents
Elevation Maps
The Earth is a vast and complex planet, with a surface that is constantly changing. Mountains rise and valleys sink, oceans ebb and flow, and the land is shaped by powerful geological forces. Understanding the shape and elevation of the Earth’s surface is crucial for a variety of fields, from engineering to environmental science. That’s where elevation maps come in. These maps are like a window into the Earth’s secrets, revealing the location and shape of mountains, valleys, plateaus, and other landforms. With the help of elevation maps, we can explore the hidden depths of the planet, uncovering its mysteries and unlocking its potential. So grab a map, and get ready to explore the heights and depths of the Earth like never before.
Elevation maps are created using a variety of techniques, including ground surveys, aerial photography, and remote sensing. Each technique has its own strengths and weaknesses, and the choice of technique depends on the purpose of the map.
- Ground surveys involve physically measuring the elevation of the land using instruments such as a theodolite or a laser range finder. This technique is very accurate, but it is also very time-consuming and expensive. Ground surveys are typically used for small areas, such as a construction site or a geological study.
- Aerial photography involves taking photographs of the land from an airplane or a drone. These photographs can be used to create a stereo pair, which can be used to create a three-dimensional image of the land. This technique is less accurate than ground surveys, but it is much faster and less expensive. Aerial photography is typically used for larger areas, such as a city or a region.
- Remote sensing involves using satellite imagery or other remote sensing techniques to create elevation maps. This technique is less accurate than ground surveys or aerial photography, but it is much faster and less expensive. Remote sensing is typically used for large-scale mapping, such as mapping the entire Earth’s surface.
Elevation maps, also known as topographic maps, are an essential tool for understanding the surface of the Earth. These maps provide detailed information about the height, slope, and shape of the terrain, allowing us to visualize the landscape and identify important features such as mountains, valleys, rivers, and plateaus. Some of the features of elevation maps include:
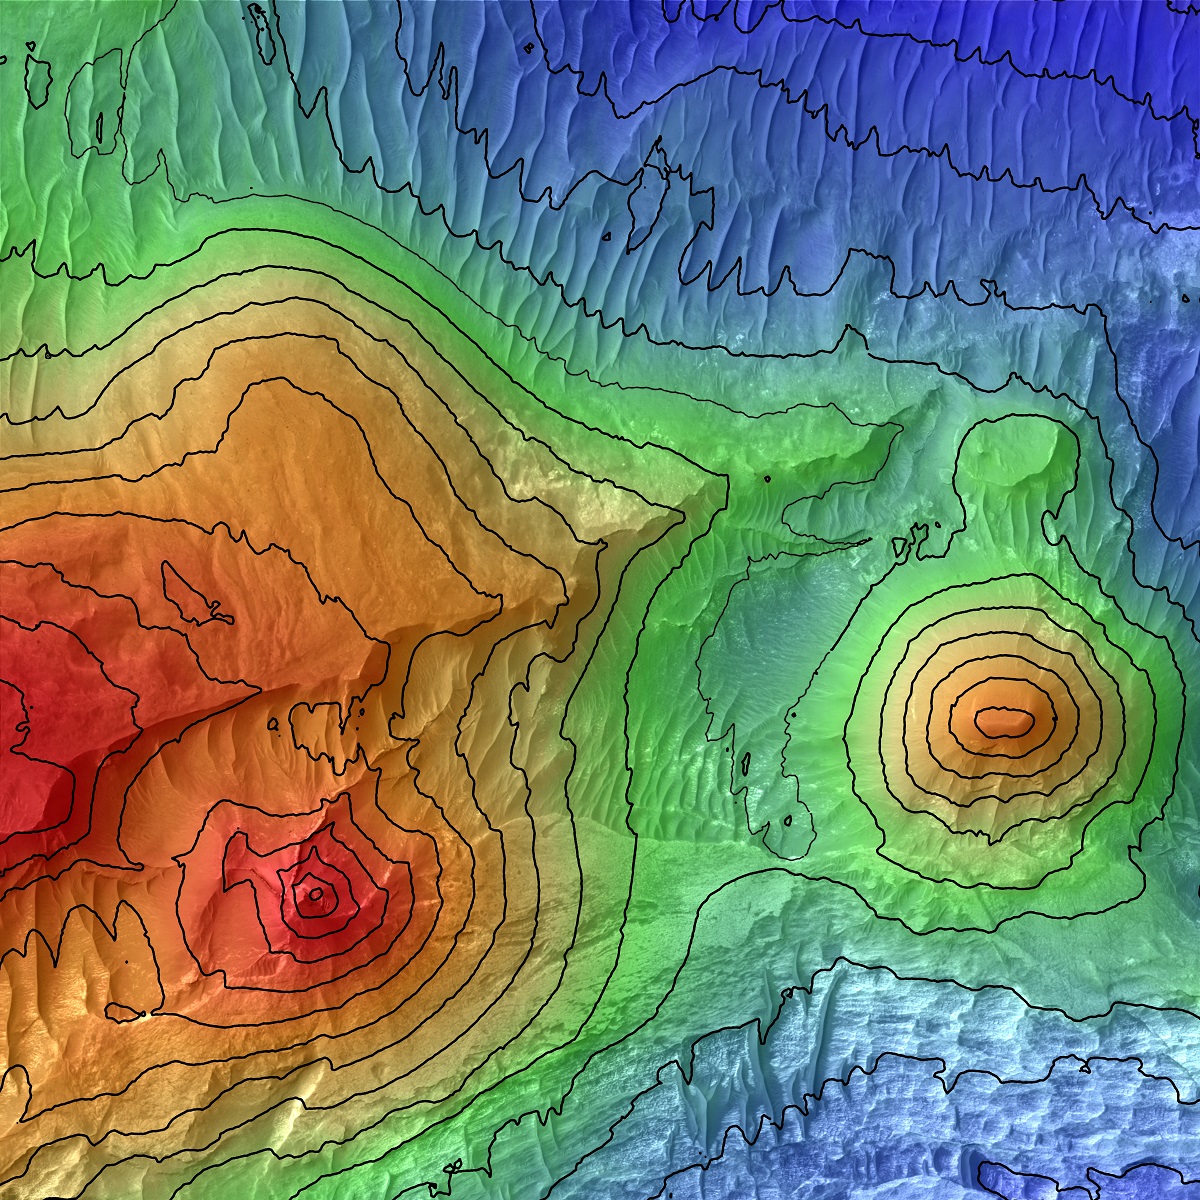
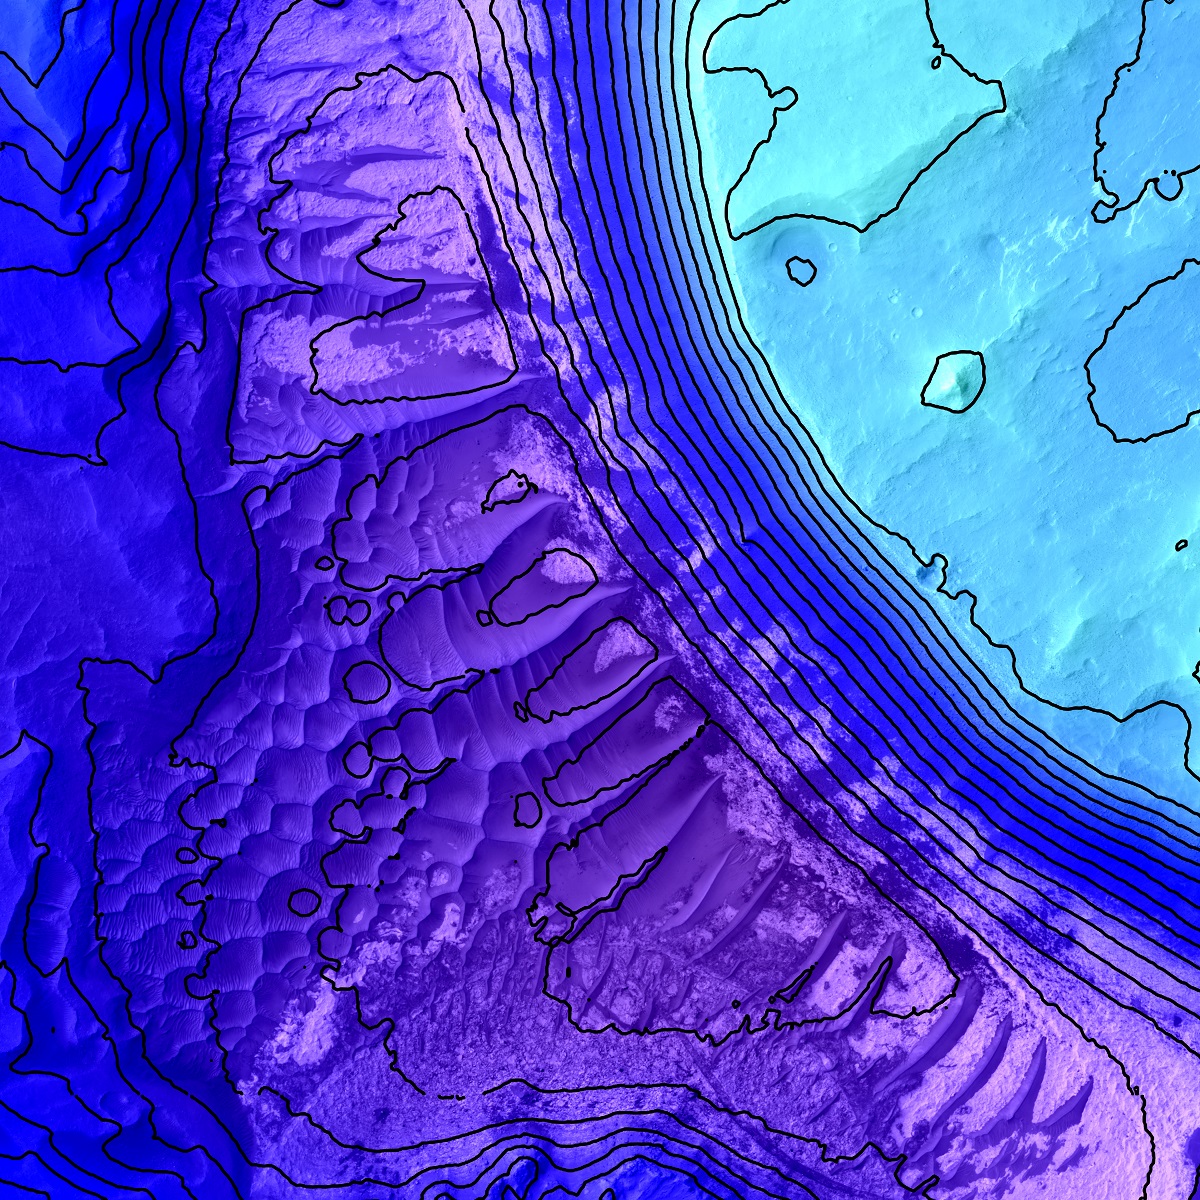
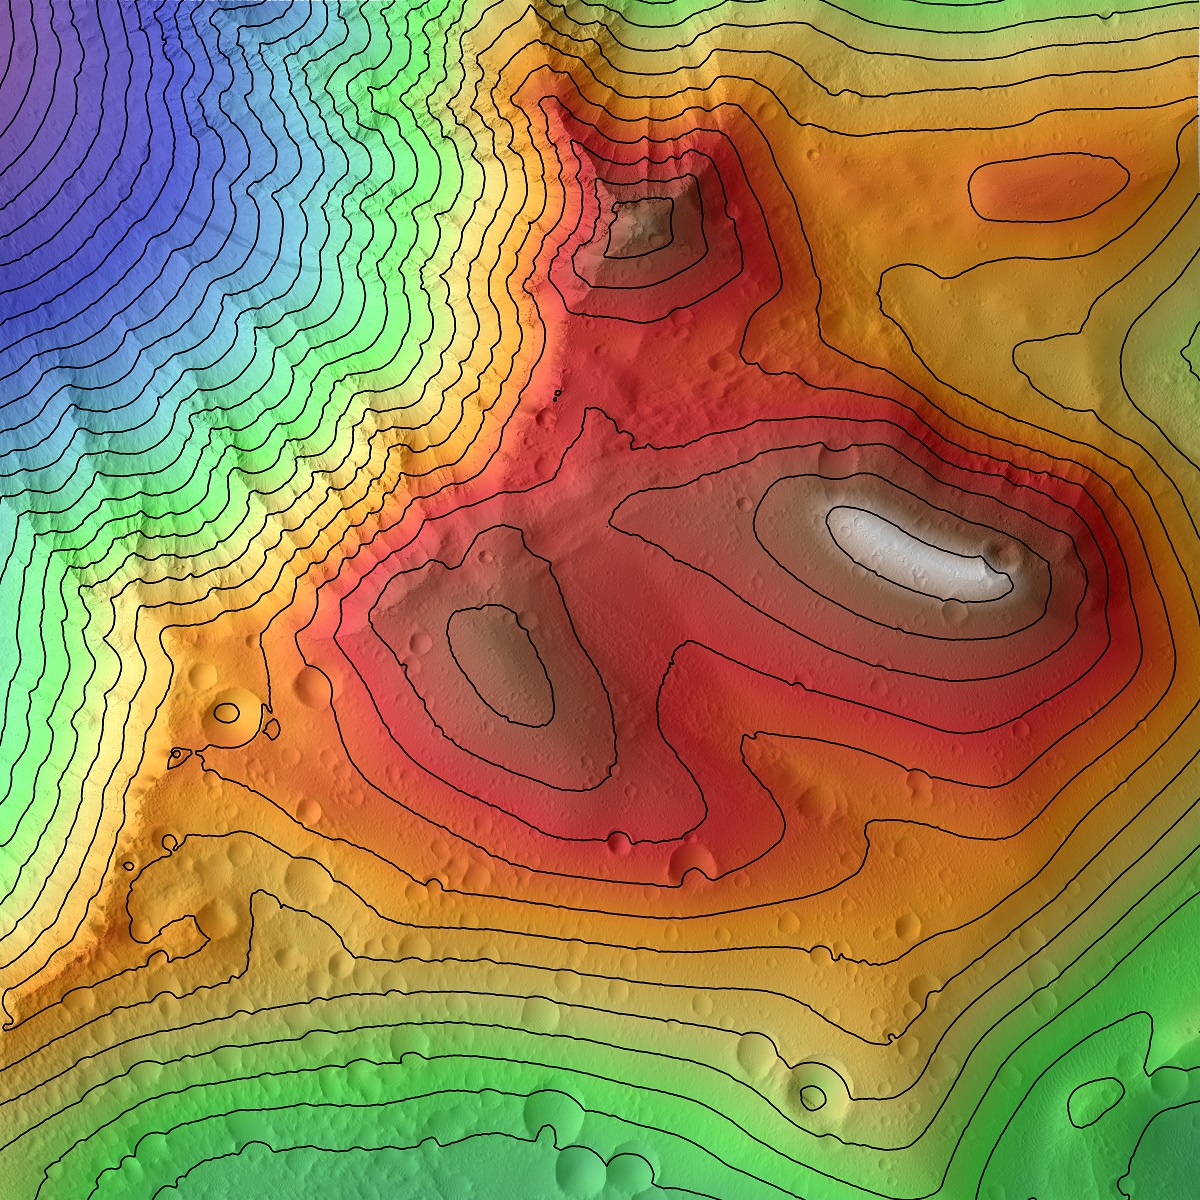
- Contours: One of the most distinctive features of an elevation map is the contour lines. These lines connect points of equal elevation, creating a three-dimensional representation of the terrain. Contour lines are used to show the shape of the land and the slope of the terrain. Close contour lines indicate steep terrain, while widely spaced contour lines indicate flatter terrain. By studying the contour lines, you can get a sense of the height and steepness of the terrain, which is important for planning hiking trips or designing infrastructure such as roads and buildings.
- Spot Elevations: Spot elevations are points on the map that indicate the exact elevation at a specific location. They are usually marked with a number and a symbol, such as a small circle or triangle. Spot elevations are helpful for identifying the exact height of a particular point on the map. For example, if you are planning a hiking trip and want to know the elevation of a particular peak, you can look for the spot elevation on the map.
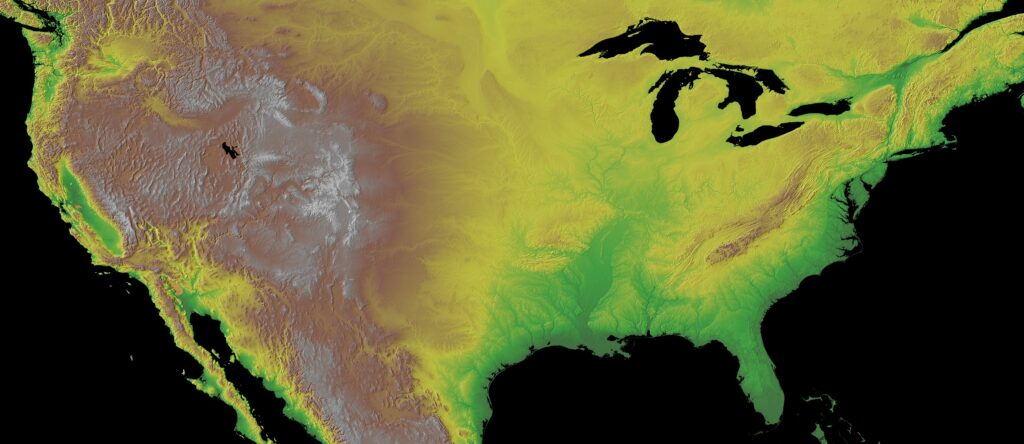
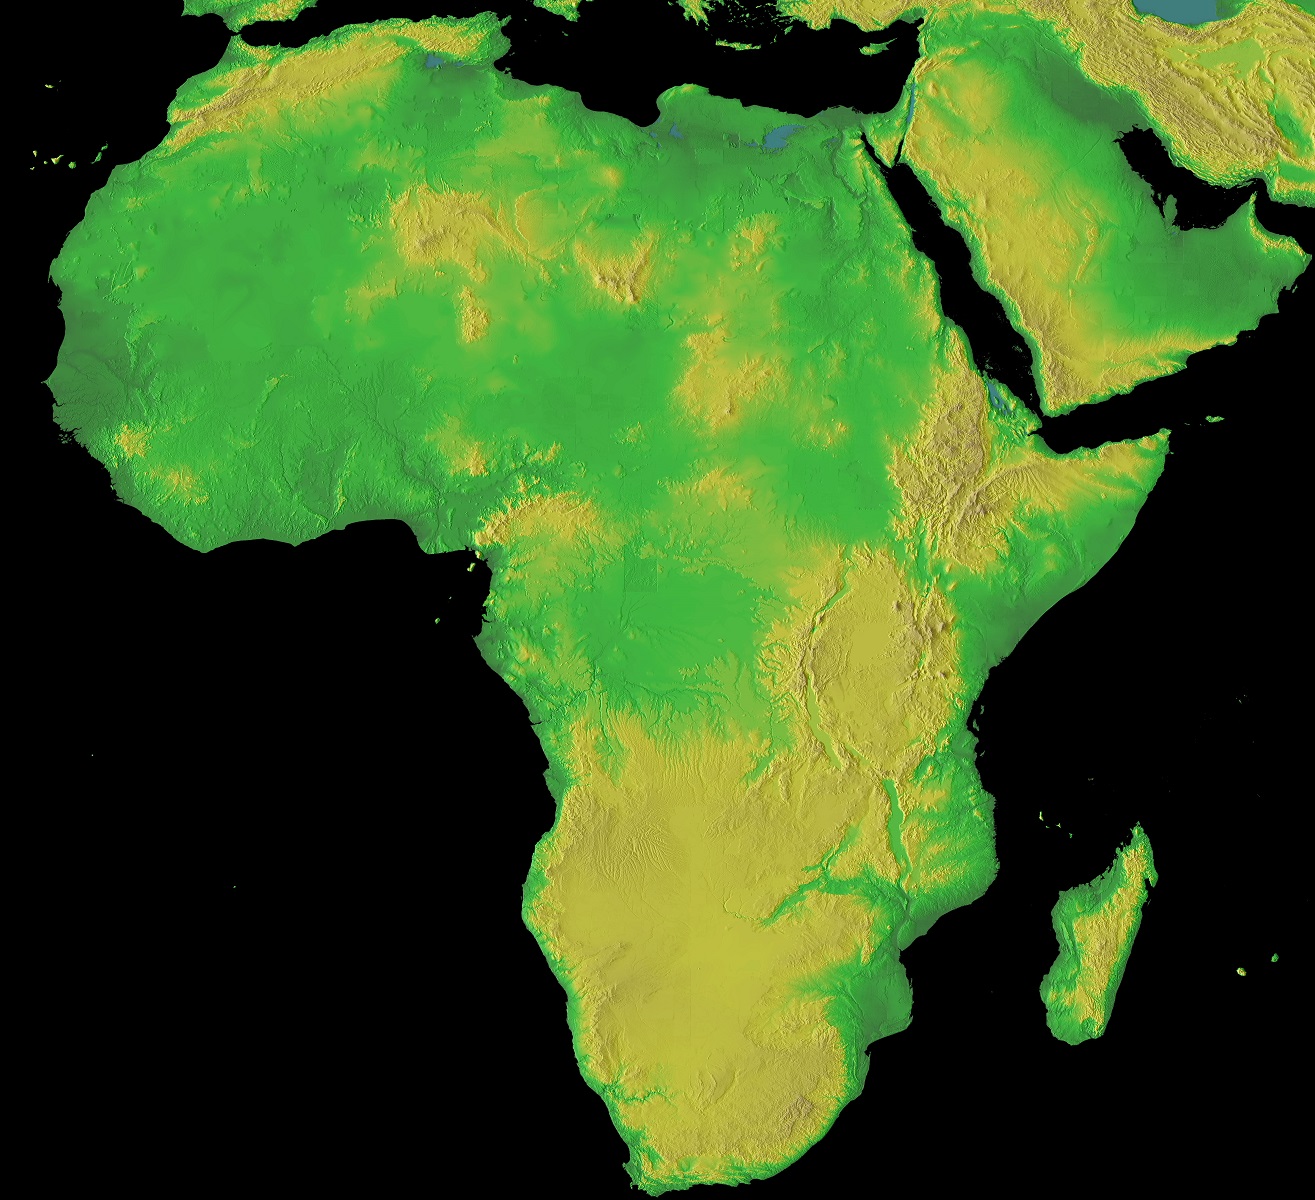
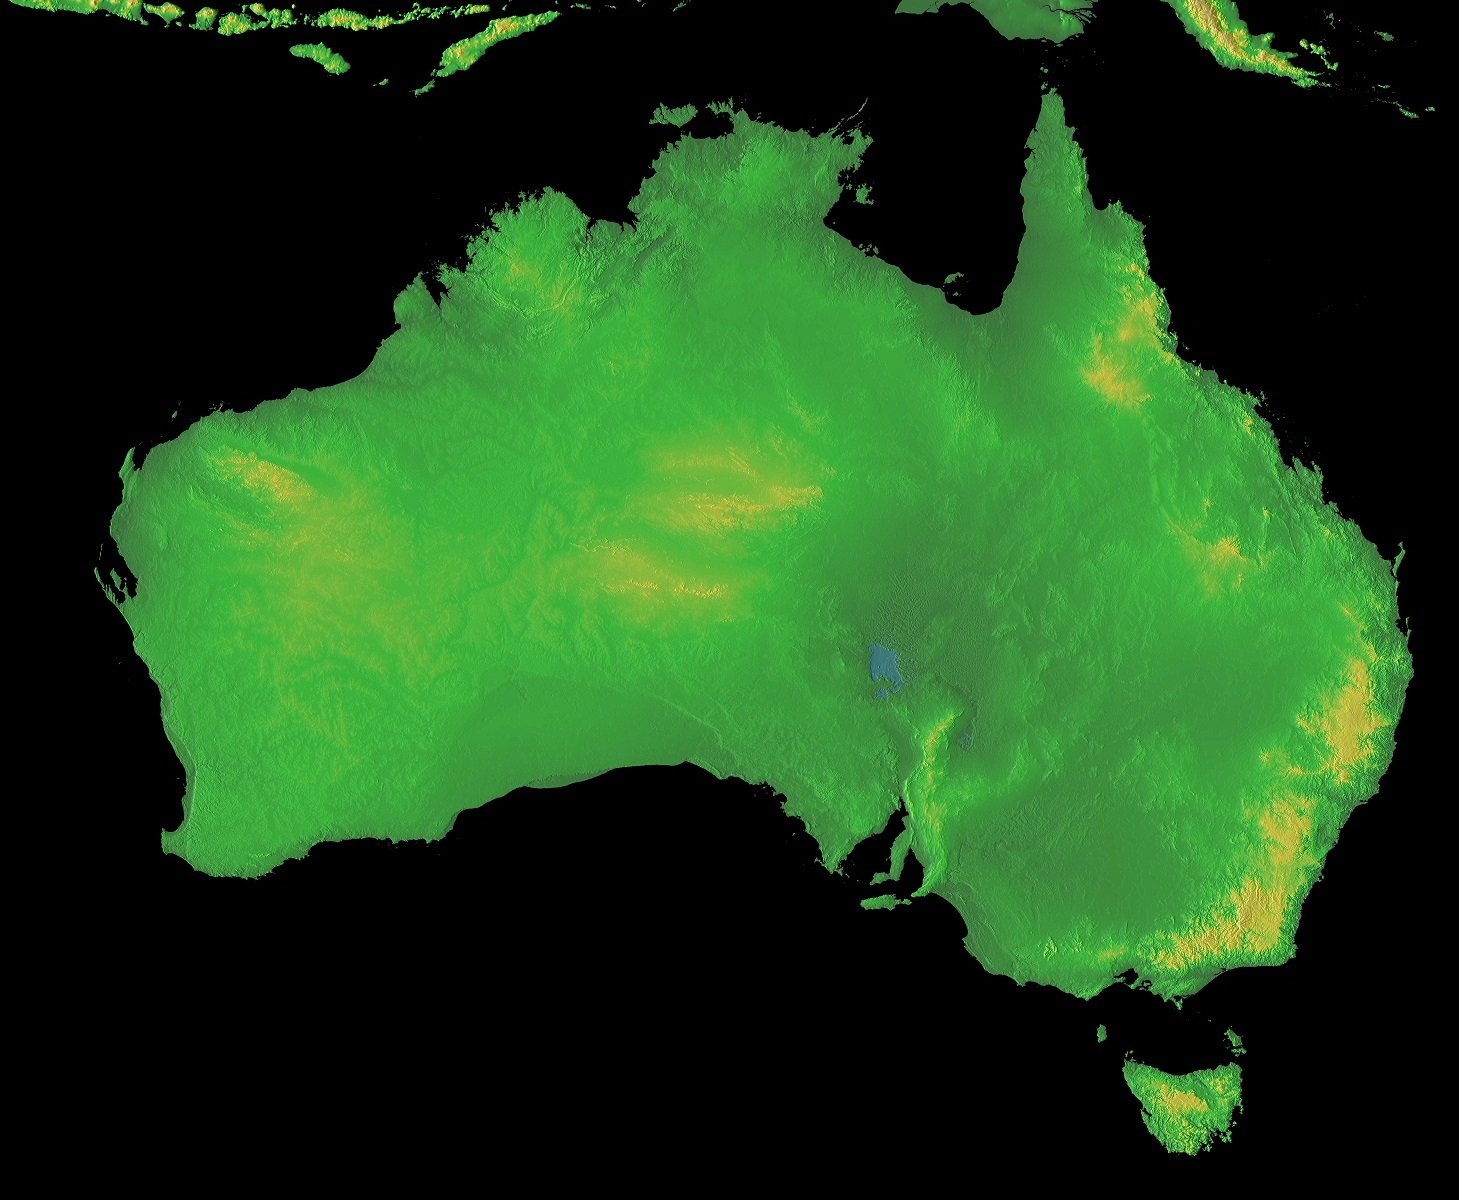
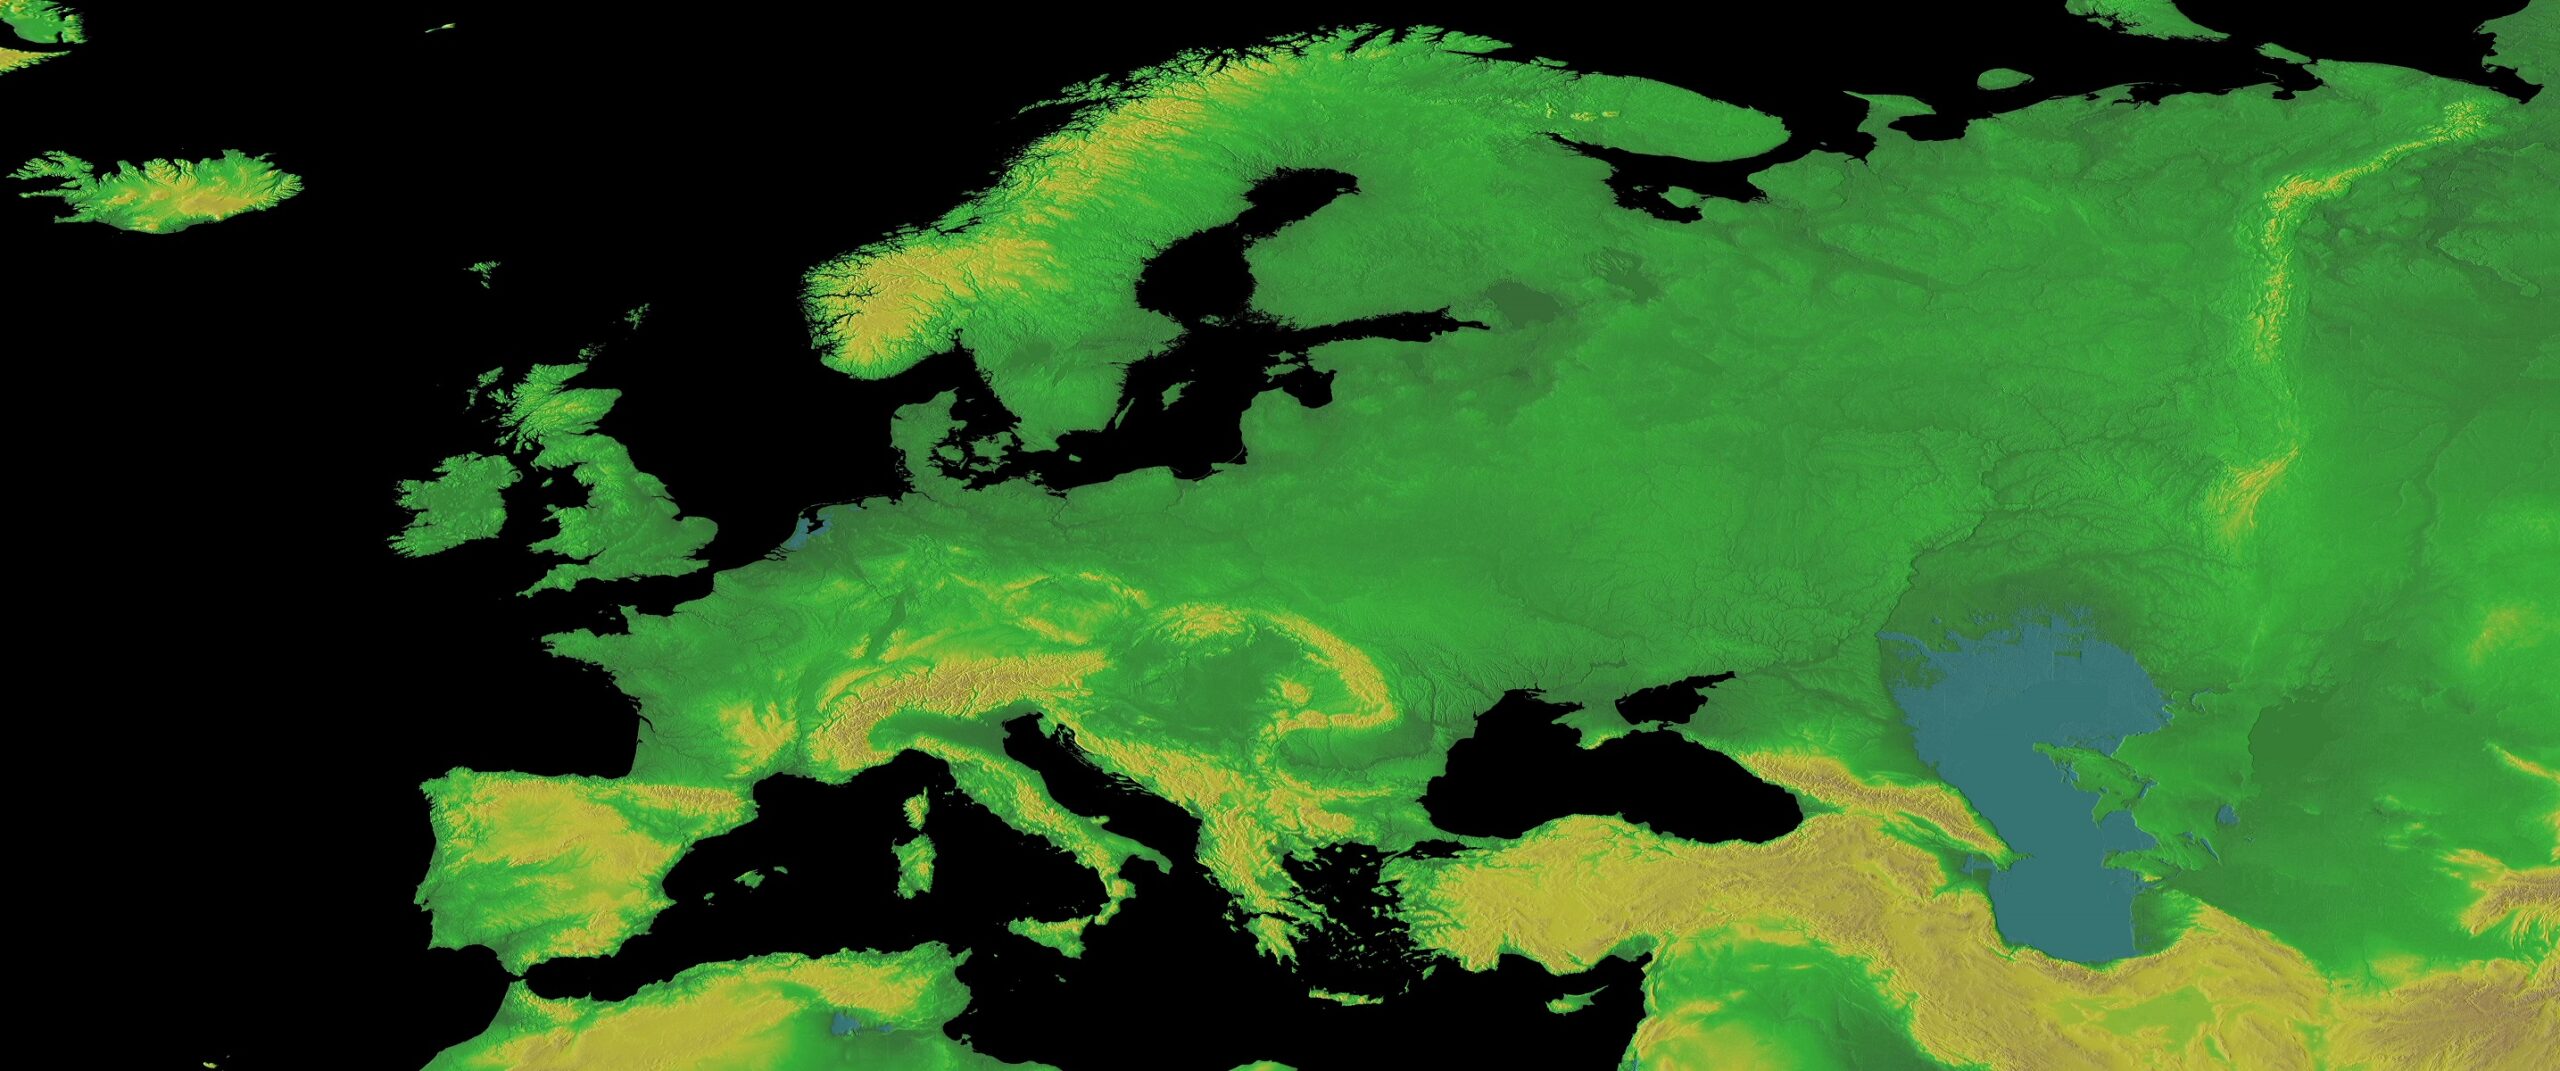
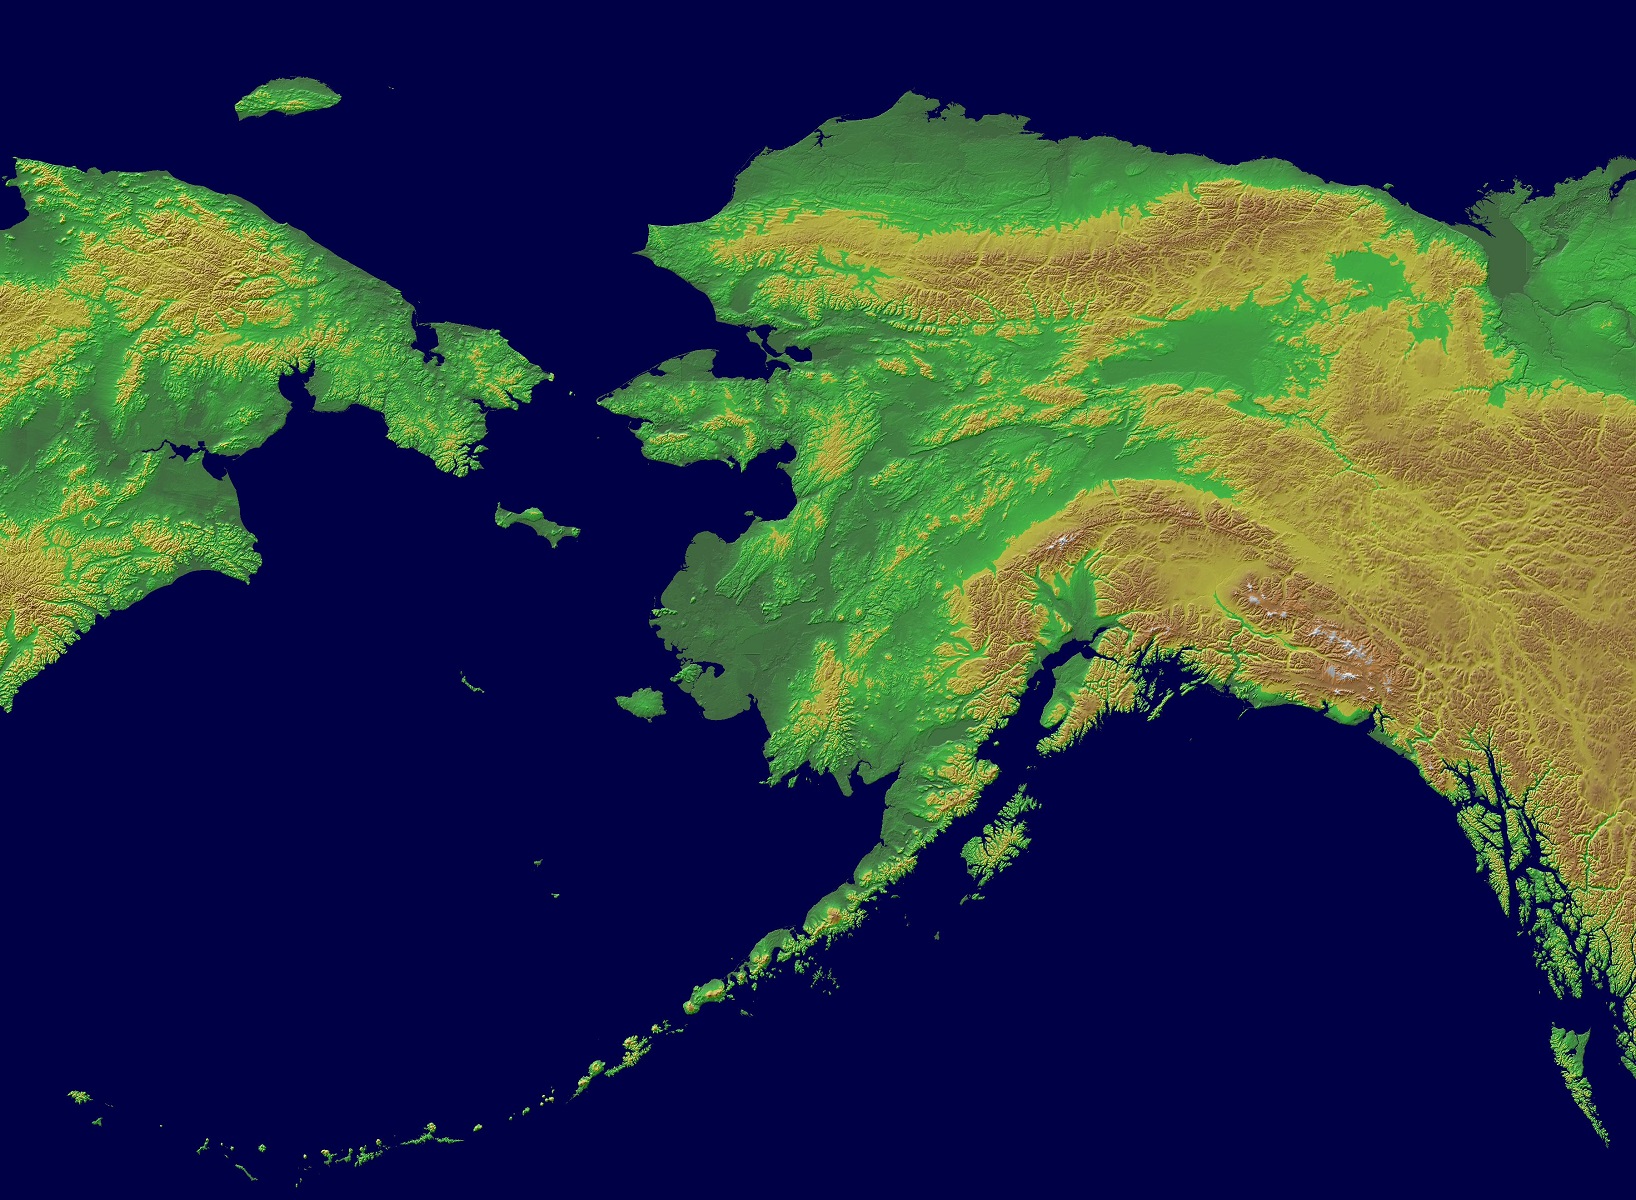
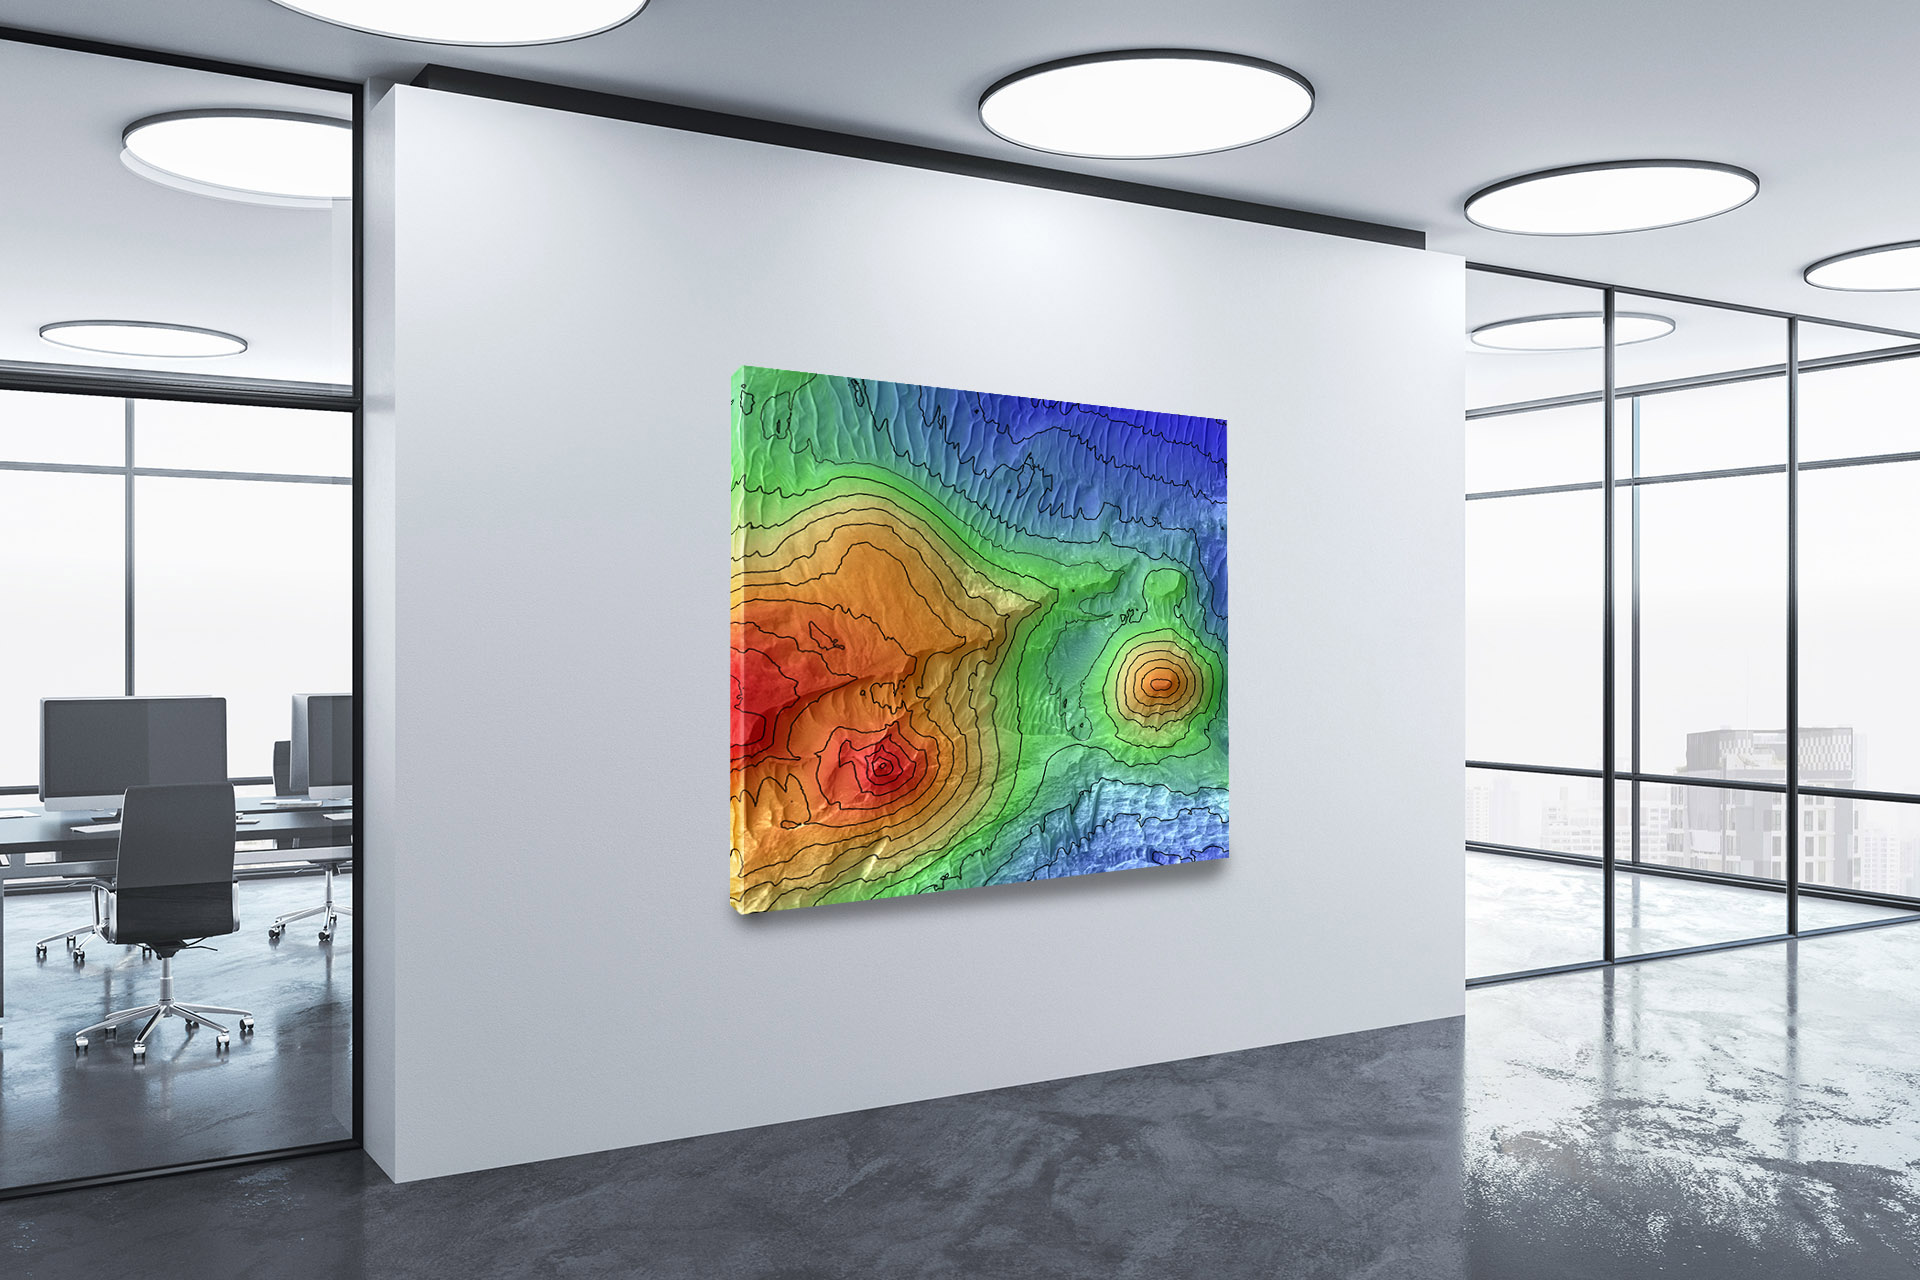
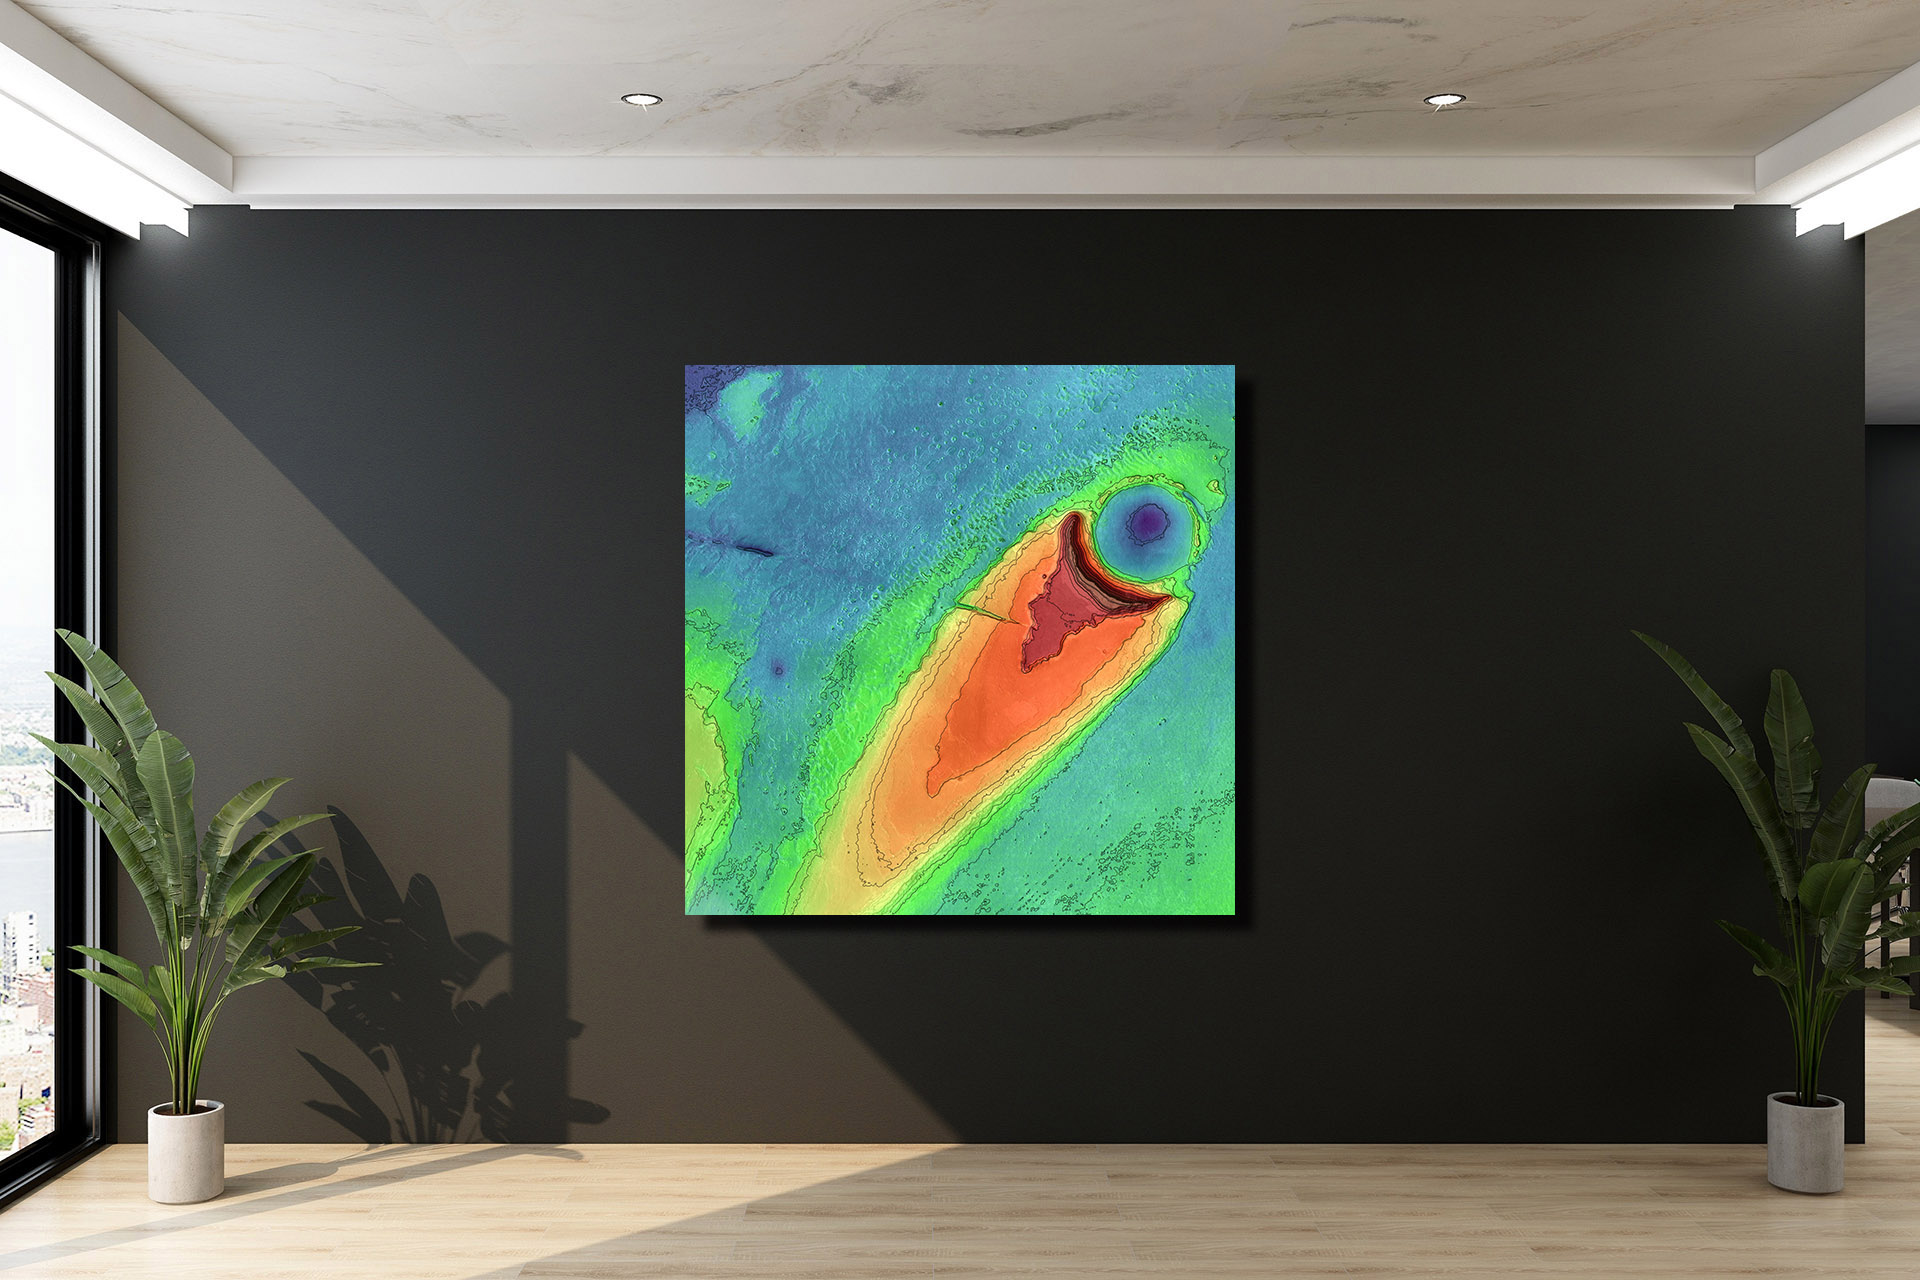
- Hypsometric Tinting: Hypsometric tinting is a technique used to color-code elevation maps. This technique uses different colors to represent different elevations, with higher elevations typically represented by darker colors. Hypsometric tinting makes it easier to visualize the terrain, and it can be used to highlight important features such as mountains, valleys, and plateaus. This technique is often used in tourist maps to help visitors identify popular hiking trails or scenic overlooks.
- Shaded Relief: Shaded relief is a technique used to create a three-dimensional effect on an elevation map. This technique uses light and shadow to simulate the way that sunlight interacts with the terrain. By shading the areas of the map that receive less sunlight, the features of the terrain become more pronounced, creating a more realistic and three-dimensional effect. Shaded relief is particularly useful for visualizing the terrain in mountainous regions or areas with complex topography.
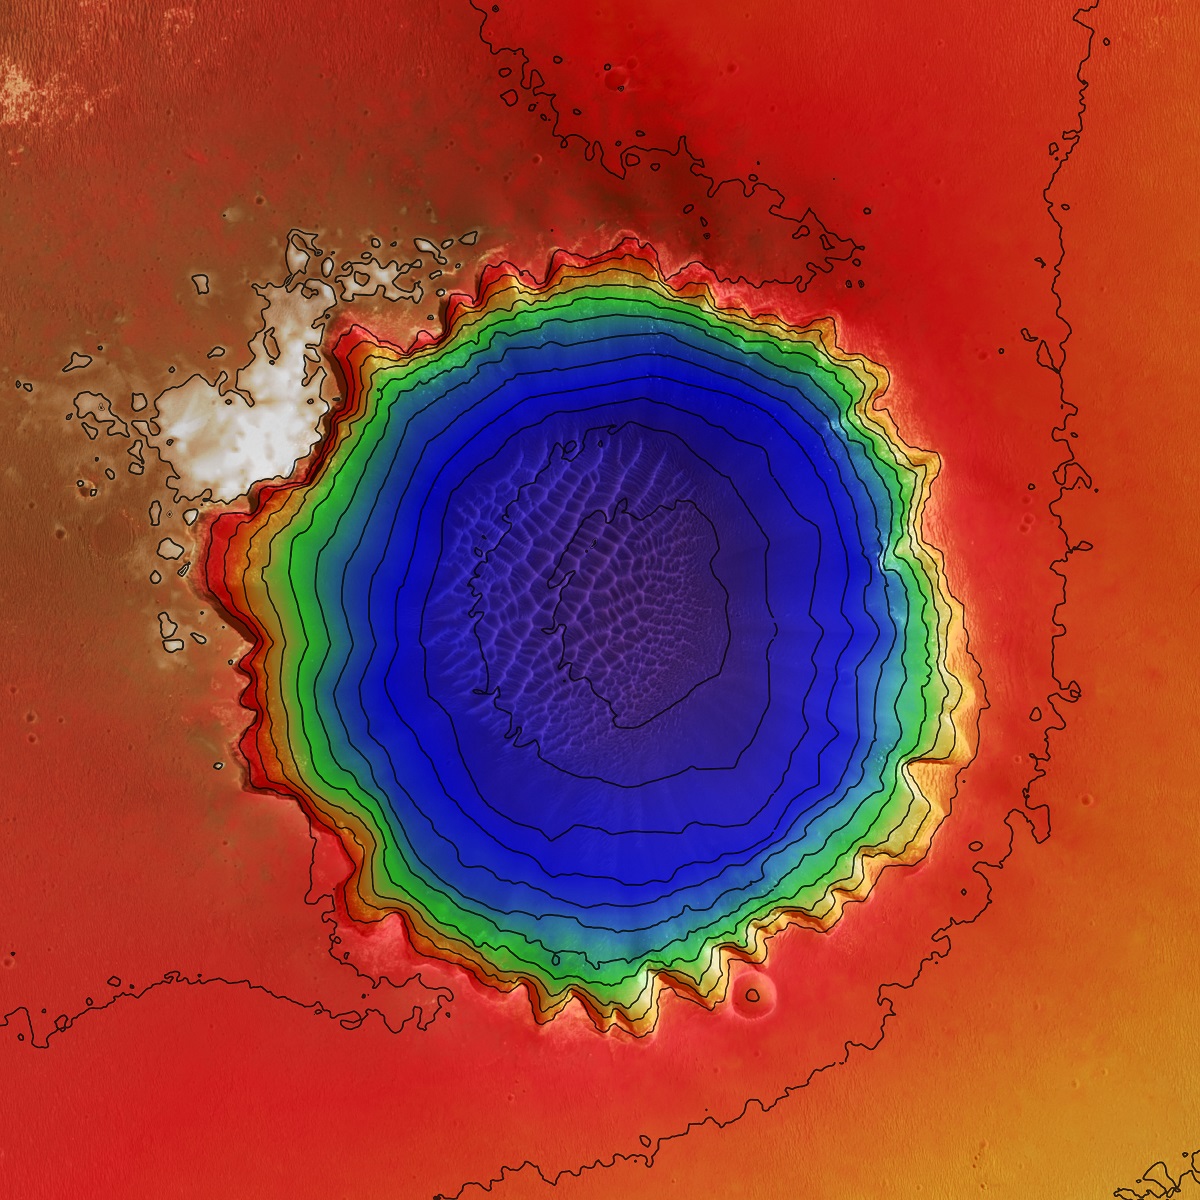
- Bathymetry: Bathymetry is the study of the depth and shape of the ocean floor. Bathymetric maps are similar to elevation maps, but instead of showing the height of the land, they show the depth of the ocean floor. Bathymetric maps are important for a variety of reasons, including understanding the movement of ocean currents, identifying the locations of undersea volcanoes and earthquakes, and mapping the locations of underwater habitats and ecosystems.
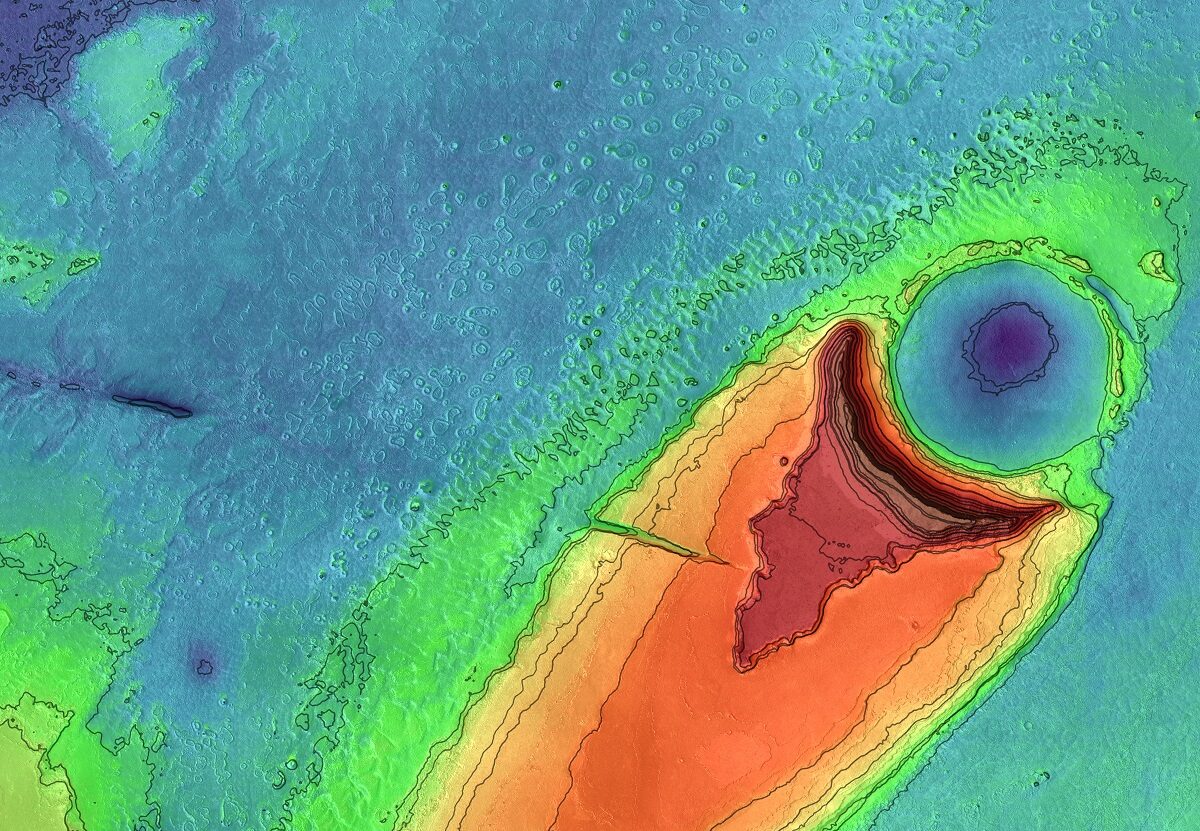
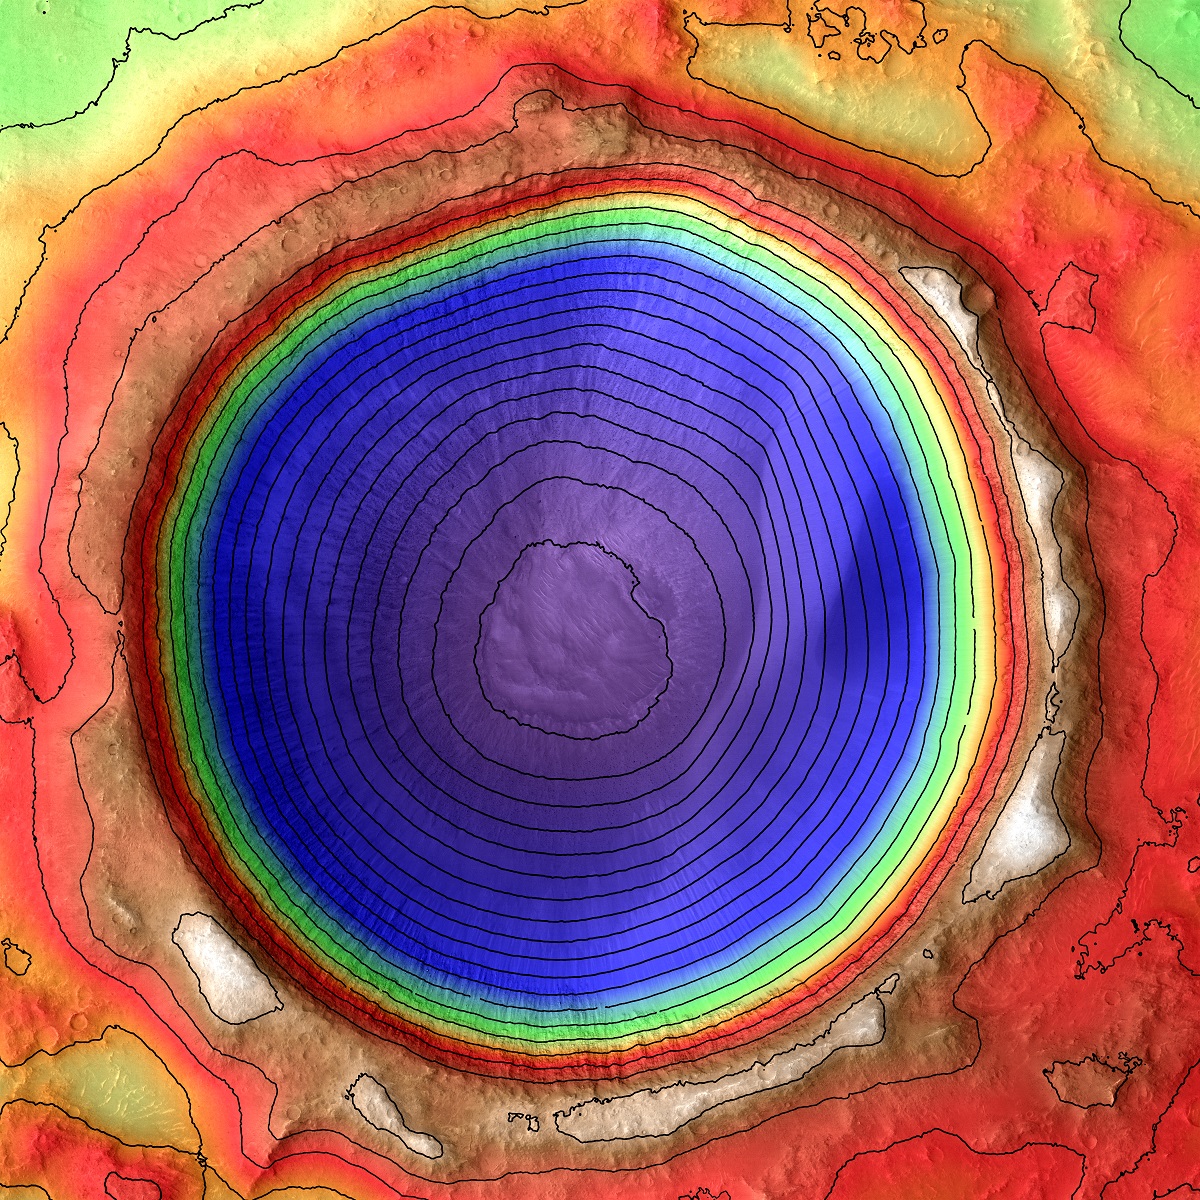
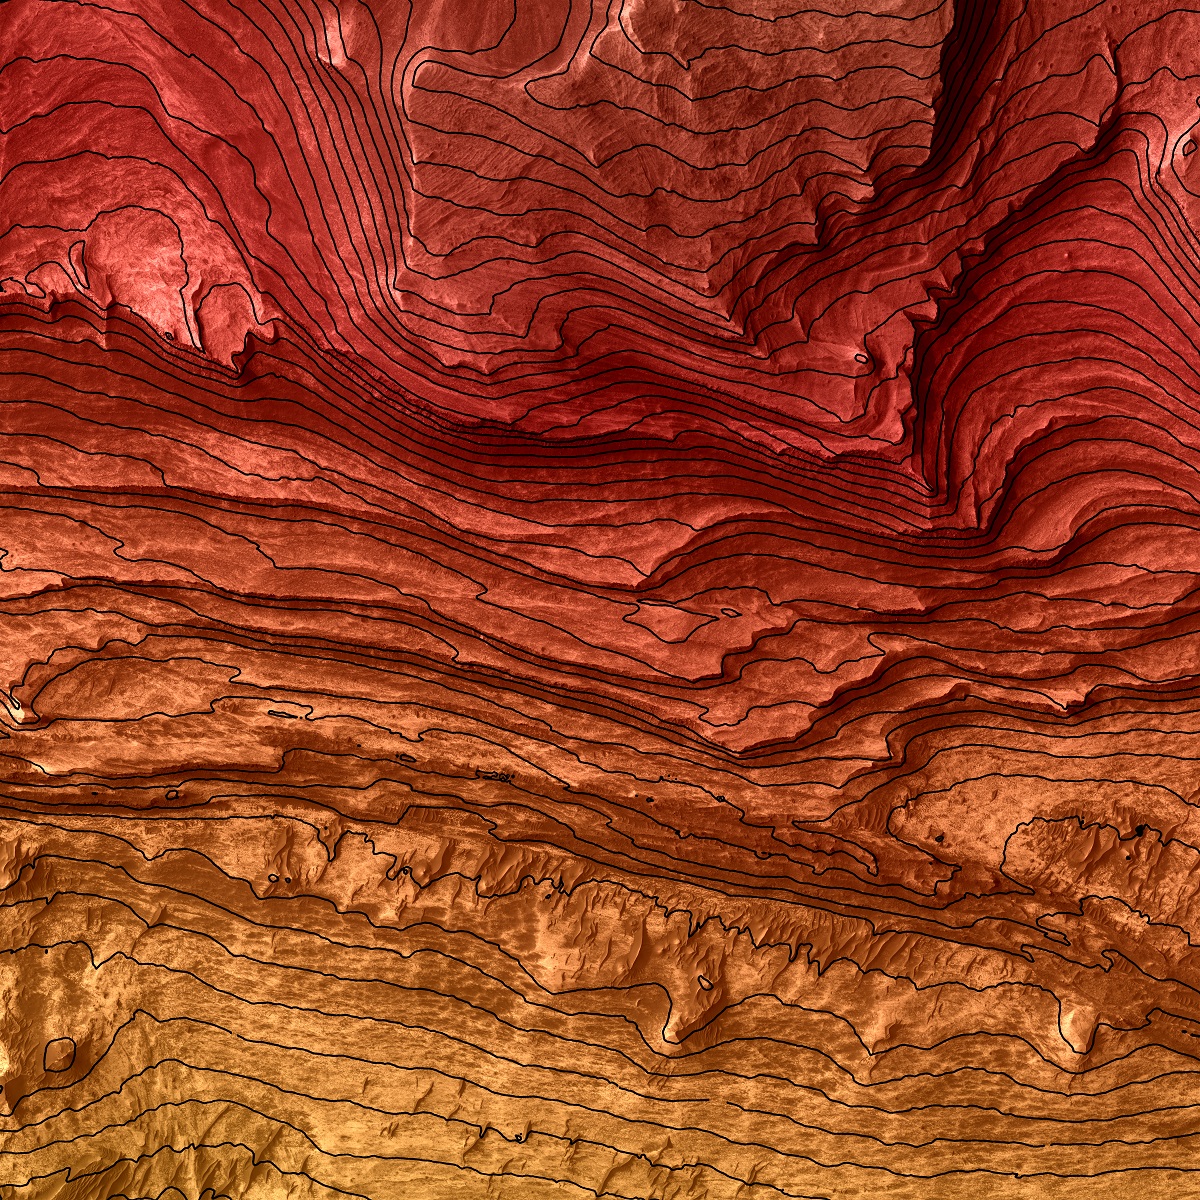
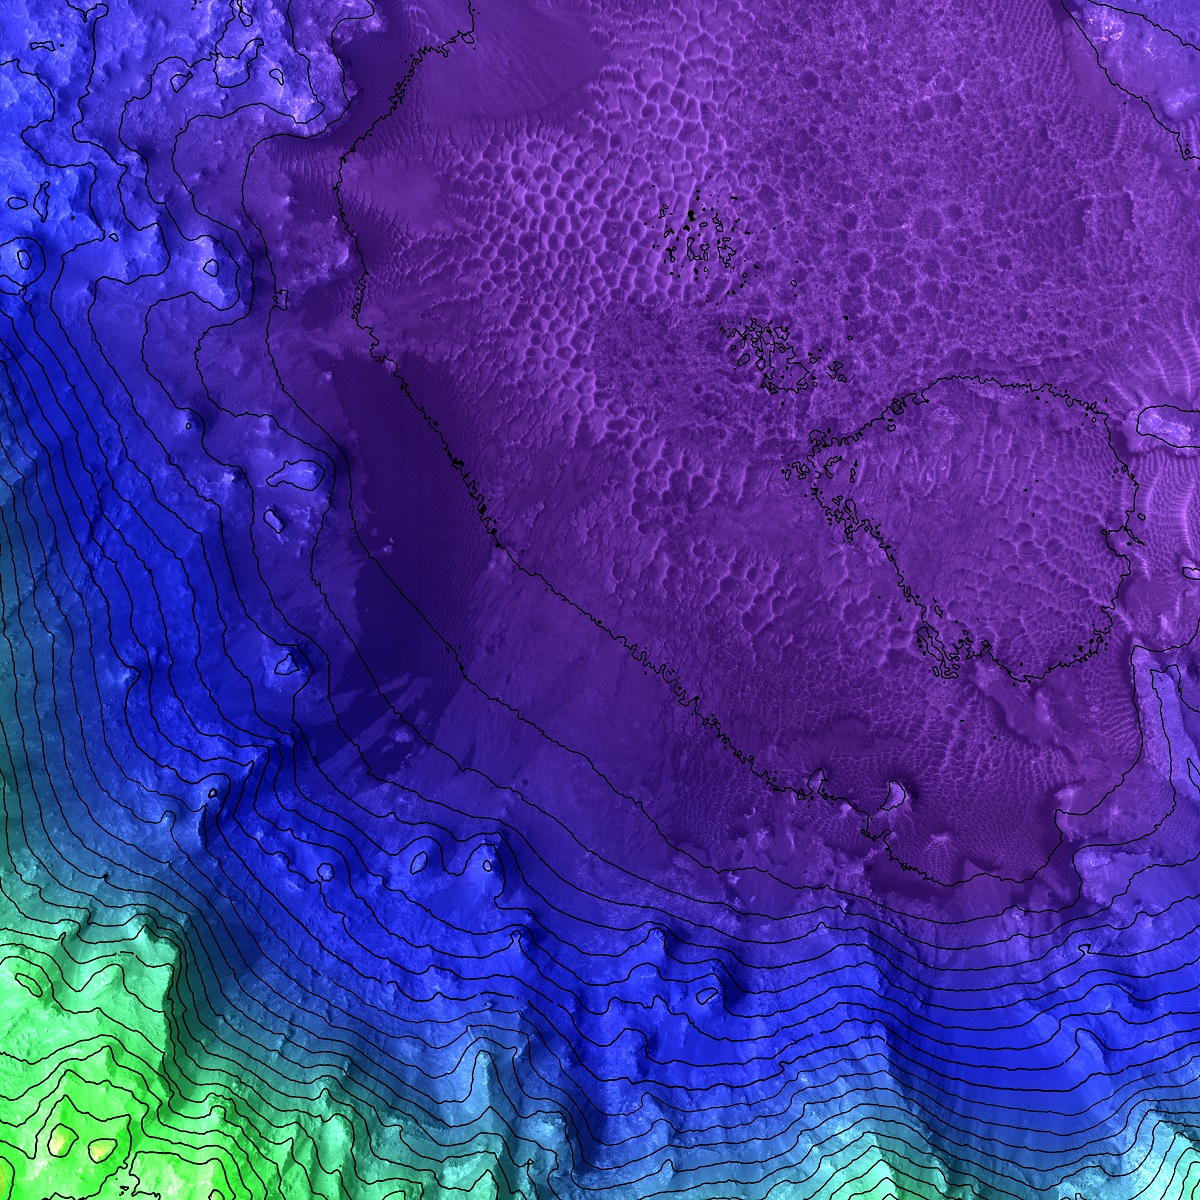
Sample Elevation Maps of Mars
Elevation maps have been around for centuries, and their uses and benefits have only grown with the advancement of technology. Here are some of the main ones:
- Weather Forecasting: Elevation maps have been used for centuries to predict weather patterns. By studying the elevation and topography of an area, meteorologists can predict how air masses will move, which can impact local weather patterns. This information is especially critical for predicting severe weather events like tornadoes and hurricanes, which can cause significant damage and loss of life.
- Designing Infrastructure: Elevation maps are essential for designing infrastructure like roads, bridges, and buildings. By studying the slope and elevation of the terrain, engineers can design structures that are safe and stable. Elevation maps can also help engineers identify potential hazards such as flood zones and areas prone to landslides. This information is especially important in areas prone to natural disasters, where building codes and designs must be adapted to withstand extreme weather events.
- Natural Resource Management: Elevation maps are also critical for managing natural resources like water, forests, and wildlife. By studying the elevation and topography of an area, environmental scientists can understand how water flows, where it collects, and how it interacts with the surrounding landscape. This information is essential for developing conservation strategies that protect fragile ecosystems and ensure a reliable water supply.
- Outdoor Recreation: Elevation maps are a valuable tool for outdoor enthusiasts like hikers, climbers, and bikers. By studying the map, adventurers can plan their routes, predict the steepness of the terrain, and identify landmarks like peaks and valleys. Elevation maps can also help hikers avoid potential hazards like steep cliffs and areas prone to rockslides. This information is especially critical for backcountry trips where there may be no other means of navigation.
- Geological Research: Elevation maps are also an essential tool for geologists studying the Earth’s crust. By studying the elevation and topography of an area, geologists can understand how mountains form, how tectonic plates move, and how earthquakes occur. This information is critical for predicting seismic activity and developing early warning systems.
- Urban Planning: Elevation maps are an essential tool for urban planners designing cities and communities. By studying the slope and elevation of the terrain, planners can identify areas prone to flooding and landslides, and develop plans that mitigate these risks. Elevation maps can also help planners identify areas with desirable views, which can influence land use and zoning decisions.
- Navigation: Elevationon maps are an essential tool for navigation. By understanding the shape and height of the terrain, pilots can navigate through mountains and other natural obstacles, and sailors can navigate through coastal waters.
- Environmental Science: Elevation maps are an essential tool for environmental scientists, who use them to study and understand the relationship between the Earth’s surface and the environment. For example, elevation maps can be used to identify watersheds, which are areas of land that drain into a particular body of water. By analyzing the elevation and slope of the terrain, environmental scientists can predict how water will flow and where it will collect, which is important for managing water resources and preventing floods.
- Tourism: Elevation maps are a popular tool for tourism, particularly in mountainous regions or areas with scenic overlooks. Tourists can use elevation maps to identify popular hiking trails or scenic routes, and hypsometric tinting can be used to highlight important features such as mountains and valleys. Elevation maps can also be used to create 3D maps and virtual reality experiences, which can give tourists a realistic and immersive view of the landscape.
- Military and Defense: Elevation maps are a critical tool for the military and defense industries, who use them to plan military operations and identify potential threats. By understanding the topography of the land, military strategists can plan their movements and identify areas of cover and concealment. Elevation maps can also be used to identify potential hazards such as steep terrain or water obstacles, which can pose a danger to military vehicles and personnel.
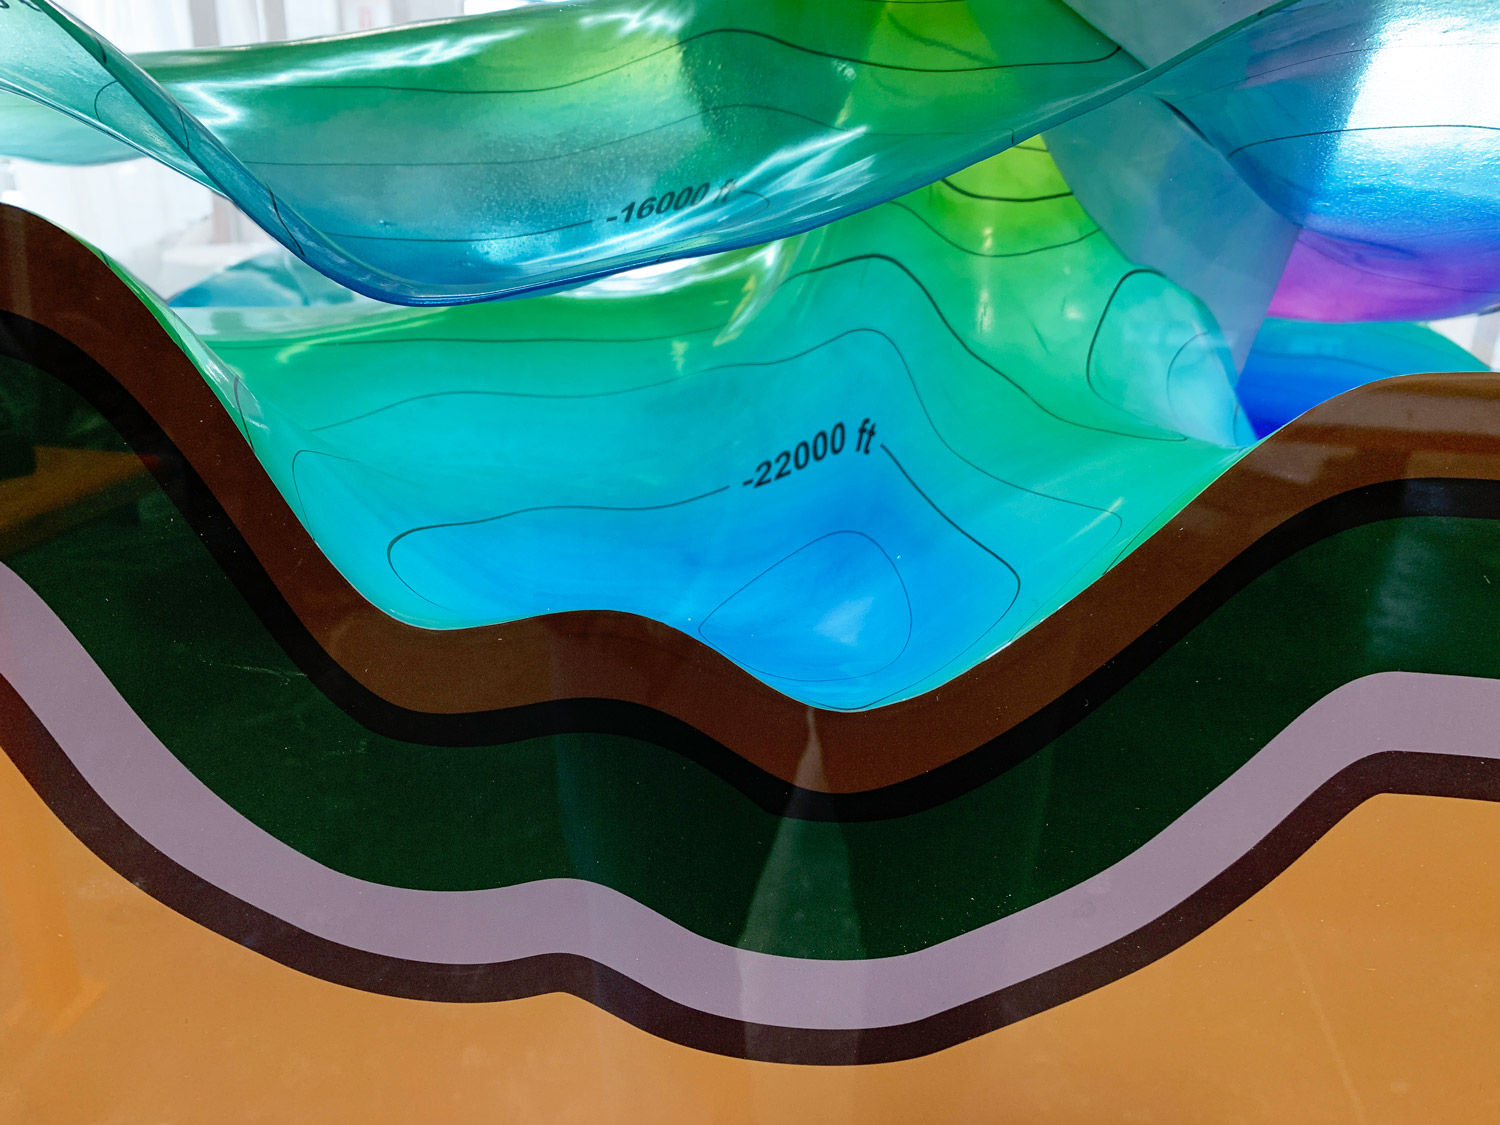
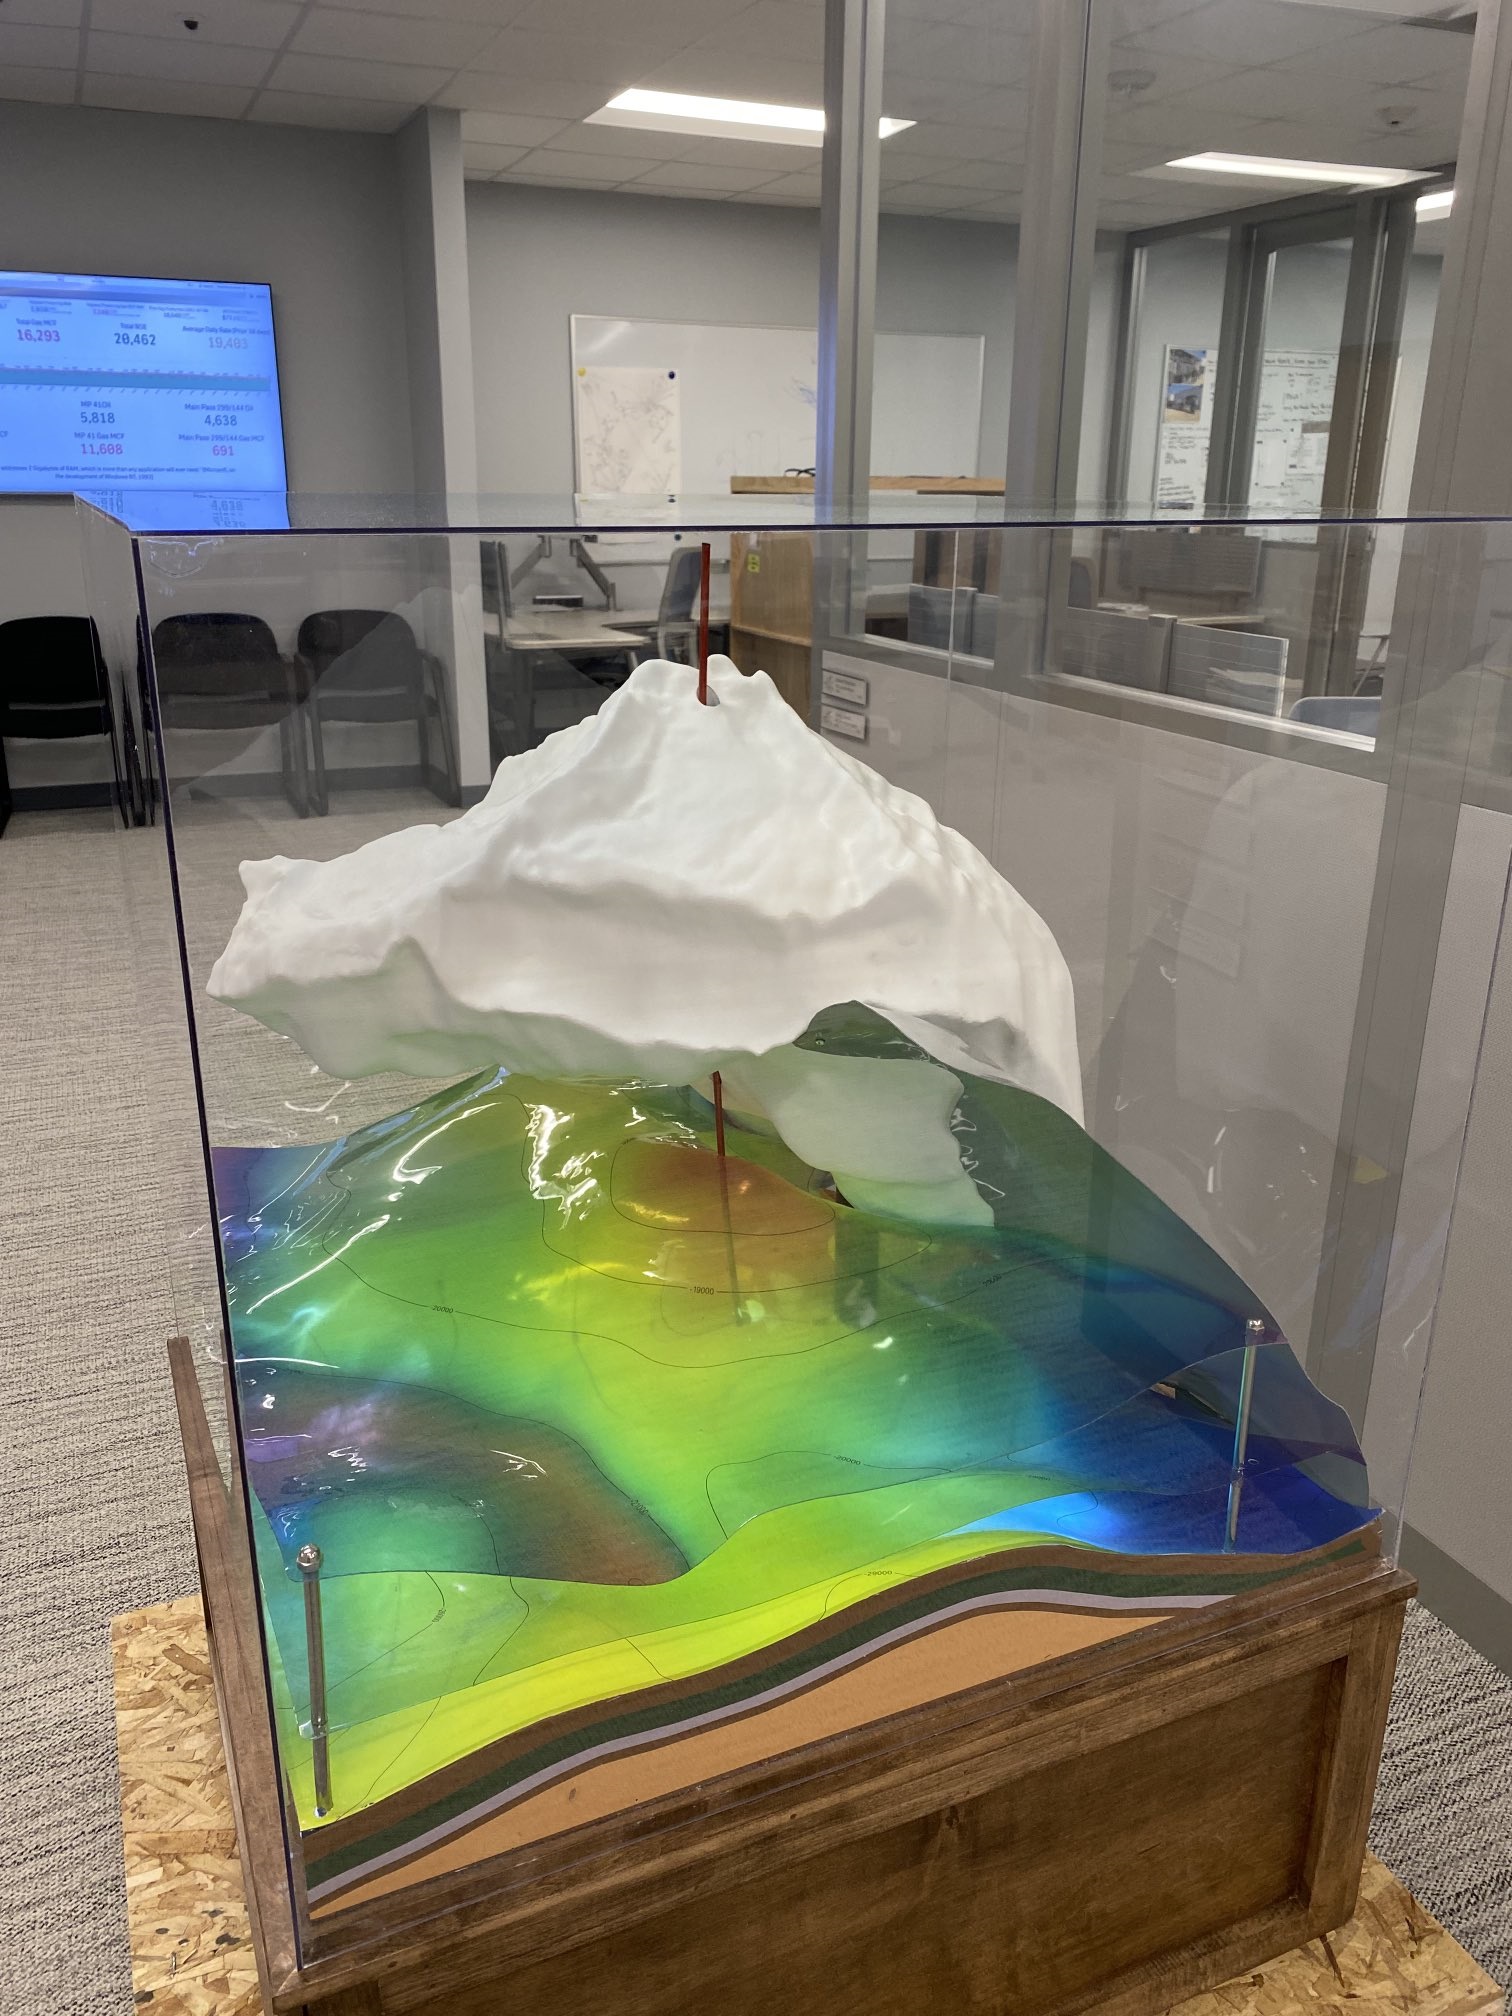
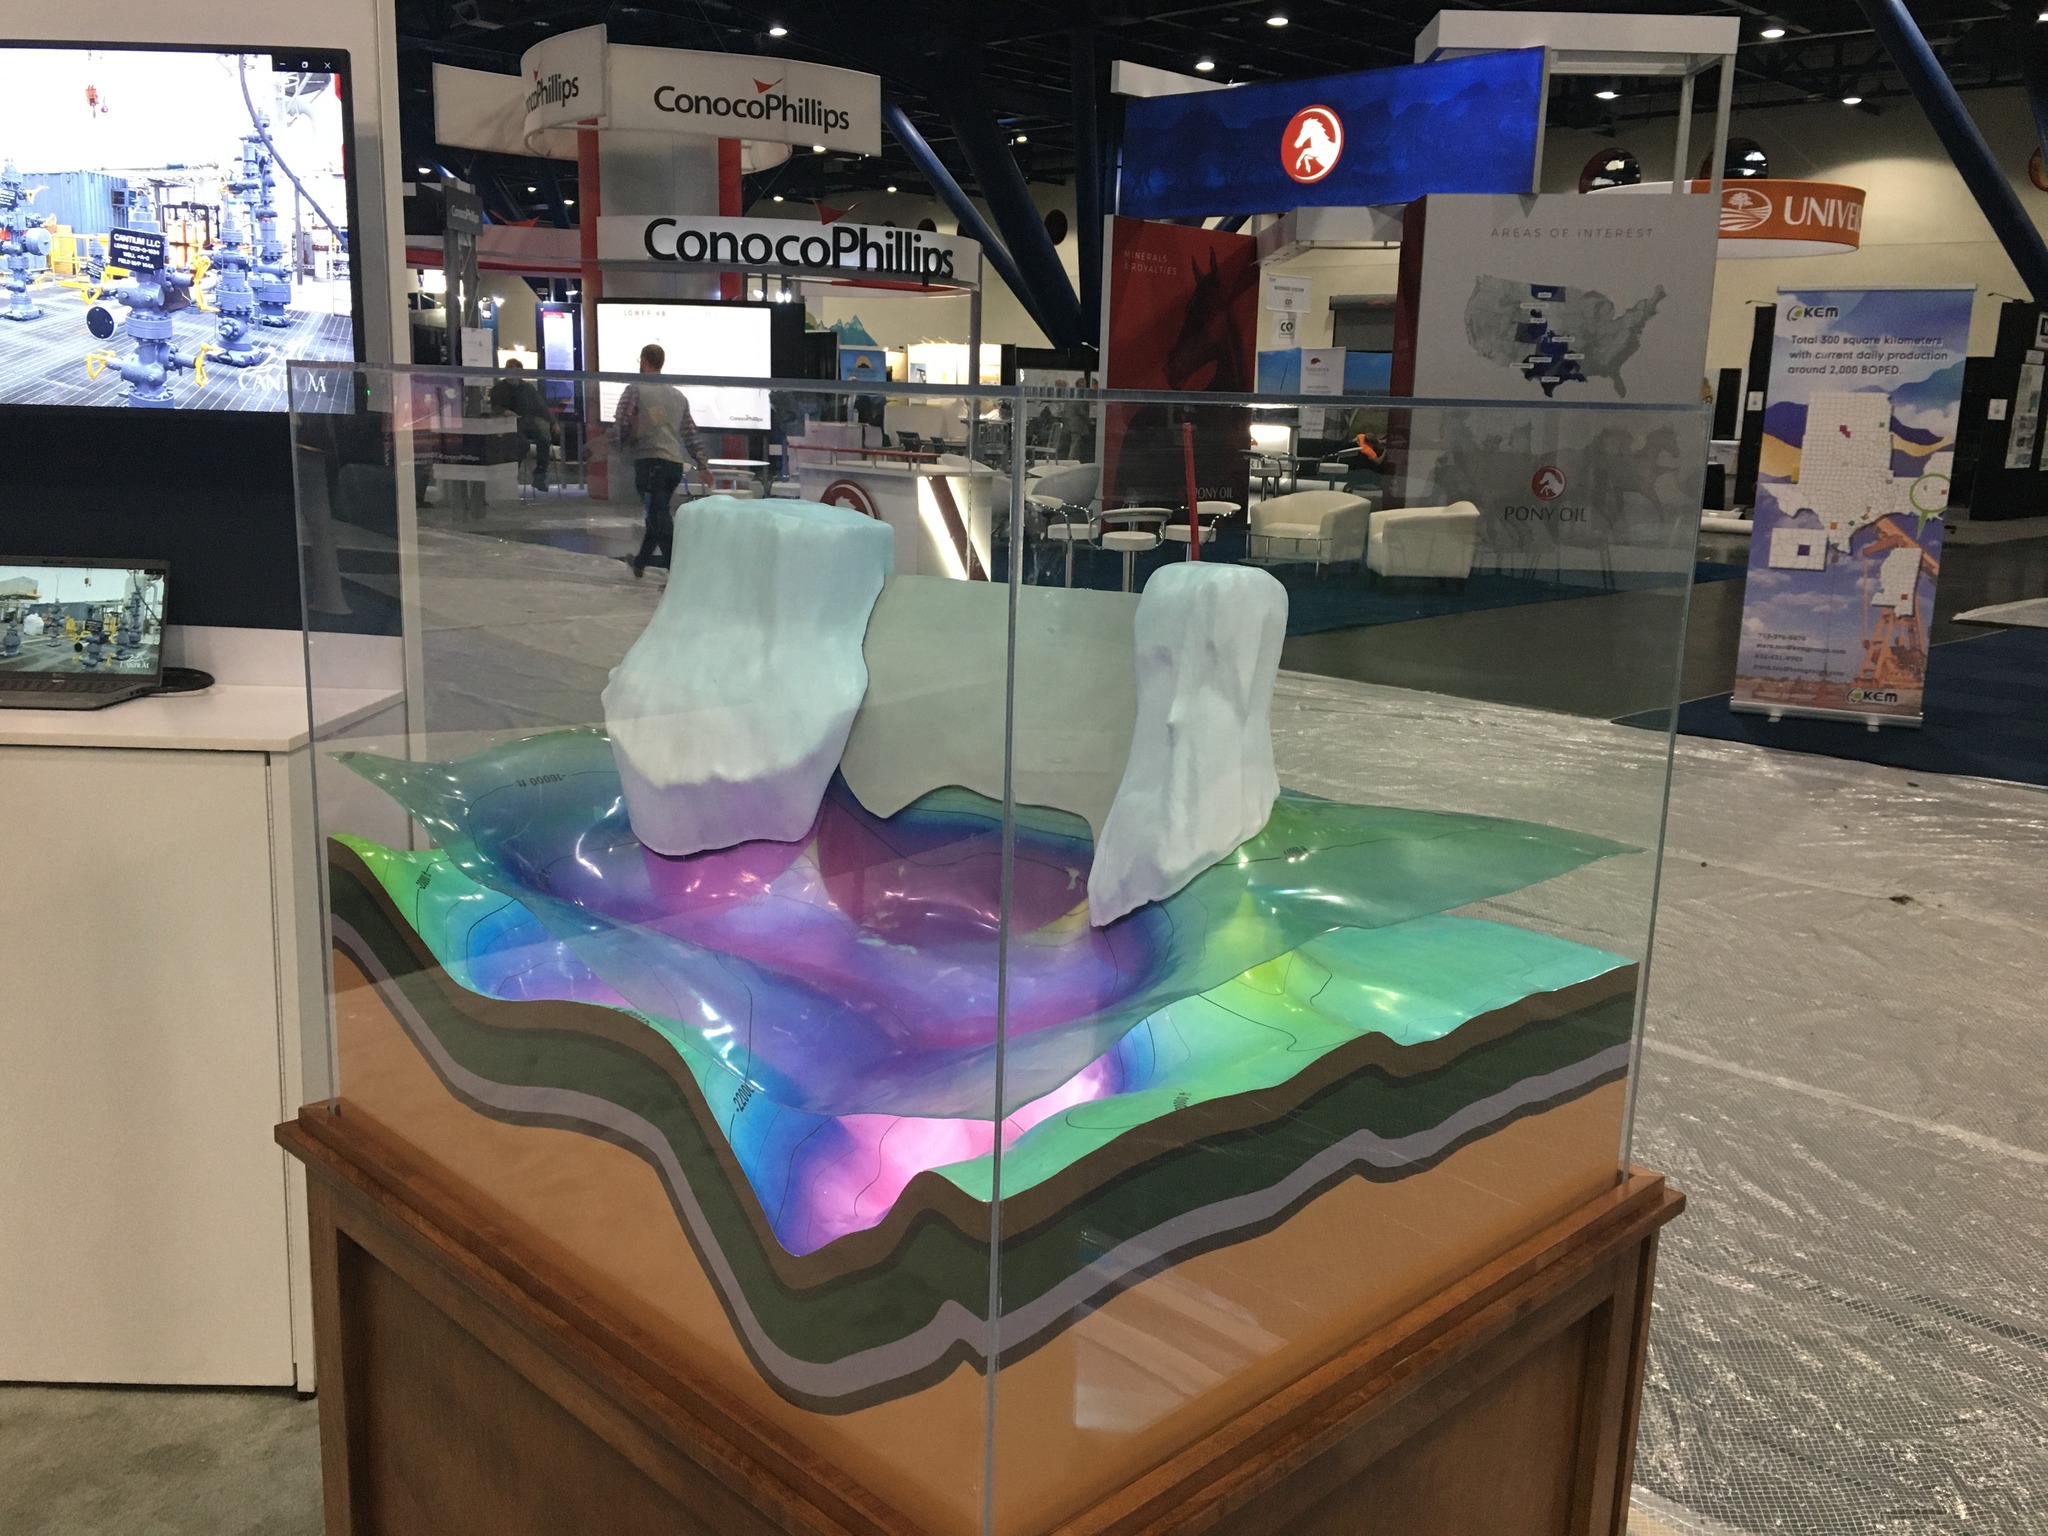
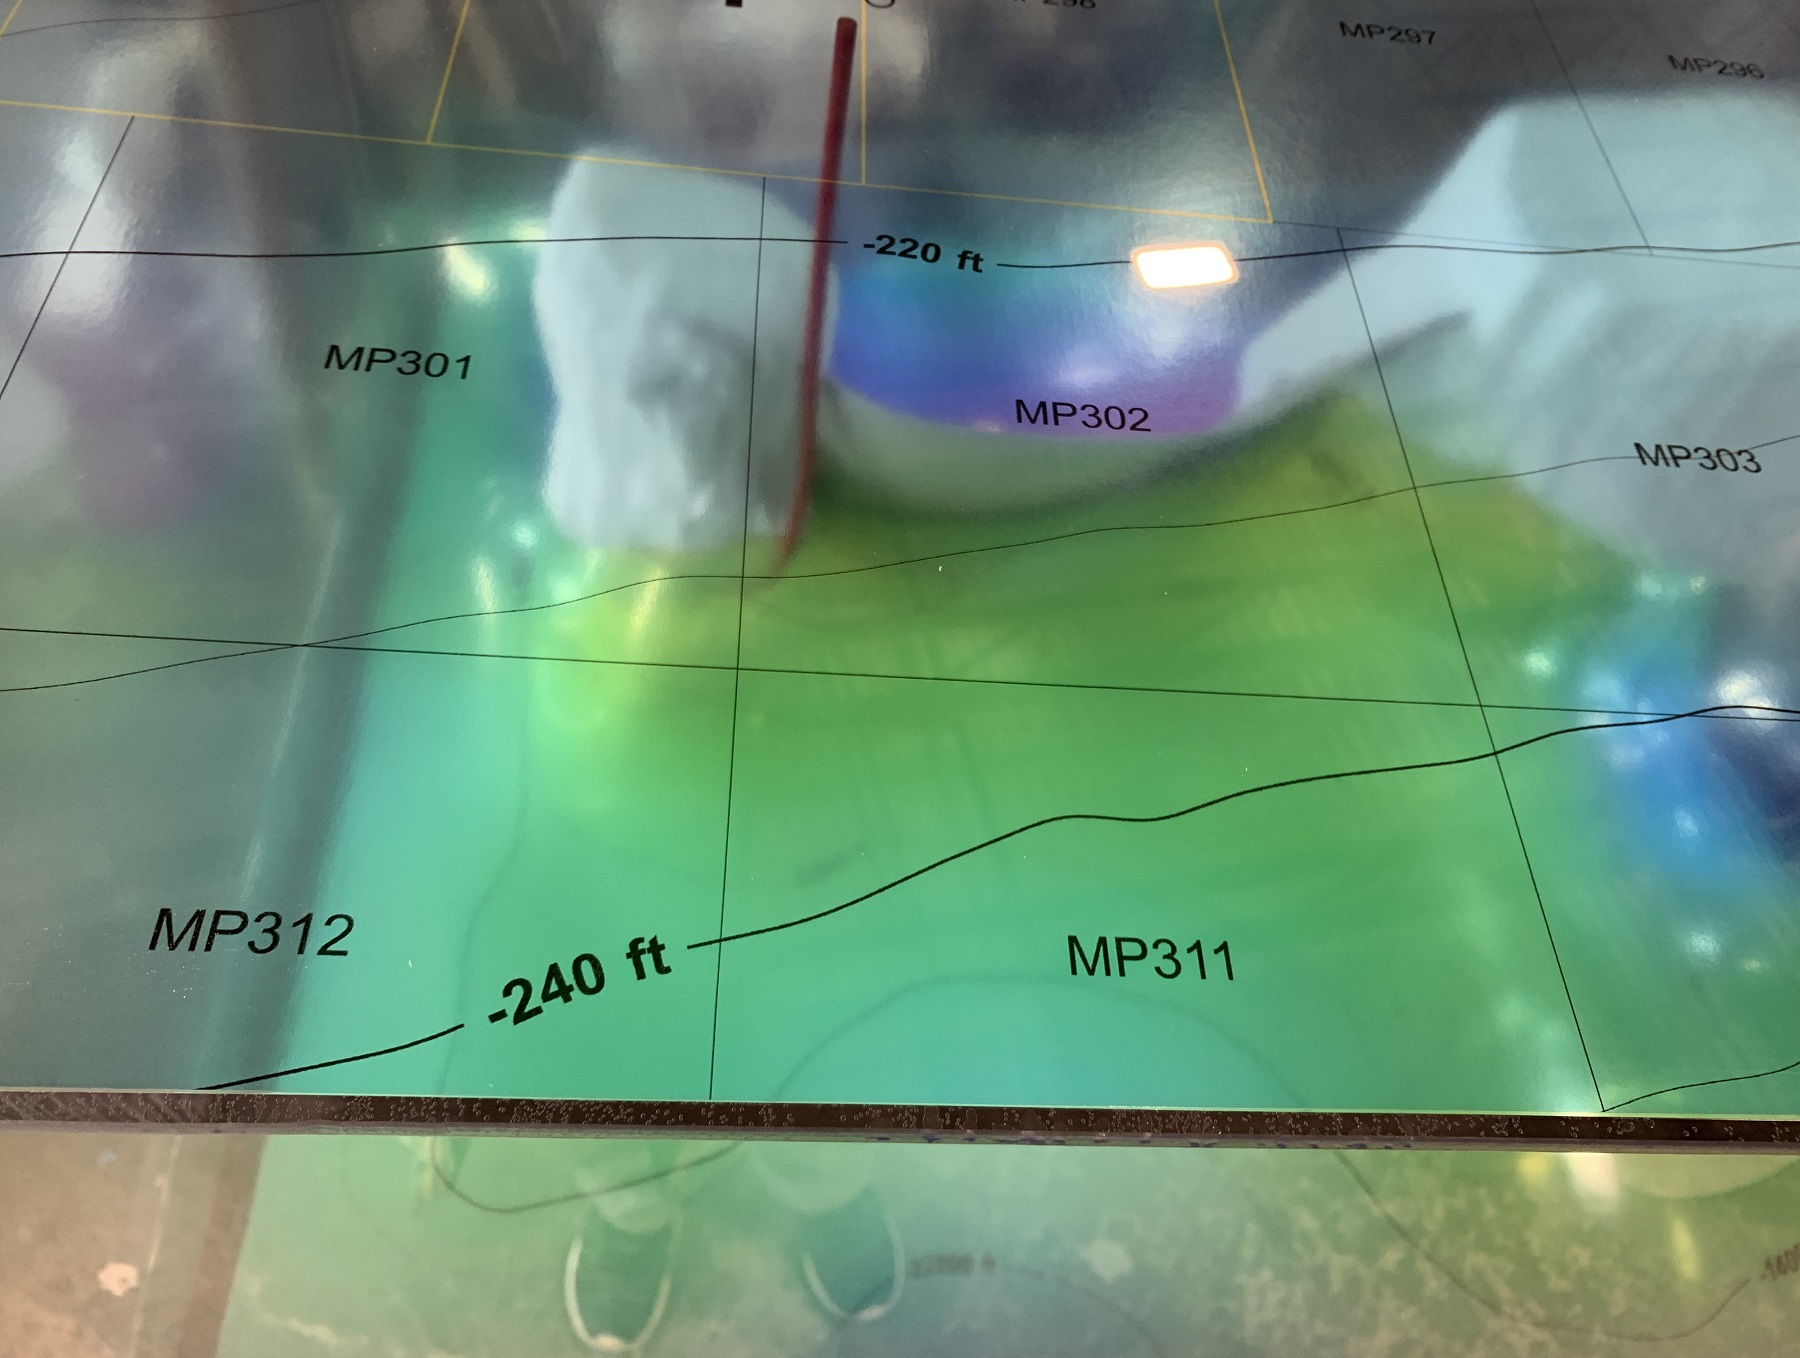
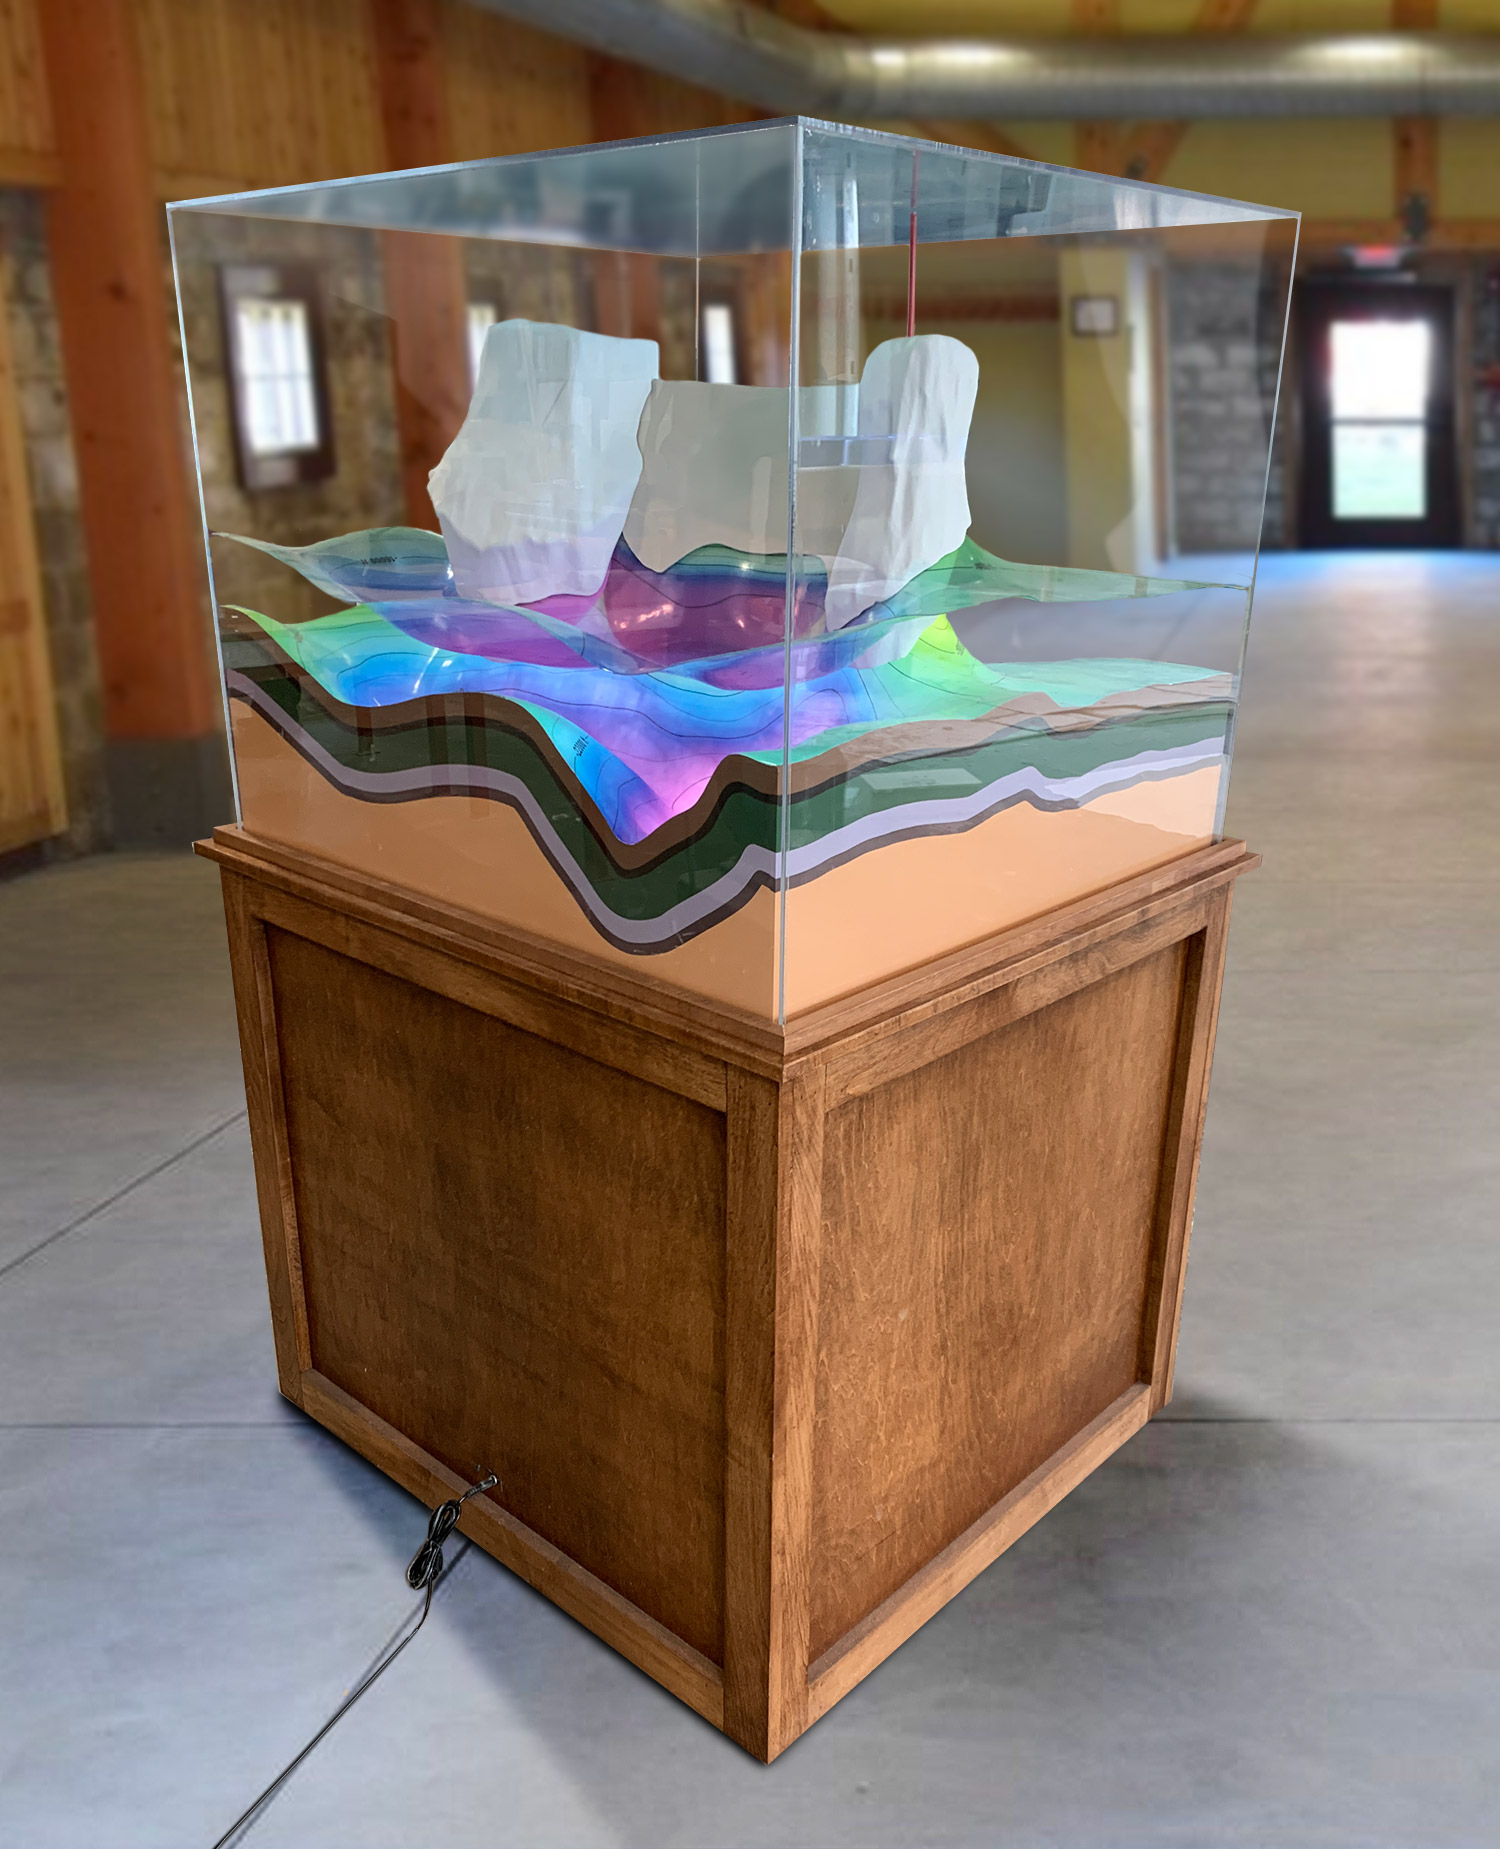
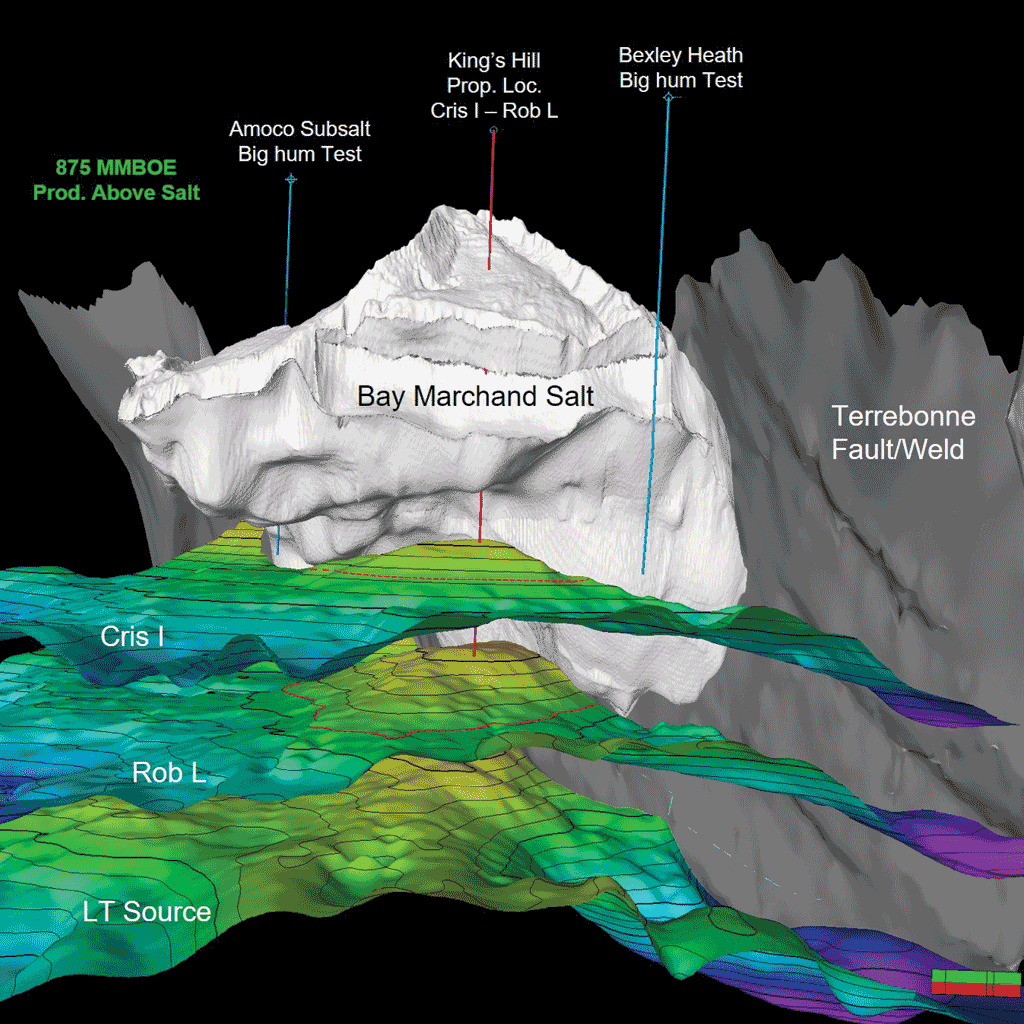
Sample 3D Elevation/Contour Maps of Geologic Salt Blocks-Domes
Elevation maps are not just pretty pictures of mountains and valleys; they are a crucial tool for scientists, engineers, hikers, and anyone who wants to understand and explore the Earth’s surface. There are exciting benefits of elevation maps and how they can help us understand and appreciate the natural world:
- Understanding the Earth’s Surface: Elevation maps provide a detailed and accurate representation of the Earth’s surface. By studying the contour lines on the map, we can understand the shape, height, and slope of the terrain. This information is essential for understanding how the land affects the environment, from the flow of water to the distribution of vegetation.
- Planning Hiking and Outdoor Activities: Elevation maps are a valuable tool for hikers, campers, and anyone who loves spending time in nature. By studying the map, we can plan our routes, predict the steepness of the terrain, and identify landmarks such as mountains and lakes. Elevation maps can also help us avoid potential hazards such as steep cliffs and areas prone to rockslides.
- Designing Infrastructure: Elevation maps are an essential tool for engineers and architects who design roads, bridges, buildings, and other structures. By understanding the slope and elevation of the terrain, engineers can design structures that are safe and stable. Elevation maps can also help engineers identify potential hazards such as flood zones and areas prone to landslides.
- Managing Water Resources: Elevation maps are a valuable tool for managing water resources, from rivers and lakes to groundwater. By studying the elevation and slope of the terrain, hydrologists can predict how water will flow and where it will collect. This information is critical for managing water resources, preventing floods, and ensuring a reliable water supply.
- Predicting Natural Disasters: Elevation maps can also help us predict natural disasters such as floods, landslides, and volcanic eruptions. By studying the elevation and slope of the terrain, geologists can identify areas that are prone to these types of disasters. This information is essential for developing early warning systems and evacuating people from high-risk areas.
- Exploring the Planet: Elevation maps are a fascinating way to explore the planet, from the highest peaks to the deepest ocean trenches. By studying elevation maps, we can appreciate the diversity and beauty of the Earth’s surface. We can also use elevation maps to plan our travels, whether we are hiking in the mountains or exploring the depths of the ocean.
- Understanding Climate Change: Elevation maps are a crucial tool for understanding the impact of climate change on the Earth’s surface. By studying the elevation and slope of the terrain, scientists can predict how climate change will affect the distribution of water resources, vegetation, and wildlife. This information is essential for developing strategies to mitigate the effects of climate change and protect the environment.
Elevation maps are a valuable tool for understanding and exploring the Earth’s surface. They provide critical information for managing water resources, designing infrastructure, predicting natural disasters, and understanding the impact of climate change. Elevation maps also help us appreciate the beauty and diversity of the planet, from the highest peaks to the deepest ocean trenches. Whether you are a scientist, engineer, hiker, or adventurer, elevation maps are an essential tool for exploring and appreciating the natural world.
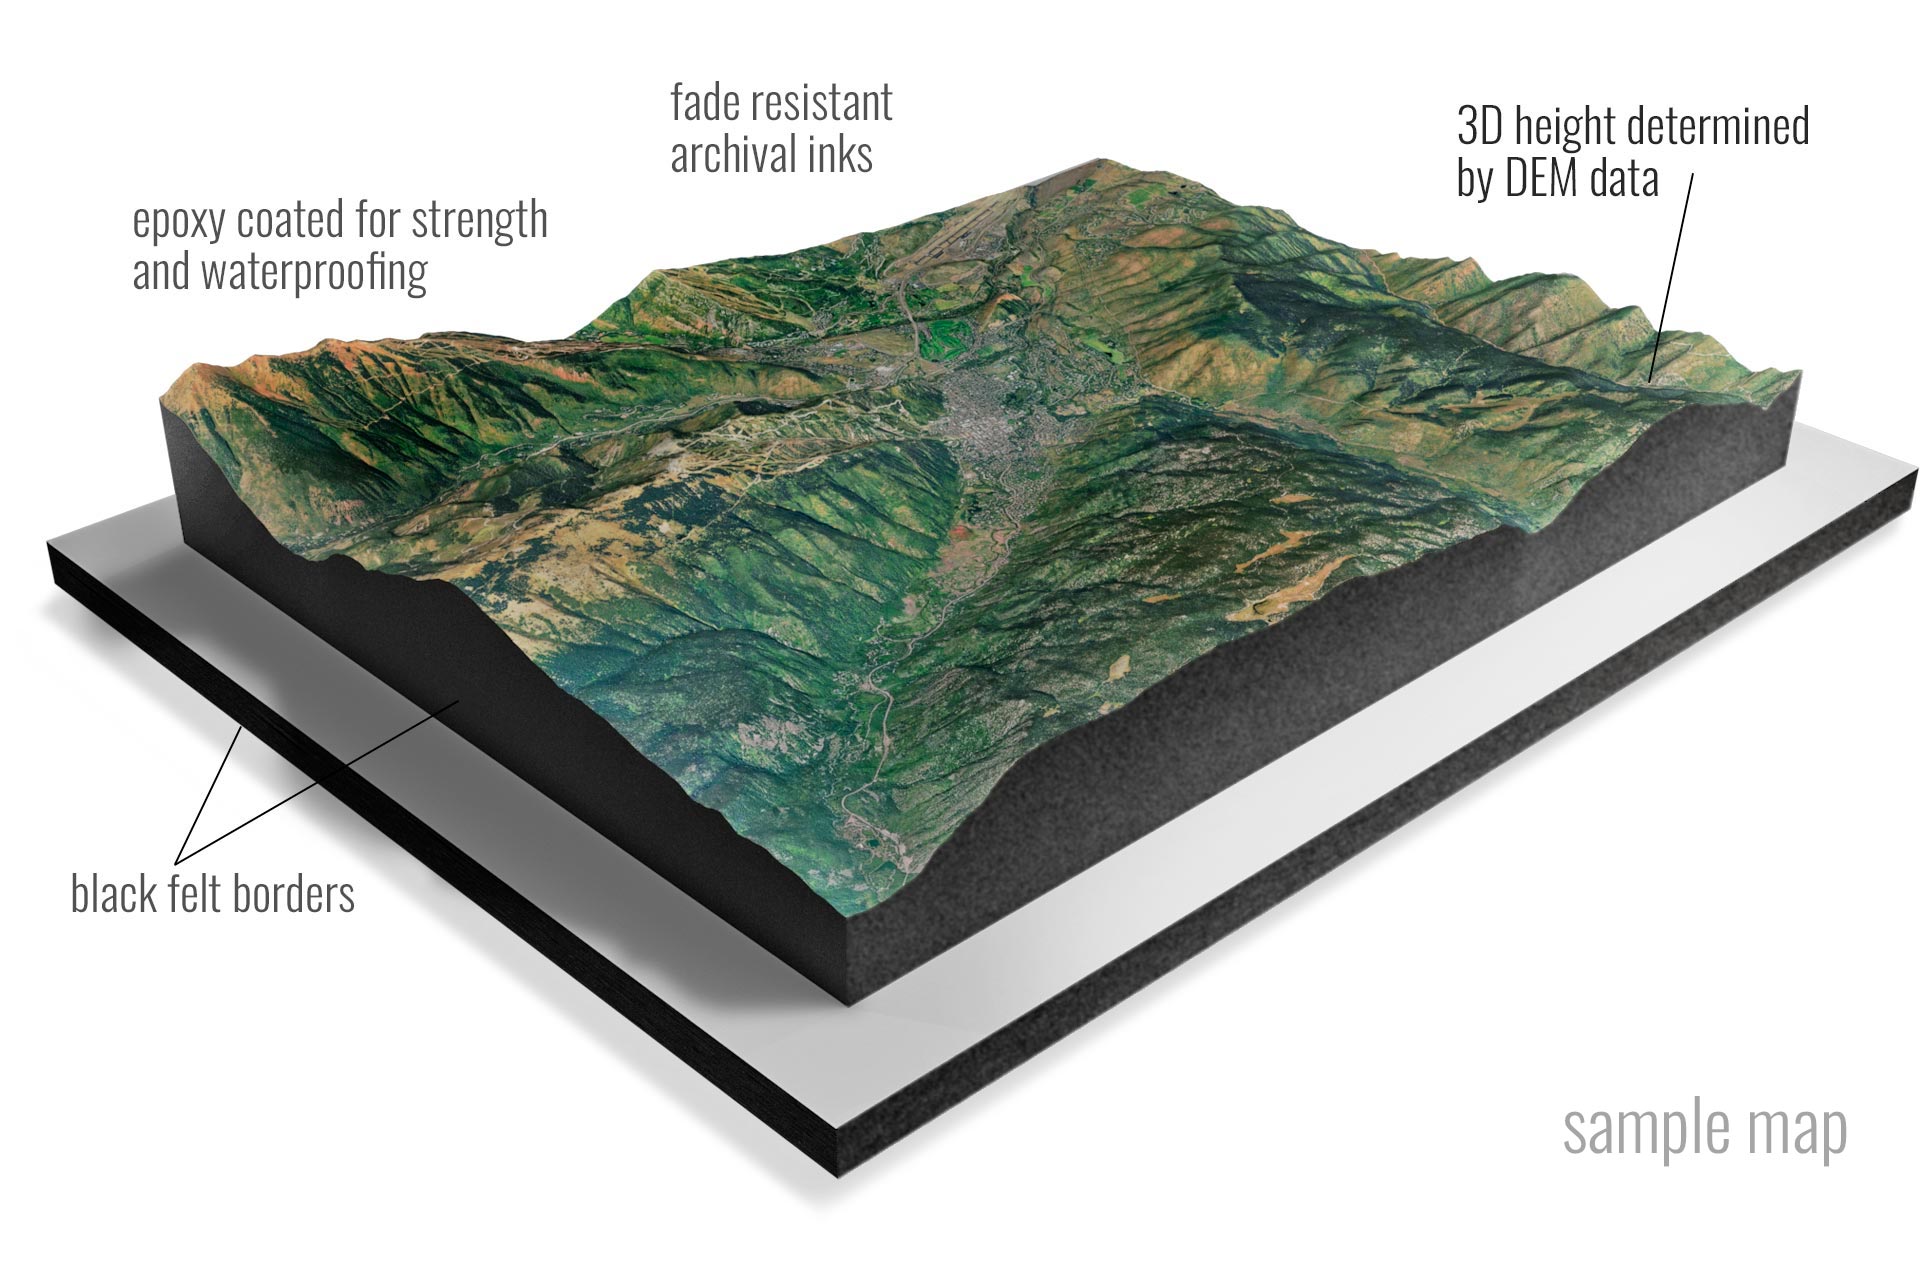
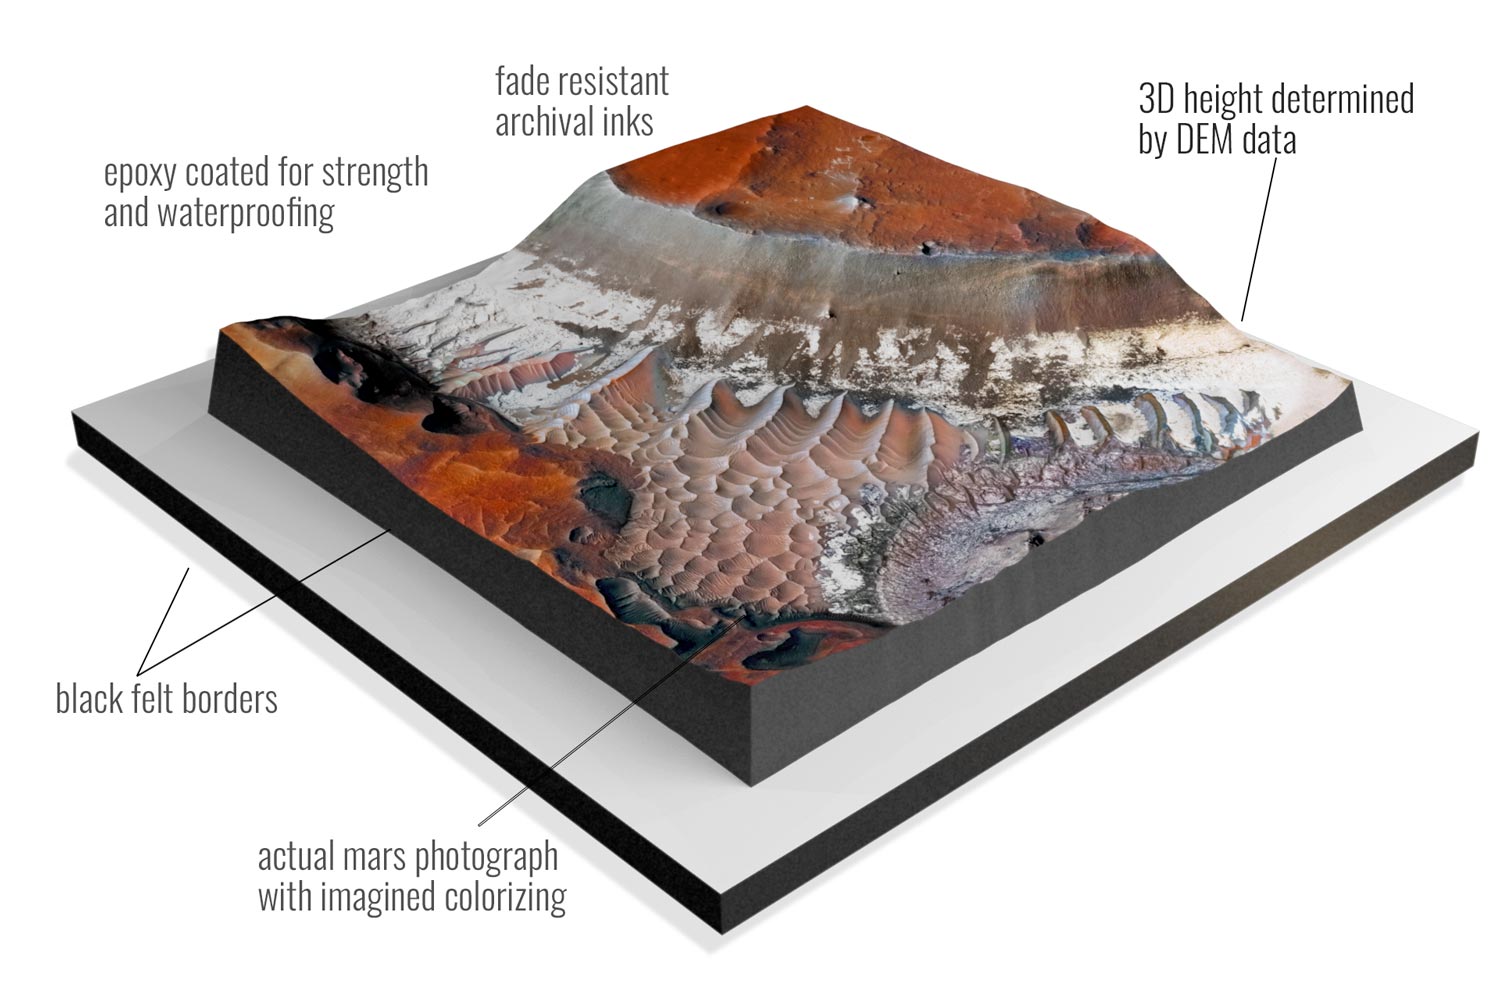
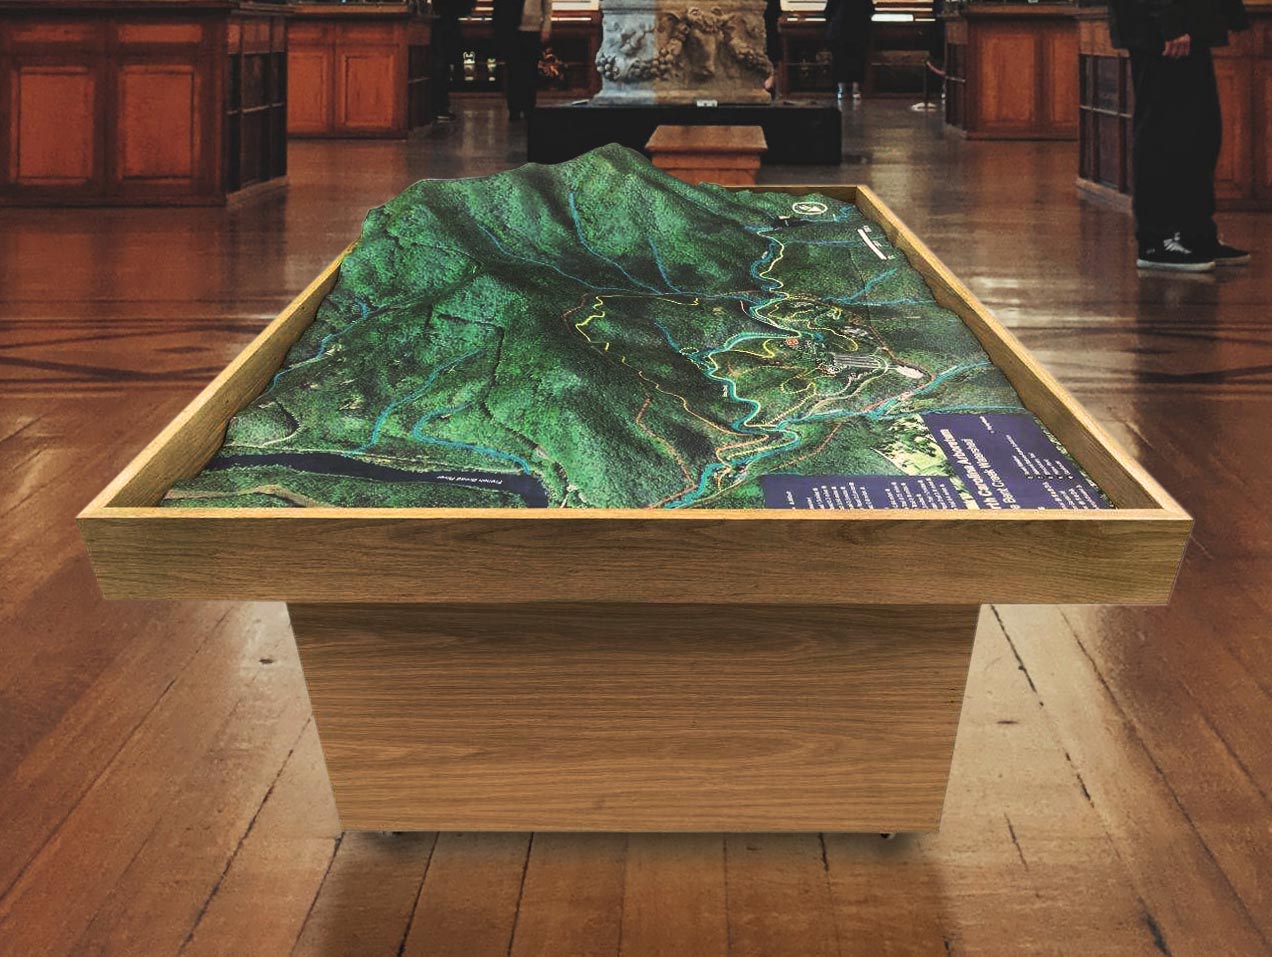
Our high-quality maps and models are on display at museums, national parks, university campuses, sports facilities, hospitals, and research organizations worldwide. One of our more recent raised relief projects was of the Great Smoky Mountains National Park and the surrounding area. This large raised relief map covered over 1.2 million acres in a 91″ x 56″ frame.
We meld top-of-the-line technologies with professional cartography resources to create stunning elevation maps and models. Our expertise in 3D printing enables us to allow more markets to benefit from purchasing durable, portable, and affordable models.
Sample Canvas Print Elevation Maps
Shop WhiteClouds Elevation Maps called Marscapes. 2D and 3D Custom Maps available.
Gallery of Custom 3D Map Projects
How 3D Elevation Maps are Made
There are several techniques used to create elevation maps, and the process can vary depending on the scale and complexity of the map. However, the basic steps involved in making an elevation map are as follows:
- Create a base map. The first step in making an elevation map is to create a base map of the area. This can be done using imagery from a standard two-dimensional map, aerial photographs, satellite images, or WhiteClouds can do it for you.
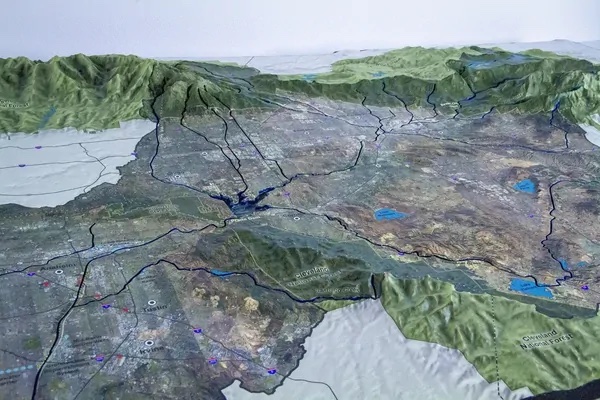
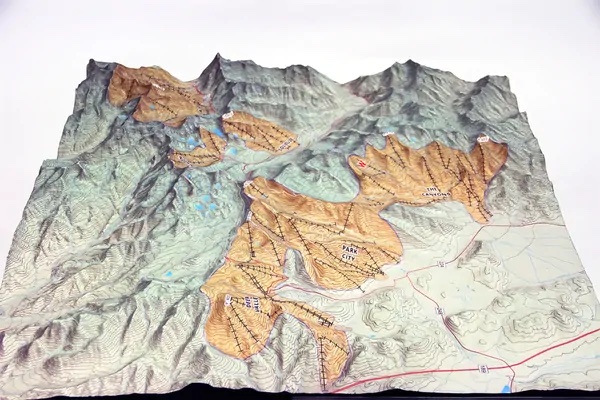
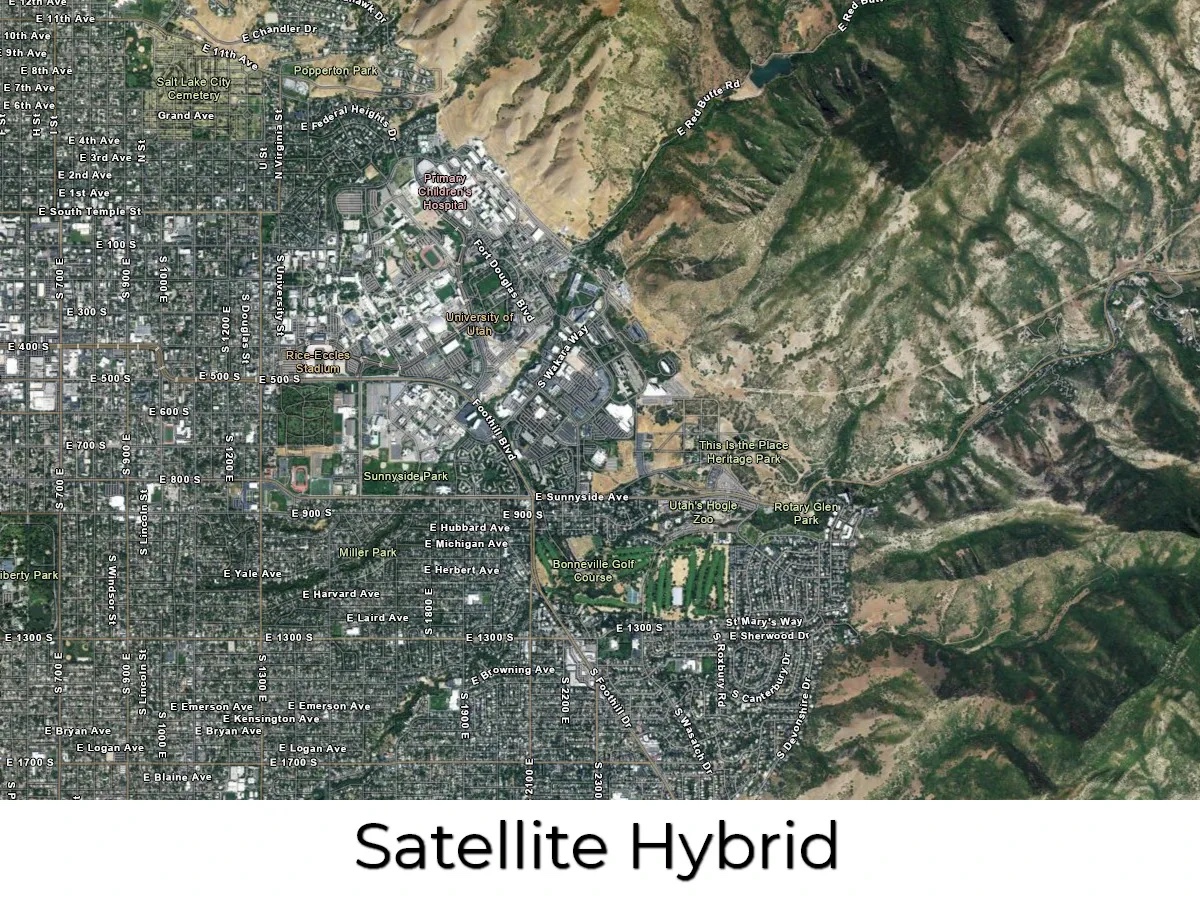
- Determine the design style of the map. There are over 40 styles to choose from. Popular ones include satellite, terrain, topography, raised relief, and satellite hybrid.
- Add any special design features not included in the source map, such as special features, landmarks, legends, roads, cities, symbols, etc.
- Add elevation data. The next step is to add elevation data to the map. This can be done using a variety of techniques, such as contour lines, shading, or digital elevation models (DEMs).
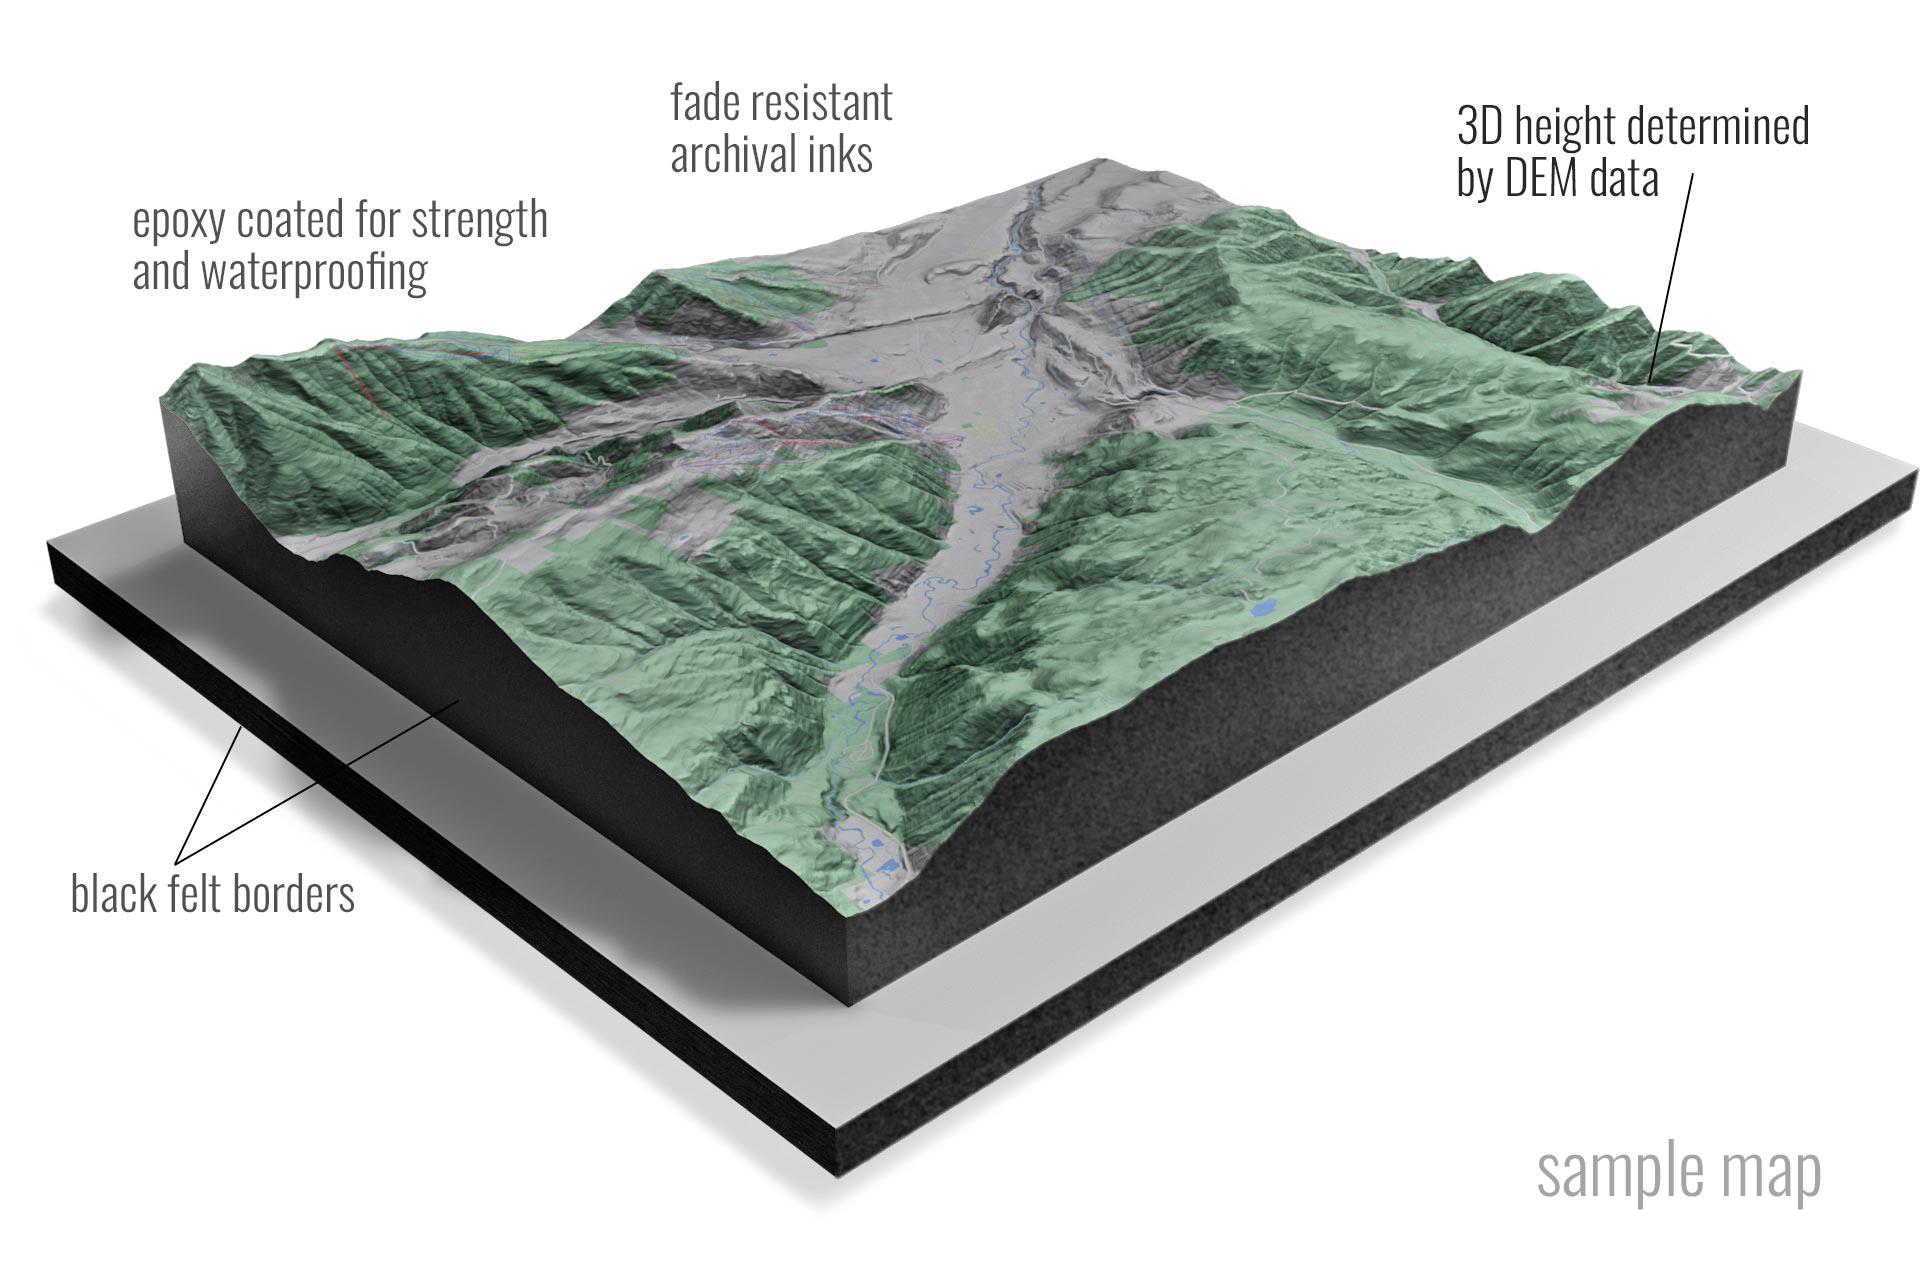
- Print the Map Overlay. Latex vinyl materials are used for the map details and colors.
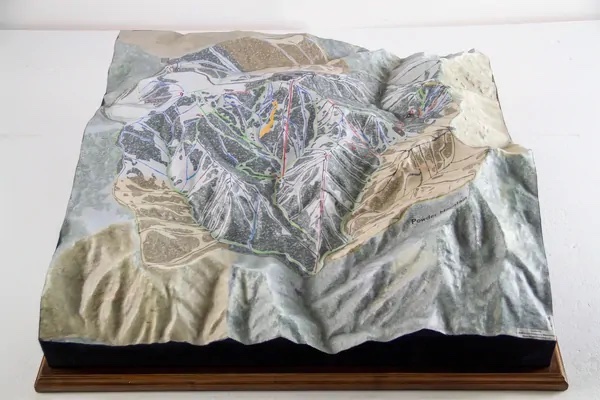
- Create the 3D physical map. Once the elevation data has been added to the map, a physical 3D structure is created that replicates the topography of the area. This can be done using 3D printed plastic or thermoformed molding/casting. Either approach is combined with the Vinyl overlay.
- Finish the map. This is where any excess materials are cutaway. Any special sealers, matte finishes, hardeners, or UV protection is applied. Wood, metal or plastic bases are built and border flocking may be applied.
Features & Benefits of Elevation Maps
- Remarkably Strong: You can drive a 1-ton truck over our elevation maps.
- Precision: We print our elevation maps to scale as accurately as are the original files and images.
- Excitement: It is much easier to get excited about 3D views of your ski runs or trails than flat printed maps.
- Stain and Water Resistance: Spills are easy to wipe up.
- Communication: Elevation maps are simple to understand with a quick glance.
- Affordability: Our 3D technologies allow you to order custom 3D maps for a reasonable price.
- Testability: 3D technologies are affordable enough to test designs, such as several versions of planned work.
- Consistency: Using modern print and casting technologies, you can easily recreate identical 3D maps.
- Portability: We use lighter materials than what was available in the past, making our elevation maps easy to transport.
Videos of 3D Maps
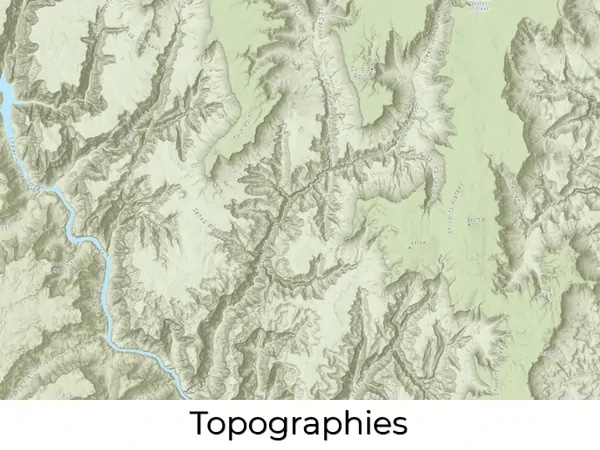
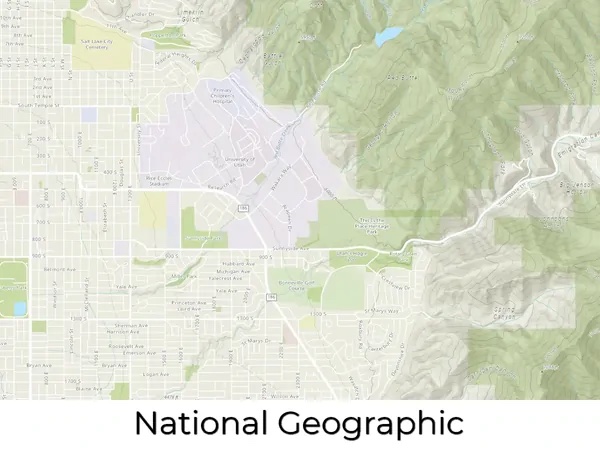
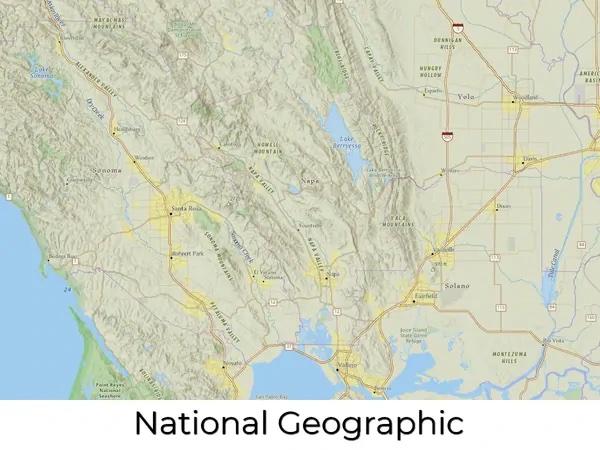
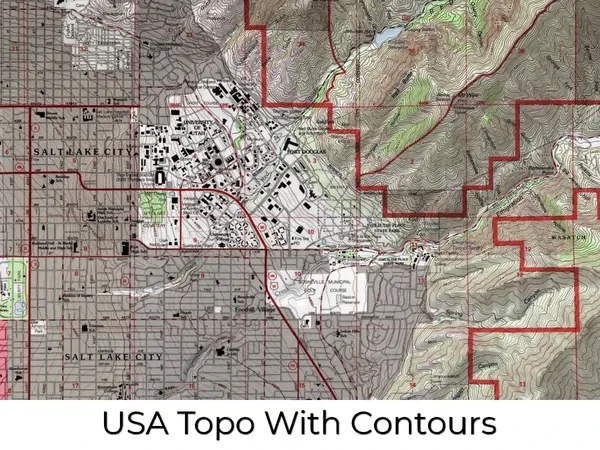
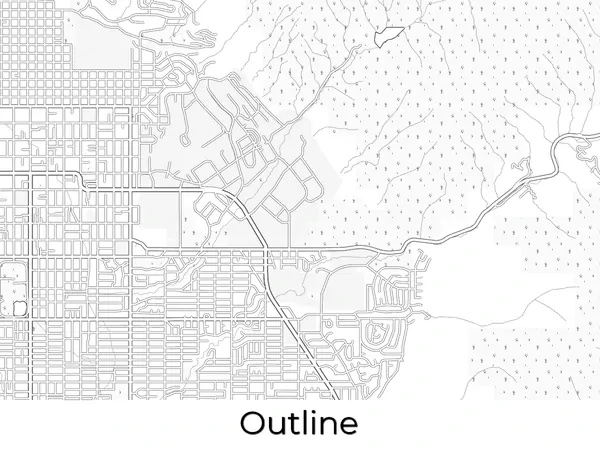
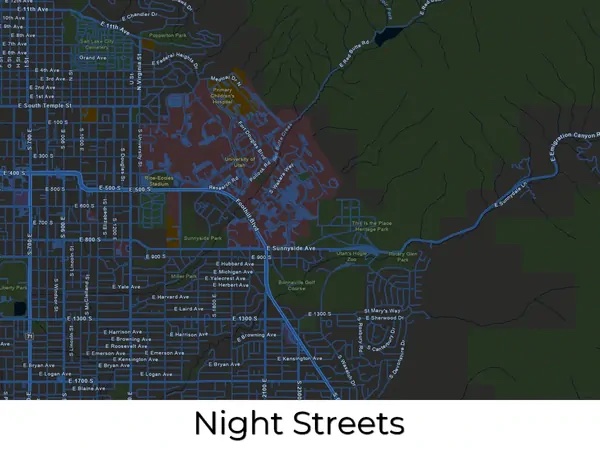
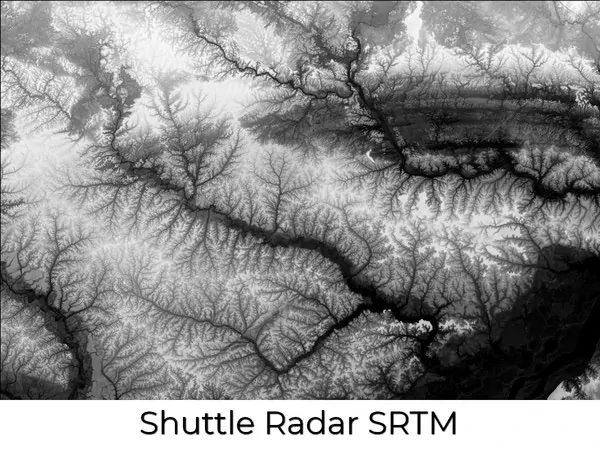
Map Design Styles of Elevation Maps
Many design styles, or base maps, serve as a starting point for your elevation map. We source and create our base maps using the same digital tools that expert cartographers use to create maps. Once you have selected your base map, everything else is fully customizable. We can layer informational text (such as landmarks or other points of interest) and even change the colors to suit your preferences.
Complex layers can be added such as streams and lakes, terrain, roads, and even more detail like political boundaries, religious, and other population-based demographics. Multiple layers can also be added to the same elevation map. For example, community developers and city planners can benefit from a 3D map with layers that include parcel lines, existing building footprints, and utility lines. Take a look at the map style categories below for inspiration.
Technology and Materials Used in Elevation Maps
- With 3D printing technology, you are not limited to straight lines and boxes. The curves and cliffs are captured accurately and beautifully in astonishing detail.
- Your vision of the final 3D map determines which materials we will choose to produce the best results. We help you to determine the materials that best suit your project.
- We use fabrication technologies such as 3D printing, CNC cutting, and molding/casting.
- Elevation maps show incredible detail.
- Our maps are printed in full color (with over 17 million variations of color) for awe-inspiring presentations and displays. No painting required!
- Typically, we use a special process for finishing the sides of the raised relief maps in a suede-like material, similar to the finish of a jewelry box.
- Our in-house paint booth gives us flexibility in different types and grades of paint and finishing capabilities; we can provide UV-resistant coatings to protect the coloration of your 3M map for many years.
- We also offer customized additions to our 3D maps and models. Our in-house carpentry shop will build elegant bases, tables, or cabinetry to display any map you choose. Worried about dust? We can customize a case to protect your display as well. Our skilled artisans can hand-paint details to make your map a true work of art.
Pricing of Custom Elevation Maps
The price of 3D maps and models are generally based on your size requirements, specific design needs, and the amount of work it will take to produce. Each map is custom-built and charged for accordingly. The best way to determine cost is to email us, call us at 385-206-8700, or fill out the form below and let us bid on your project.
Get a Free Price Estimate for a Custom Elevation Map
Custom Fabrication Workflow

Common Questions & Answers
- What is the largest map you can fabricate? There is no limit to the size of a map we can build. There are practical limits that will impact shipping and installation, but we work closely with our customers on these special requirements.
- What type of 3D maps can you fabricate? All types. Satellite Maps, Terrain Maps, Topographical Maps, Raised Relief Maps, USGS Maps, Contour Maps, and many more.
- Can you fabricate with different technologies and materials? Yes. Our most common fabrication technology is 3D Printing, but we can also build 3D Maps with CNC Cutting, 3D Foam, Molding/Casting, Thermoforming, and Sculpting.
- What materials can you 3D print in? We match the correct material and fabrication process to your requirements in terms of presentation, size, and transportability. We can 3D print in PLA, FDM, Full-Color Sandstone, UV-cured resin, plastic, rubber-like, acrylic, and nylon – as well as combining multiple technologies.
- Can you sign a Non-disclosure Agreement that you supply? Yes.
- How long will it take to create my map? That depends on the design and size of the map. A more complex or detailed map will take longer than a simple map, we can’t really say exactly how long it will take until we have the chance to understand what type of map you want fabricated. Generally, smaller standard maps can be a couple of weeks and large museum exhibition maps can be 6 months.
- What do you need from me to start the map fabrication? Boundaries are a good place to start. Determining map styles, sizes, height (may be exaggerated), and cabinetry needs are all part of the process. Special design features can also be added.
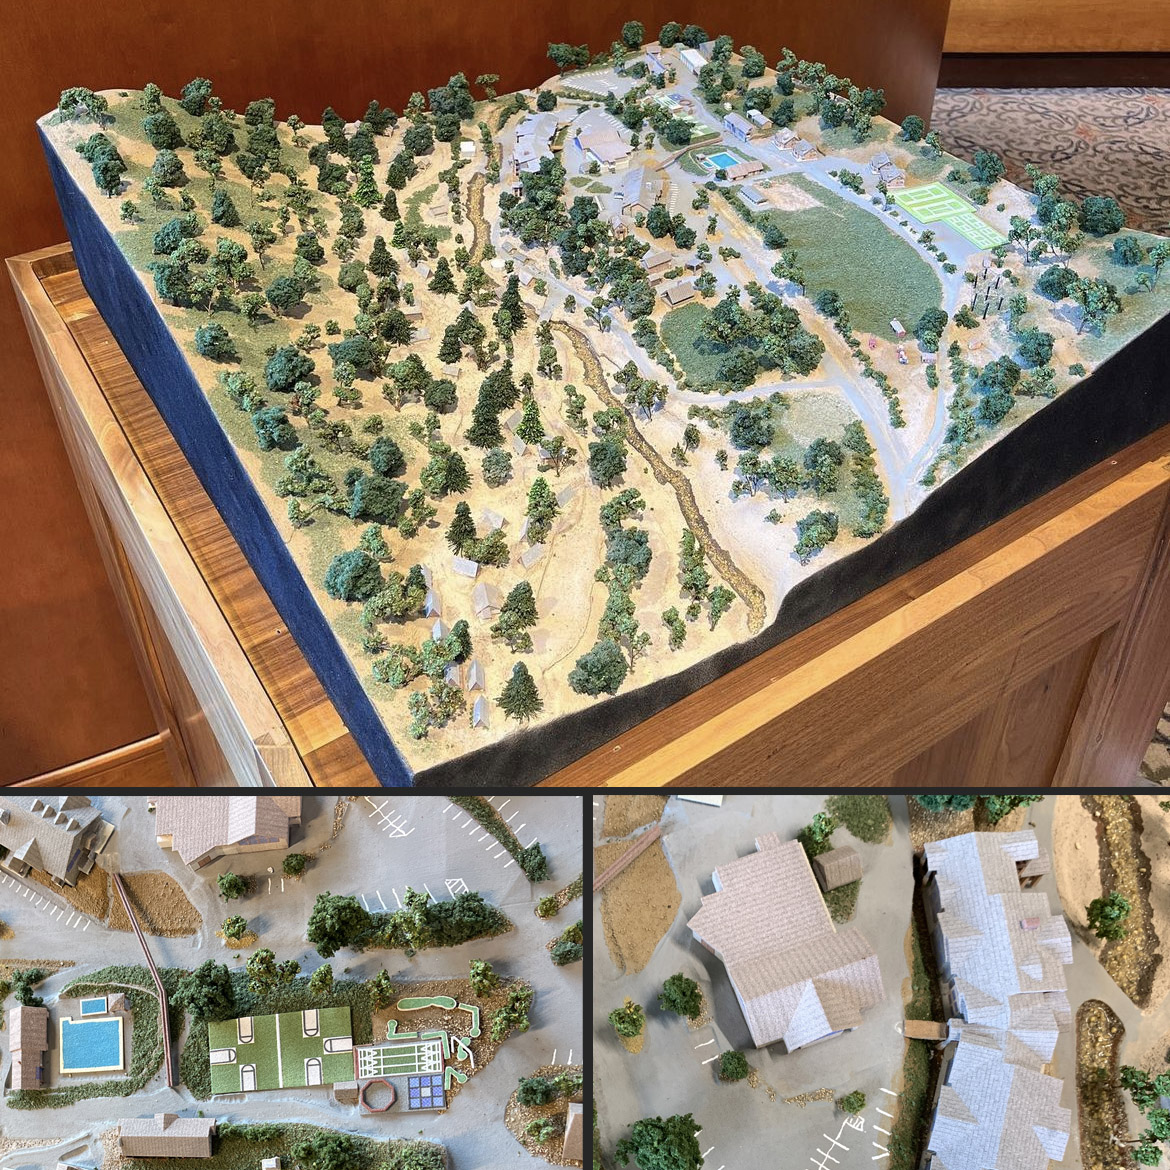
- Can you add homes, buildings, swimming pools, arbors, hardscaping features, etc.? Yes. We can 3D print many of these items and include them in our maps. We refer to these more complex maps as architectural dioramas.
- What are elevation maps? Elevation maps are visual representations of the height and terrain of a particular area. They show the variation of the Earth’s surface in terms of altitude, contour lines, and gradient. These maps are used for a variety of purposes, including urban planning, environmental analysis, weather forecasting, and military operations.
Elevation maps are typically created using a combination of remote sensing technologies, such as satellites, radar, and lidar. These techniques allow for highly accurate measurements of the Earth’s surface, which are then used to create detailed elevation models. The resulting maps are typically displayed using color-coded contour lines or shaded relief, which help to convey the variation in elevation across the terrain.
- How do you read elevation maps? Elevation maps are essential tools for understanding the height and terrain of a particular area. However, they can be difficult to read if you are not familiar with the symbols and conventions used on the map. Here are some tips for reading elevation maps:
Understand the contour lines: Contour lines are one of the most important symbols on an elevation map. These lines represent points of equal elevation, and they are typically displayed at regular intervals, such as every 10 or 20 meters. The closer the contour lines are together, the steeper the terrain.
Look for hachures: Hachures are small lines that are used to show the direction of a slope. These lines point downhill and can help you understand the steepness of the terrain.
Pay attention to shading: Elevation maps may be shaded to show the variation in elevation across the terrain. Typically, darker shades represent lower elevations, while lighter shades represent higher elevations.
Use the legend: Elevation maps come with a legend that explains the symbols and conventions used on the map. Be sure to consult the legend to understand the meaning of the various symbols.
Take note of the scale: Elevation maps come with a scale that shows the ratio between the distance on the map and the distance on the ground. This can help you understand the size and scope of the area depicted on the map.
- What does an elevation map show? An elevation map, also known as a topographic map, shows the height and terrain of a particular area. These maps use a variety of symbols and conventions to represent the elevation of the Earth’s surface.
The primary feature of an elevation map is the contour lines, which represent points of equal elevation. These lines are typically displayed at regular intervals, such as every 10 or 20 meters, and are used to show the variation in elevation across the terrain. The closer the contour lines are together, the steeper the terrain.
Elevation maps may also use shading to show the variation in elevation. Typically, darker shades represent lower elevations, while lighter shades represent higher elevations. This can give a quick visual representation of the terrain, allowing the viewer to easily identify valleys, ridges, and other topographic features.
In addition to contour lines and shading, elevation maps may use other symbols and conventions to represent specific features. For example, roads, rivers, and other landmarks may be shown on the map, as well as buildings and other structures.
- How is elevation shown on an elevation map? Elevation on an elevation map is shown using a variety of symbols and conventions, with the primary feature being contour lines. Contour lines are a series of curved lines that connect points of equal elevation above sea level. They represent the shape and features of the land surface, allowing us to visualize the terrain and changes in elevation.
Contour lines on an elevation map are typically labeled with the elevation they represent, such as every 10, 20, or 50 feet or meters. They are often drawn at regular intervals, such as every 10 or 20 meters, and the closer together the contour lines, the steeper the slope of the land. Conversely, wider spaced contour lines indicate flatter terrain.
In addition to contour lines, shading may also be used on an elevation map to represent changes in elevation. A common shading method is the use of hypsometric tints, where different colors or shades of gray are used to represent different elevation zones, such as green for low-lying areas and brown for higher elevations.
Hachures, which are short lines drawn perpendicular to contour lines, may also be used to show the direction and steepness of slopes. Hachures point downhill and are used to indicate steeper slopes.
Elevation maps may also include additional features and symbols, such as spot elevations, which are labeled points of known elevation, and benchmarks, which are fixed points of known elevation used for surveying.
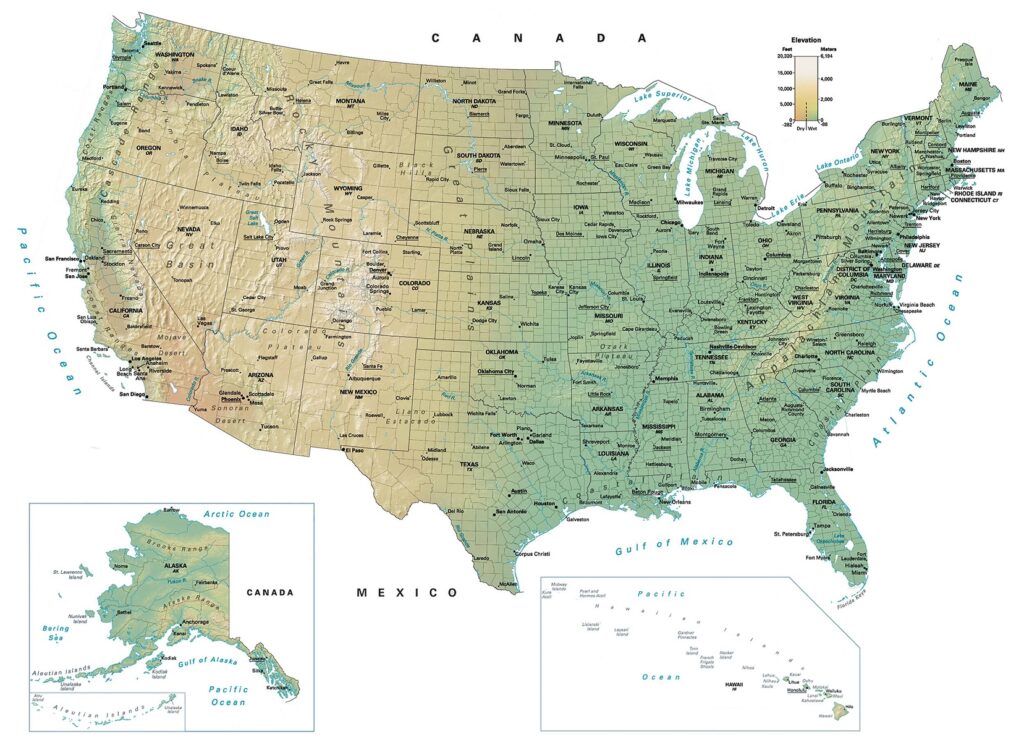
- What type of maps shows elevation? The type of maps that show elevation are called elevation maps or topographic maps. These maps are designed to represent the three-dimensional features of the Earth’s surface in a two-dimensional format. They use a combination of contour lines, shading, and other symbols to depict the elevation and terrain of a particular area. Elevation maps are commonly used in various fields, including geology, geography, land use planning, environmental science, and civil engineering. They are also frequently used for outdoor recreation and navigation, such as hiking and camping. Topographic maps are typically created by specialized organizations or government agencies, such as the United States Geological Survey (USGS) or the National Geospatial-Intelligence Agency (NGA), and are often available in both digital and print formats.
- How do you calculate elevation on an elevation map? To calculate elevation on an elevation map, you need to use the contour lines that represent points of equal elevation. Contour lines on a map are usually labeled with the elevation they represent, such as every 10, 20, or 50 feet or meters.
One way to calculate the elevation of a specific location on an elevation map is to determine the contour interval, which is the difference in elevation between adjacent contour lines. For example, if the contour interval is 10 meters and two adjacent contour lines are labeled 50 meters and 60 meters, respectively, then the elevation of the location between the two contour lines is approximately 55 meters.
If more accurate elevation measurements are required, a surveyor can use a leveling instrument to measure the elevation of a particular point relative to a known elevation benchmark. The surveyor can then use the contour lines on the map to determine the approximate elevation of the point.
In some cases, elevation maps may also include spot elevations, which are labeled points of known elevation. These elevations are usually determined by surveying the location with a leveling instrument or a Global Positioning System (GPS) device.
- How do you draw an elevation map? Drawing an elevation map involves several steps, including selecting the area to be mapped, collecting data on the elevation and terrain features, and creating the map itself. Here are the general steps for drawing an elevation map:
Choose the area to be mapped: Decide on the region or area to be mapped. This could be a small neighborhood, a city, or even a whole region or country.
Collect elevation data: To draw an elevation map, you need to collect data on the elevation and terrain features of the area. This can be done using surveying tools, such as GPS devices, or by accessing existing topographic data from sources such as the United States Geological Survey (USGS) or other government agencies.
Determine the contour interval: Once the elevation data has been collected, determine the contour interval for the map. This is the difference in elevation between adjacent contour lines and will determine the level of detail shown on the map. A contour interval of 10 meters, for example, would show more detail than a contour interval of 50 meters.
Draw the contour lines: Using the collected data, draw the contour lines on the map at the appropriate intervals. Contour lines are typically drawn as curved lines that connect points of equal elevation.
Add shading and other features: To make the map more informative and visually appealing, you can add shading or other features to show terrain and land cover. For example, you can use hypsometric tints, which are different colors or shades of gray to represent different elevation zones.
Label the map: Finally, label the map with the necessary information, such as the area being mapped, the contour interval, and the legend for any symbols used.
- How do you find the highest elevation on an elevation map?
To find the highest elevation on an elevation map, you can use the contour lines and spot elevations to identify the peak or highest point in the mapped area. Here are the general steps:
Identify the highest contour line: Look for the contour line on the map with the highest elevation. This may be labeled with a specific elevation, such as 10,000 feet or 3,000 meters.
Look for the highest point within that contour line: Examine the area within the contour line with the highest elevation. This may include several peaks or high points. Look for the spot elevation or other markings that indicate the precise elevation of these points.
Identify the highest spot elevation: Once you have identified the high points within the contour line, look for the one with the highest elevation. This will typically be the highest point on the map.
Confirm the elevation: Check the spot elevation or other markings to confirm the precise elevation of the highest point.
- How do you find the lowest elevation on an elevation map?
To find the lowest elevation on an elevation map, you can use the contour lines and spot elevations to identify the lowest point or depression in the mapped area. Here are the general steps:
Identify the lowest contour line: Look for the contour line on the map with the lowest elevation. This may be labeled with a specific elevation, such as 500 feet or 150 meters.
Look for the lowest point within that contour line: Examine the area within the contour line with the lowest elevation. This may include several depressions or low points. Look for the spot elevation or other markings that indicate the precise elevation of these points.
Identify the lowest spot elevation: Once you have identified the low points within the contour line, look for the one with the lowest elevation. This will typically be the lowest point on the map.
Confirm the elevation: Check the spot elevation or other markings to confirm the precise elevation of the lowest point.
- What can you learn from an elevation map? Elevation maps can provide a wealth of information about the terrain and landscape of a particular area. Here are some of the things you can learn from an elevation map:
Elevation: Perhaps the most obvious thing you can learn from an elevation map is the relative elevations of different areas. Contour lines on the map can help you visualize the shape of the land, and spot elevations can provide specific elevation measurements.
Terrain: Elevation maps can also give you an idea of the type of terrain in a given area. For example, steep contour lines may indicate a mountainous region, while flat or gently sloping lines may suggest a more level landscape.
Drainage patterns: By examining the contour lines on an elevation map, you can identify the paths that water takes as it flows downhill. This can be useful for understanding the drainage patterns of a particular area and for predicting potential flooding or erosion.
Slope: Elevation maps can also help you determine the slope of different areas. This information can be useful for activities such as building construction, road planning, and farming.
Vegetation: Elevation maps can also provide information about the types of vegetation that may be present in a particular area. For example, areas with high elevations or steep slopes may be more likely to have coniferous forests, while low-lying areas may have more deciduous trees.
Geology: By examining the patterns of elevation on an elevation map, you can also gain insights into the underlying geology of an area. For example, mountains may be indicative of tectonic activity, while flat, low-lying areas may be formed by sediment deposits.
- What connects points of equal elevation on a map? The points of equal elevation on a map are connected by contour lines. Contour lines are the curved lines that you see on an elevation map that connect points of the same elevation. They represent the shape and form of the land, and can be used to determine the slope and steepness of a given area. Contour lines are typically labeled with the elevation they represent, and the distance between contour lines on a map indicates the vertical distance between two points. By examining the contour lines on a map, you can get a sense of the terrain and topography of the area, including the location of ridges, valleys, and other features. Contour lines are a fundamental feature of elevation maps, and are used by scientists, engineers, and other professionals to study and plan activities in a wide range of fields, from urban planning to geology to hiking and outdoor recreation.
- What is spot elevation on a map? Spot elevation on a map refers to the exact elevation of a specific point on the map. These elevations are usually marked by a small black circle with a number in it, which represents the precise elevation of that point.
Spot elevations are often used in conjunction with contour lines on an elevation map to provide more detailed information about the topography of an area. For example, if a contour line indicates an elevation of 1000 feet, a spot elevation might indicate that a particular point on that contour line is actually 1005 feet.
Spot elevations are typically obtained through a variety of methods, including using GPS devices, traditional surveying techniques, and remote sensing technologies such as LiDAR. They are commonly used in a variety of fields, including engineering, architecture, and surveying, where accurate elevation data is important for planning and design purposes.
In addition to spot elevations, elevation maps may also include benchmarks, which are permanent markers placed at specific locations to provide a consistent point of reference for future elevation measurements. These benchmarks are often used by surveyors and other professionals to ensure that elevation data is consistent and reliable over time.
- What unit of measure is used on the elevation map? The unit of measure used on an elevation map is typically feet or meters, depending on the country or region. The elevation values on the map represent the vertical distance between a specific point on the Earth’s surface and a fixed reference point, usually sea level.
In the United States, elevation maps often use feet as the unit of measure, while in many other countries, including much of Europe, meters are used. It is important to note the unit of measure when interpreting elevation maps, as differences in units can lead to confusion or errors in calculations.
In addition to feet and meters, other units of measure may also be used on elevation maps, depending on the specific application. For example, in geological or hydrological studies, elevation may be expressed in terms of pressure units, such as psi (pounds per square inch) or bar (a unit of pressure roughly equivalent to one atmosphere).
Do you have a question we didn’t answer? Don’t hesitate to contact us at 1-385-206-8700 or [email protected].
Worldwide Delivery
WhiteClouds has delivered maps around the world.
History of Elevation Maps
The history of elevation maps dates back centuries, and it has played a critical role in our understanding of the world. From ancient civilizations to modern-day technologies, the evolution of elevation maps has been an exciting journey that has changed the way we view and interact with the world around us.
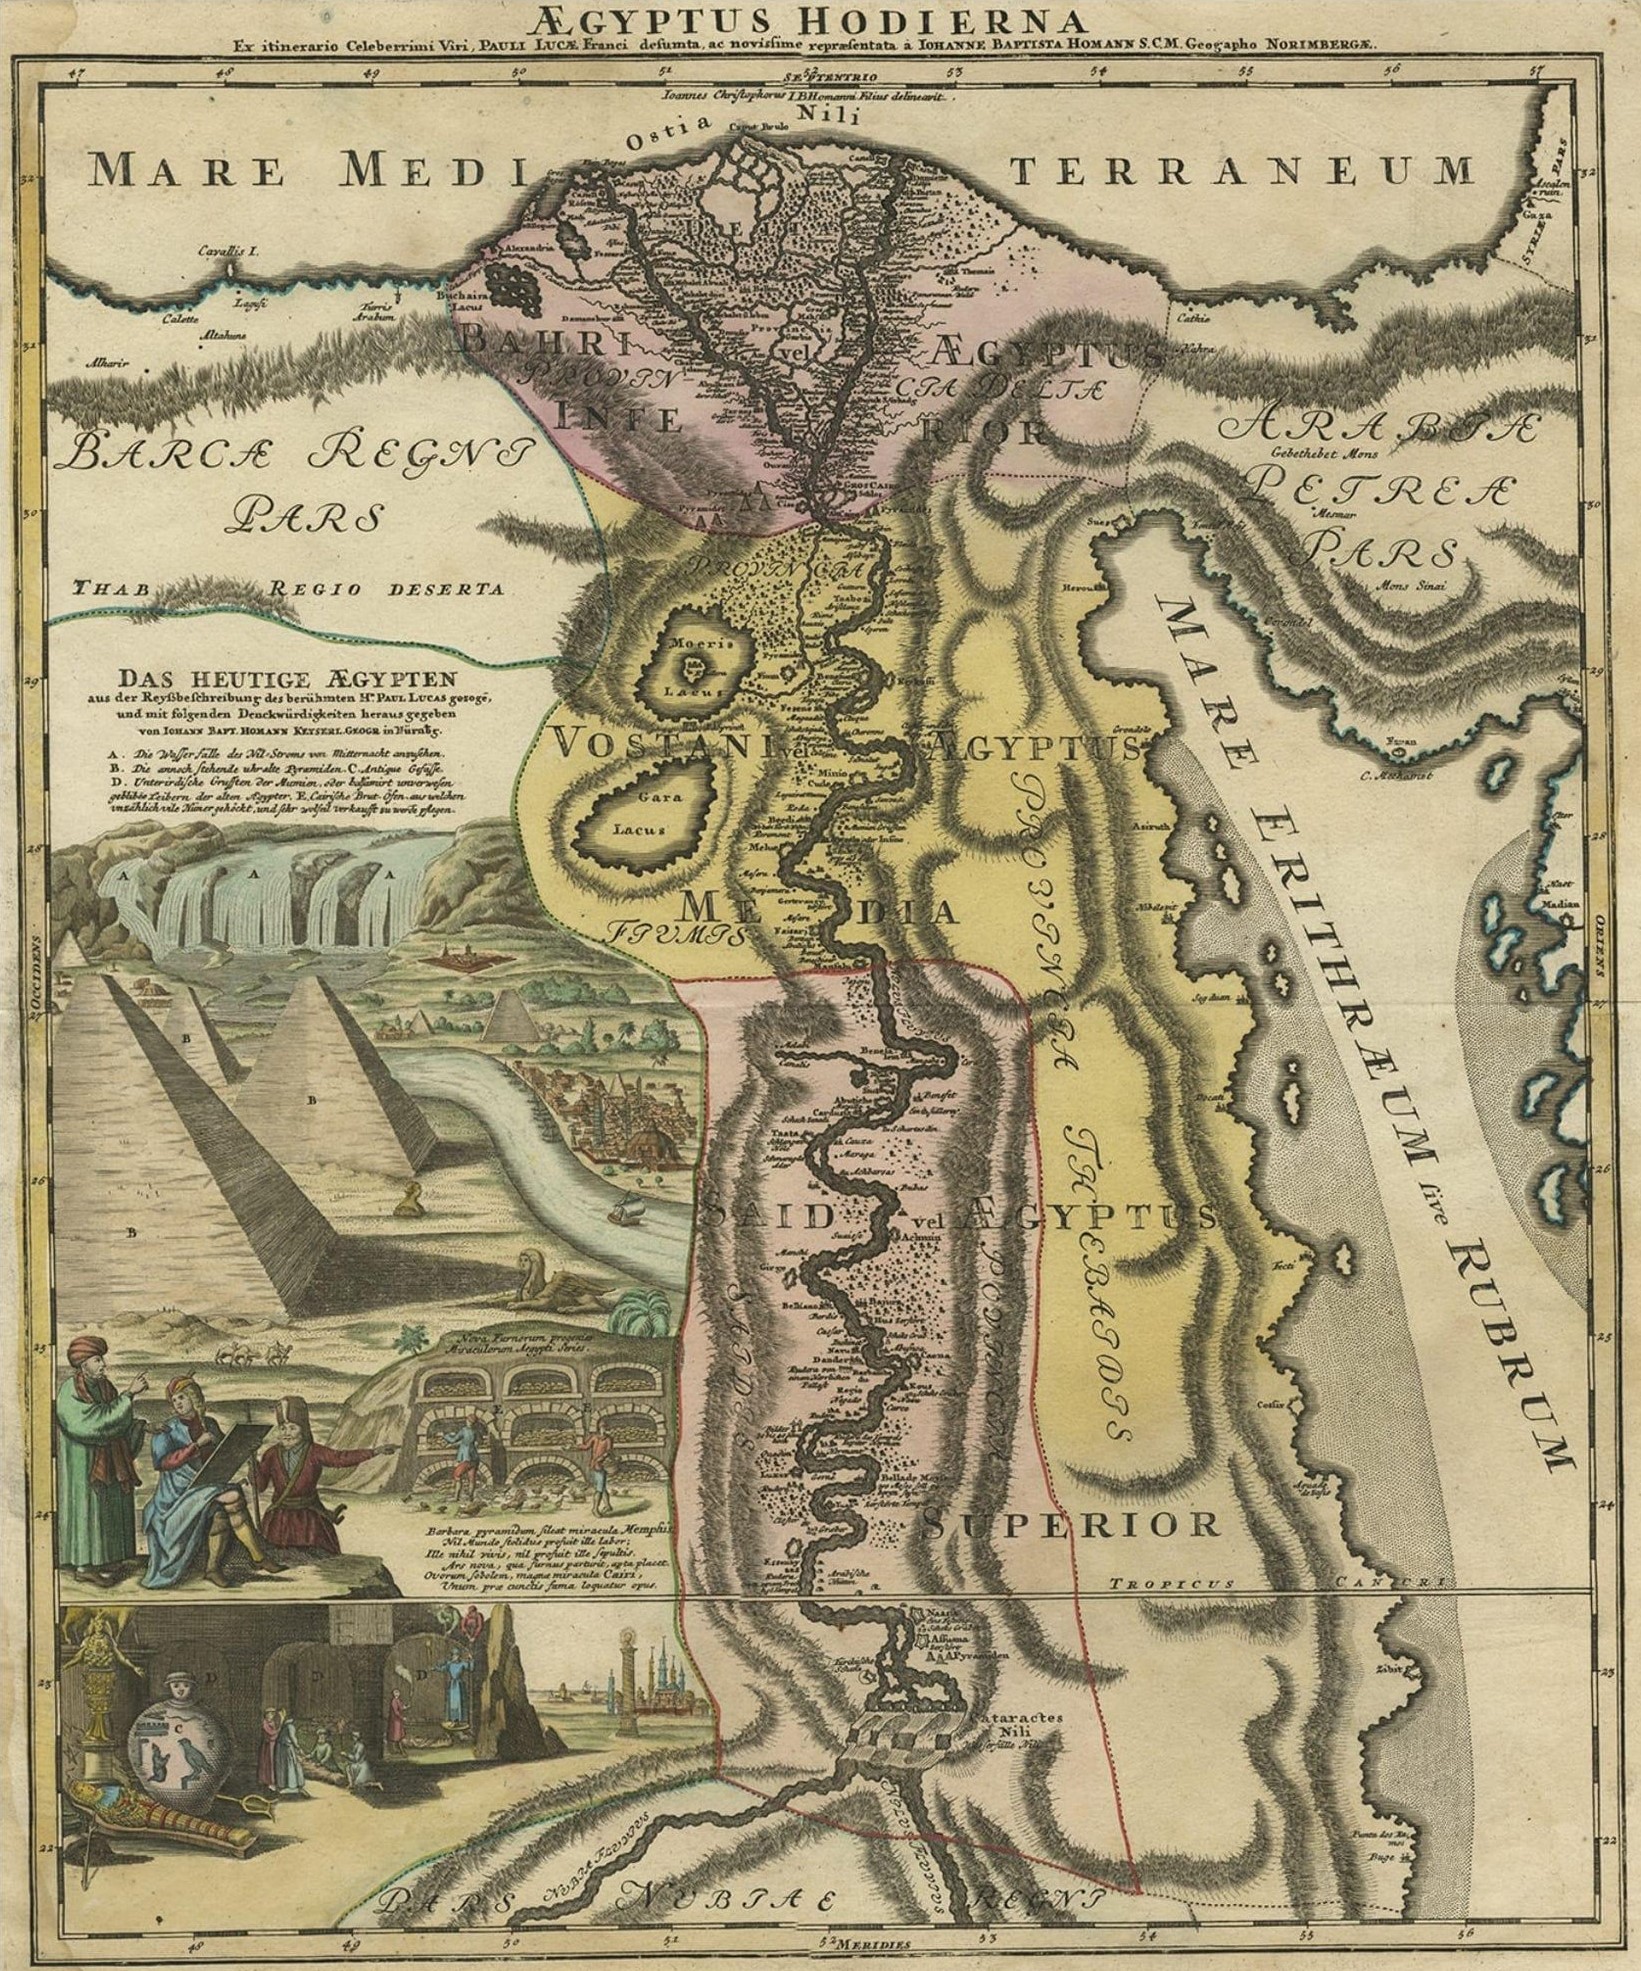
The earliest known elevation map dates back to ancient Egypt, where cartographers used topographic symbols to represent the terrain of the Nile River Valley. These maps were used for irrigation purposes and to track the Nile’s annual flooding. The ancient Greeks also created some of the earliest elevation maps, which were used for navigation purposes.
During the Middle Ages, elevation maps became more sophisticated, with cartographers using contour lines to represent the height and slope of the terrain. These maps were used primarily for military purposes, allowing generals to plan their campaigns and navigate through rugged terrain.
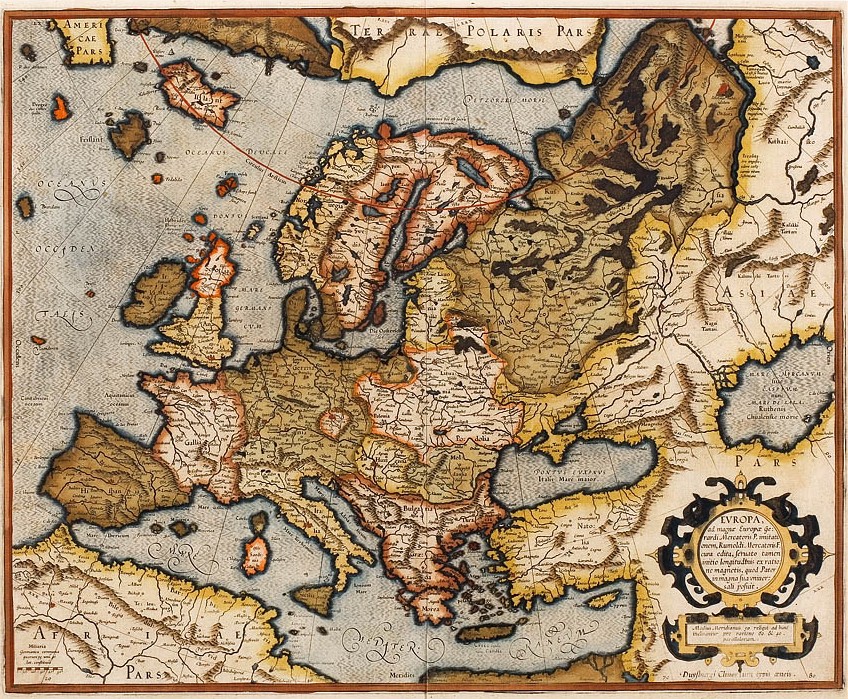
The Renaissance brought about a renewed interest in science and cartography, and elevation maps began to take on a more accurate and detailed form. In the 16th century, Flemish cartographer Gerardus Mercator created some of the earliest accurate maps of Europe, which included detailed elevation and topographic information.
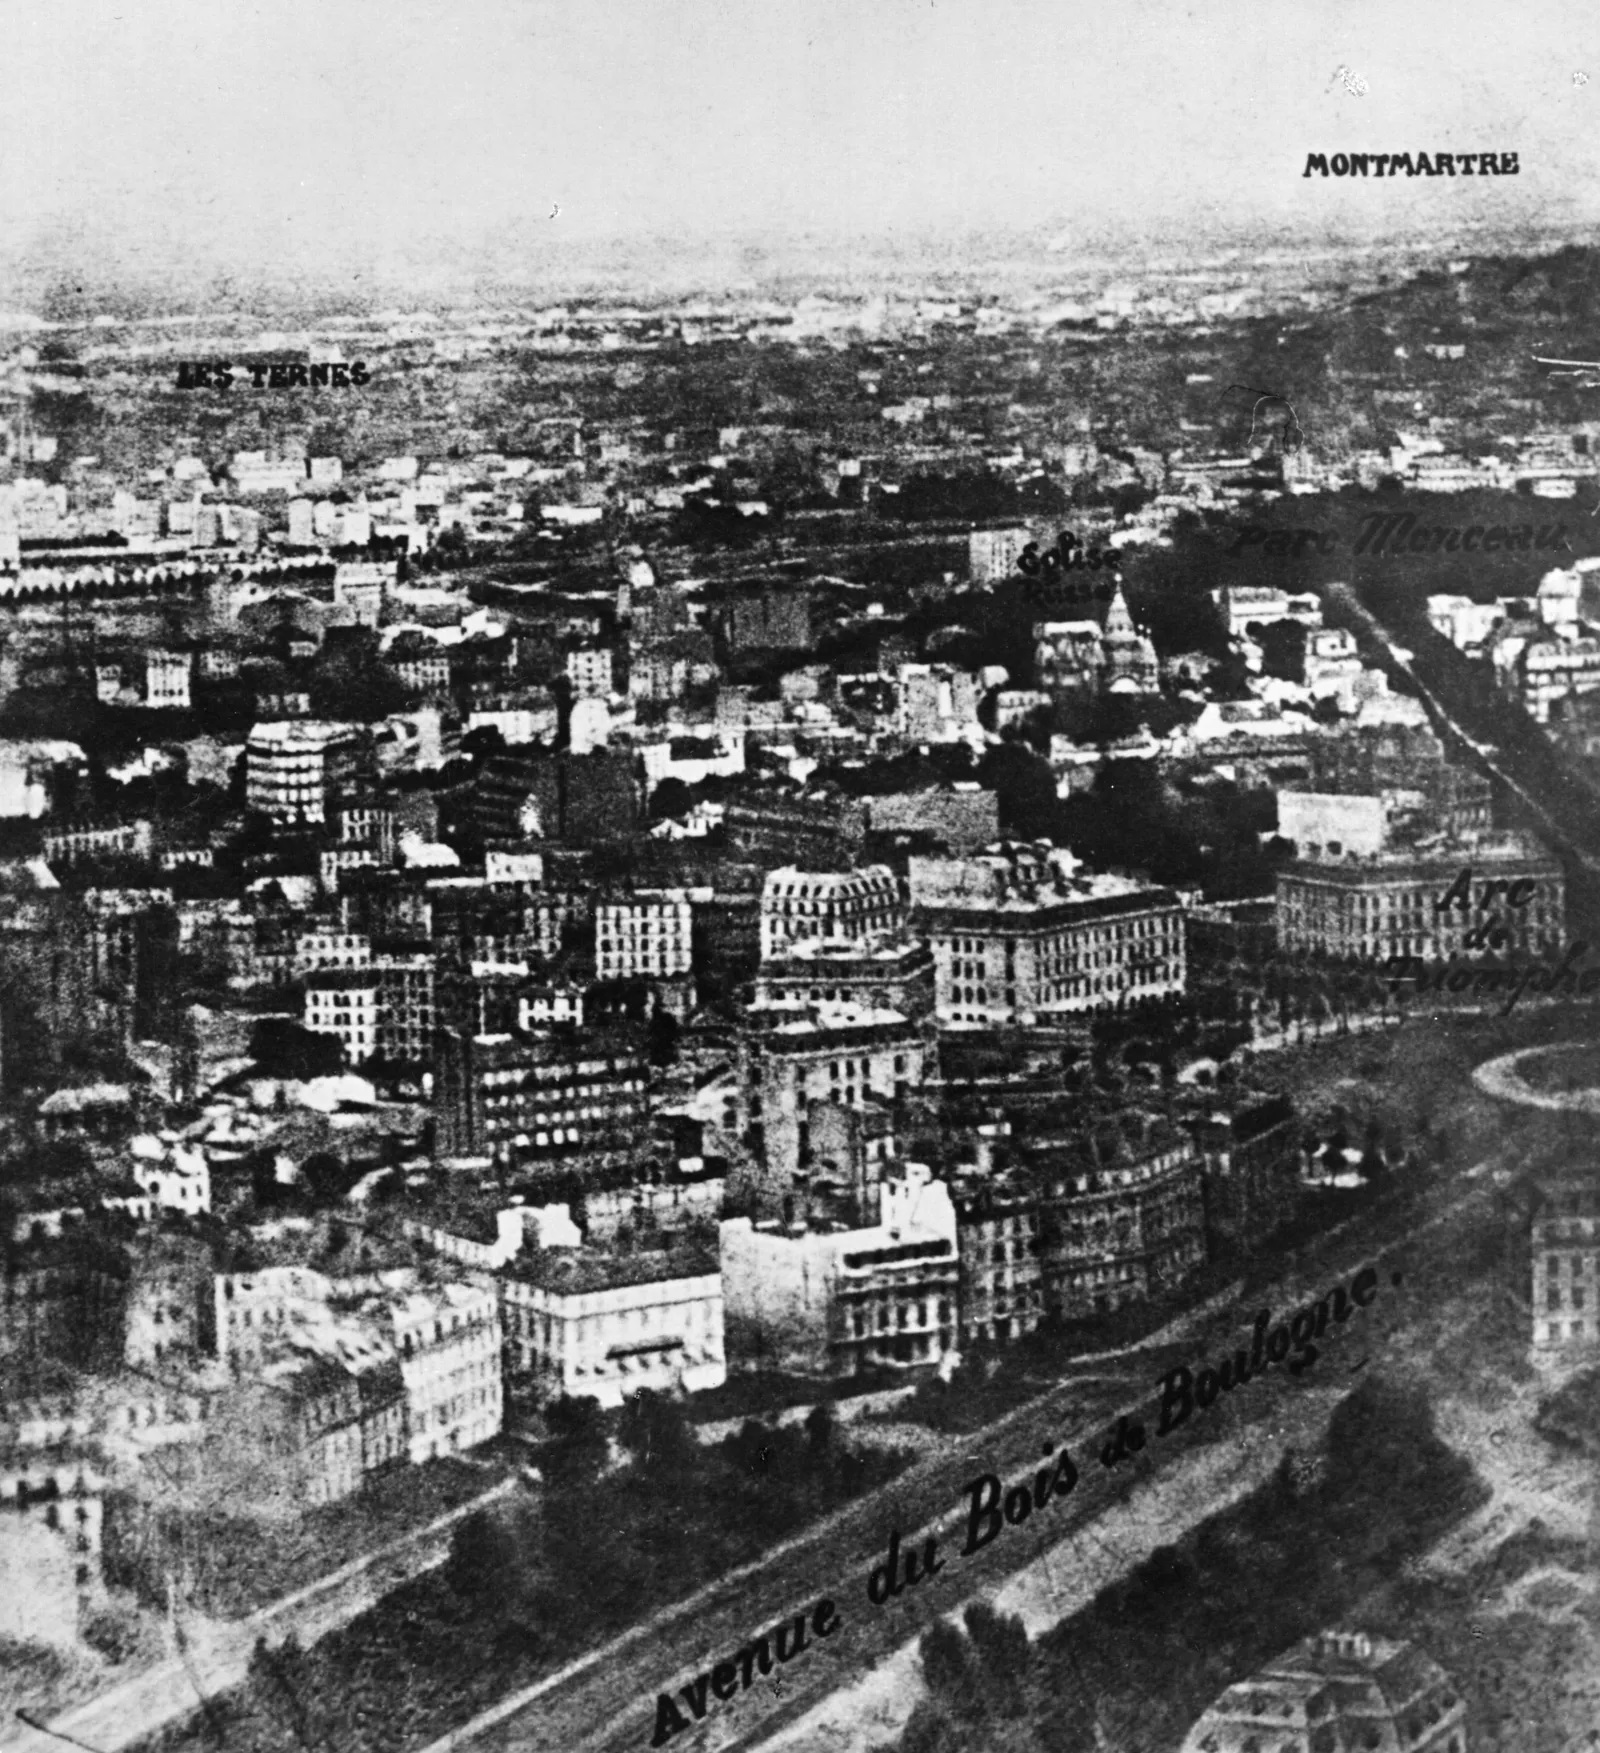
The 19th century marked a significant shift in the evolution of elevation maps, with the development of photography and aerial mapping techniques. In 1855, Frenchman Gaspard-Félix Tournachon, known as Nadar, took the first aerial photograph from a hot air balloon. This technique allowed for the creation of highly detailed and accurate elevation maps, which were used for a wide range of scientific and military purposes.
In the early 20th century, advances in technology led to the development of more sophisticated elevation mapping techniques, including sonar and radar mapping. During World War II, radar mapping became an essential tool for the military, allowing them to create highly detailed maps of enemy territory and navigate through harsh terrain.
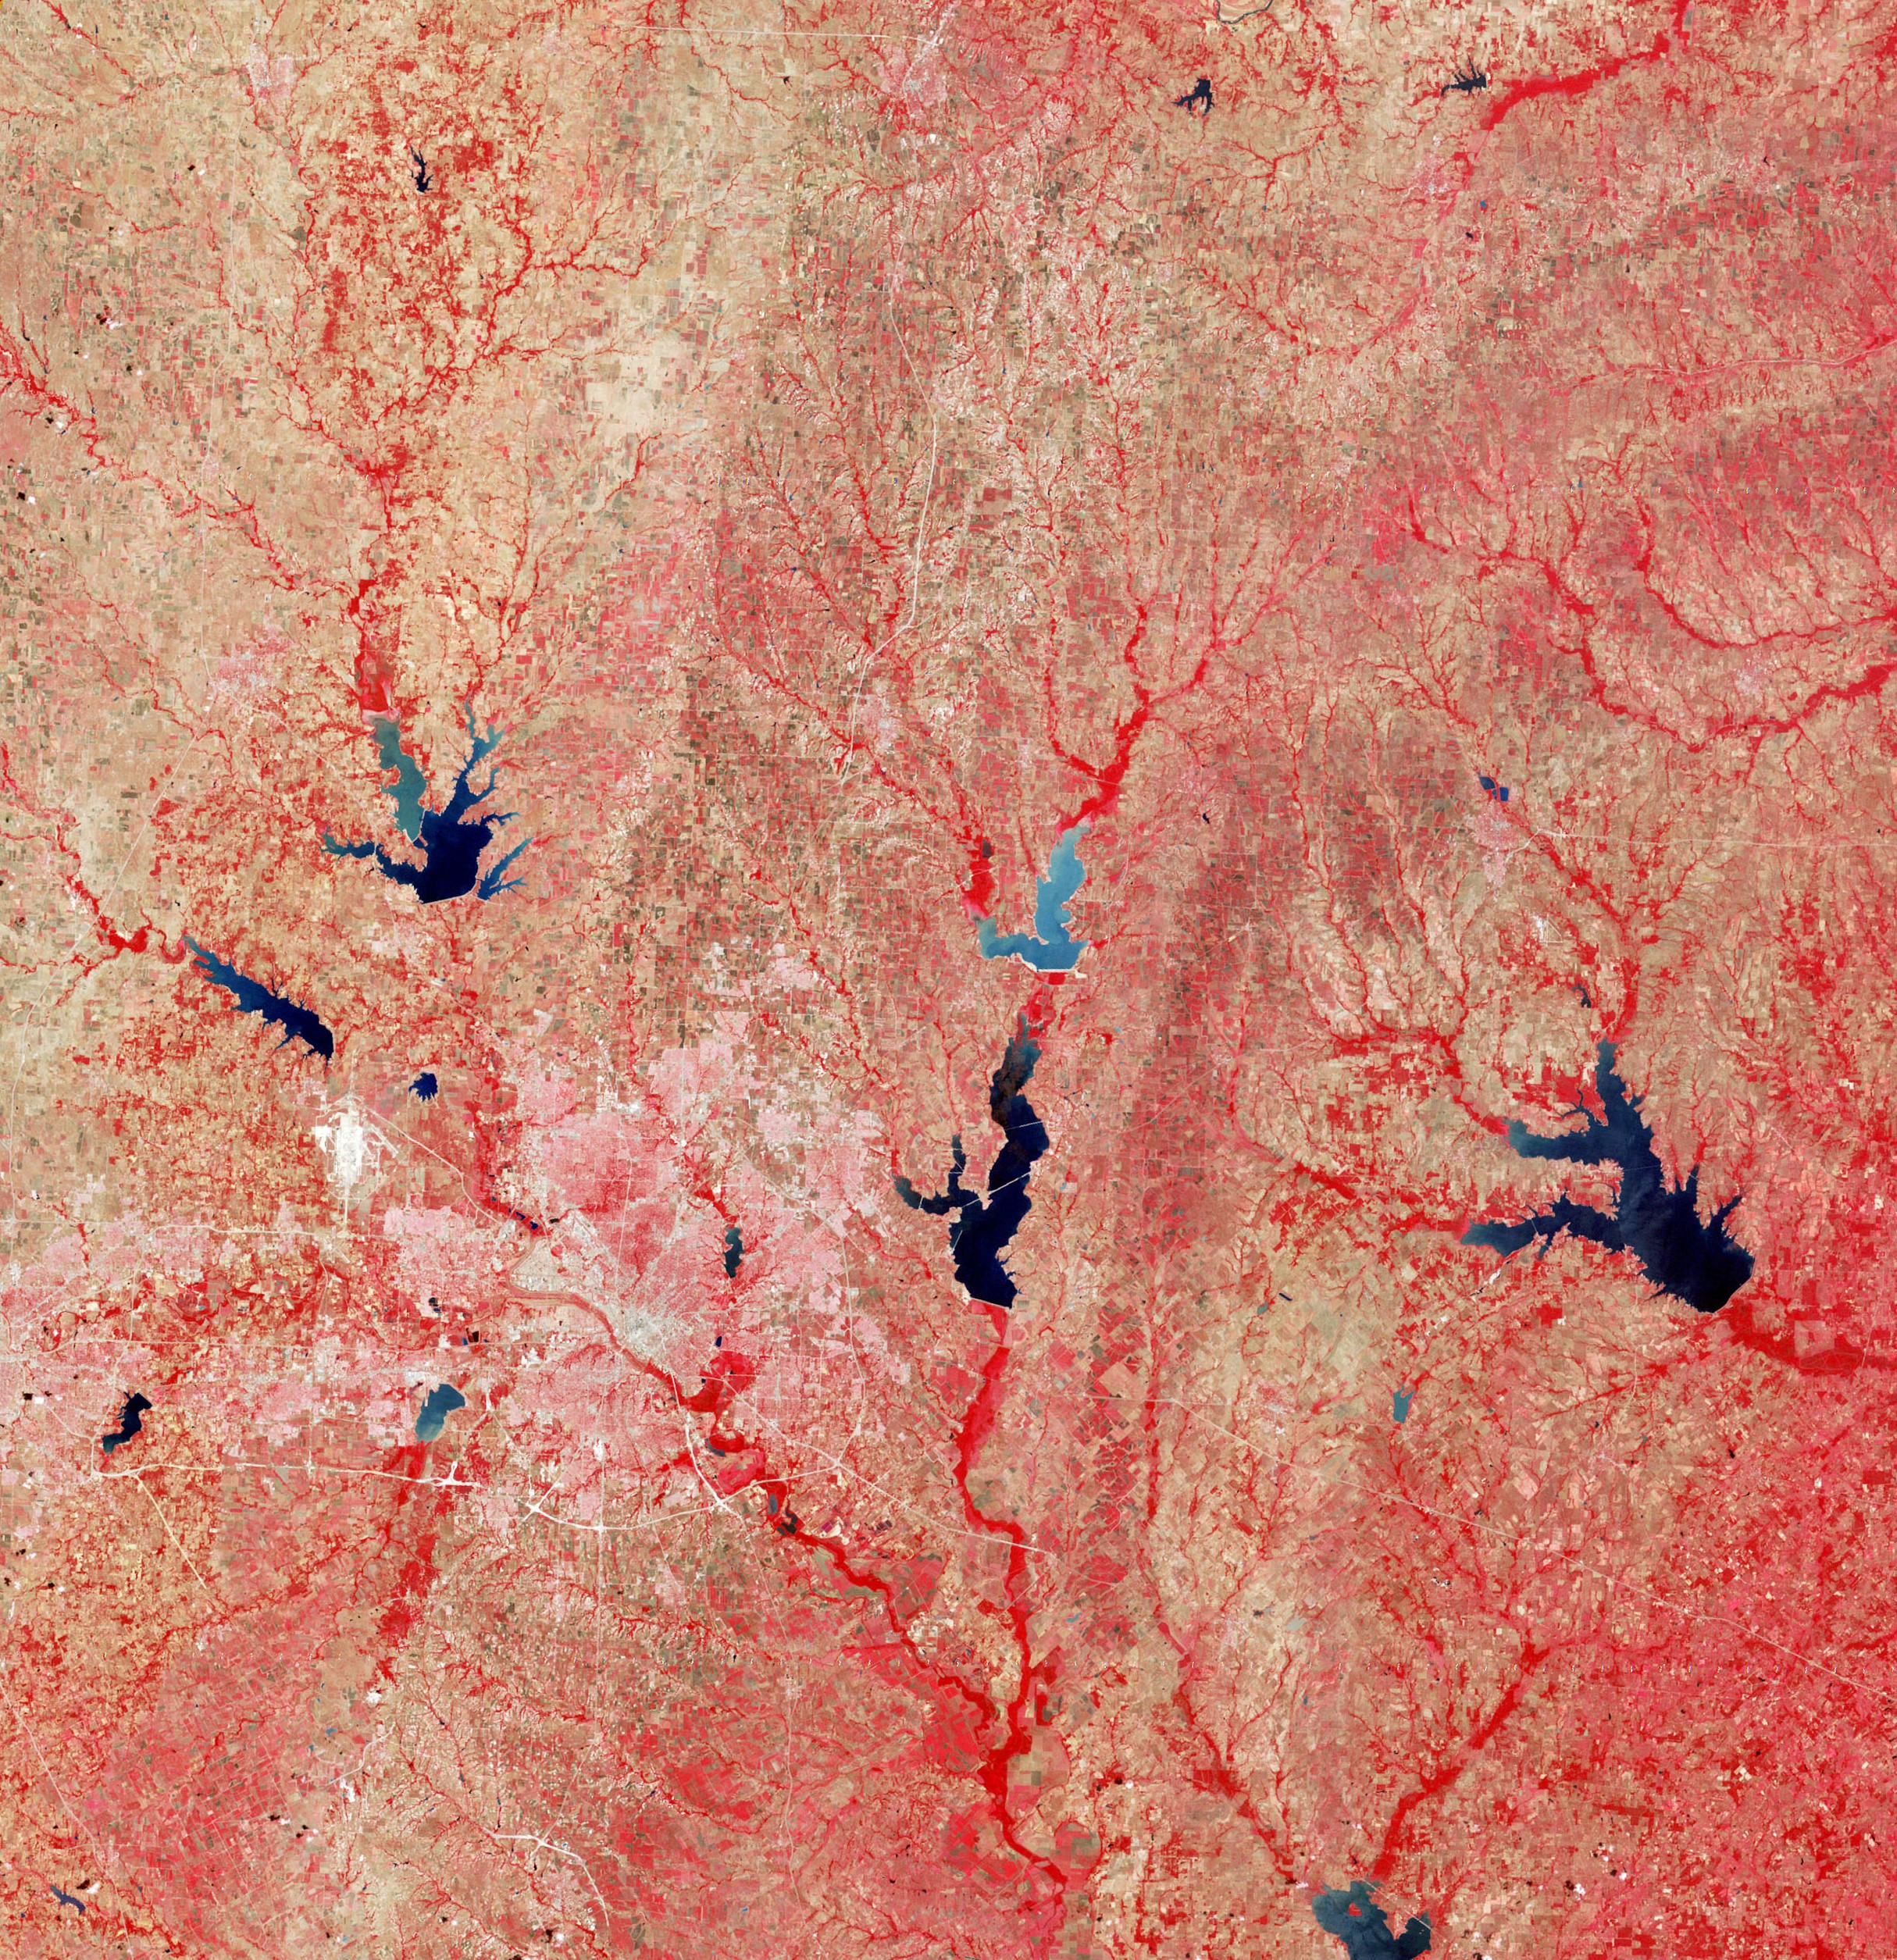
In the latter half of the 20th century, the development of satellite technology revolutionized the way we view and create elevation maps. In 1972, the United States launched the Landsat satellite, which captured images of the Earth’s surface in unprecedented detail. This technology allowed for the creation of highly accurate and detailed elevation maps, which are used today for a wide range of purposes, from weather forecasting to urban planning.
In conclusion, the evolution of elevation maps has been an exciting journey that has spanned centuries and has revolutionized our understanding of the world. From ancient Egyptian cartographers to modern-day satellite technology, elevation maps have played a critical role in shaping our understanding of the Earth’s surface. Today, elevation maps are an essential tool for a wide range of scientific, engineering, and recreational purposes, and they continue to evolve and improve with the development of new technologies. The history of elevation maps is a testament to human curiosity, innovation, and the desire to understand and appreciate the beauty and complexity of the natural world.