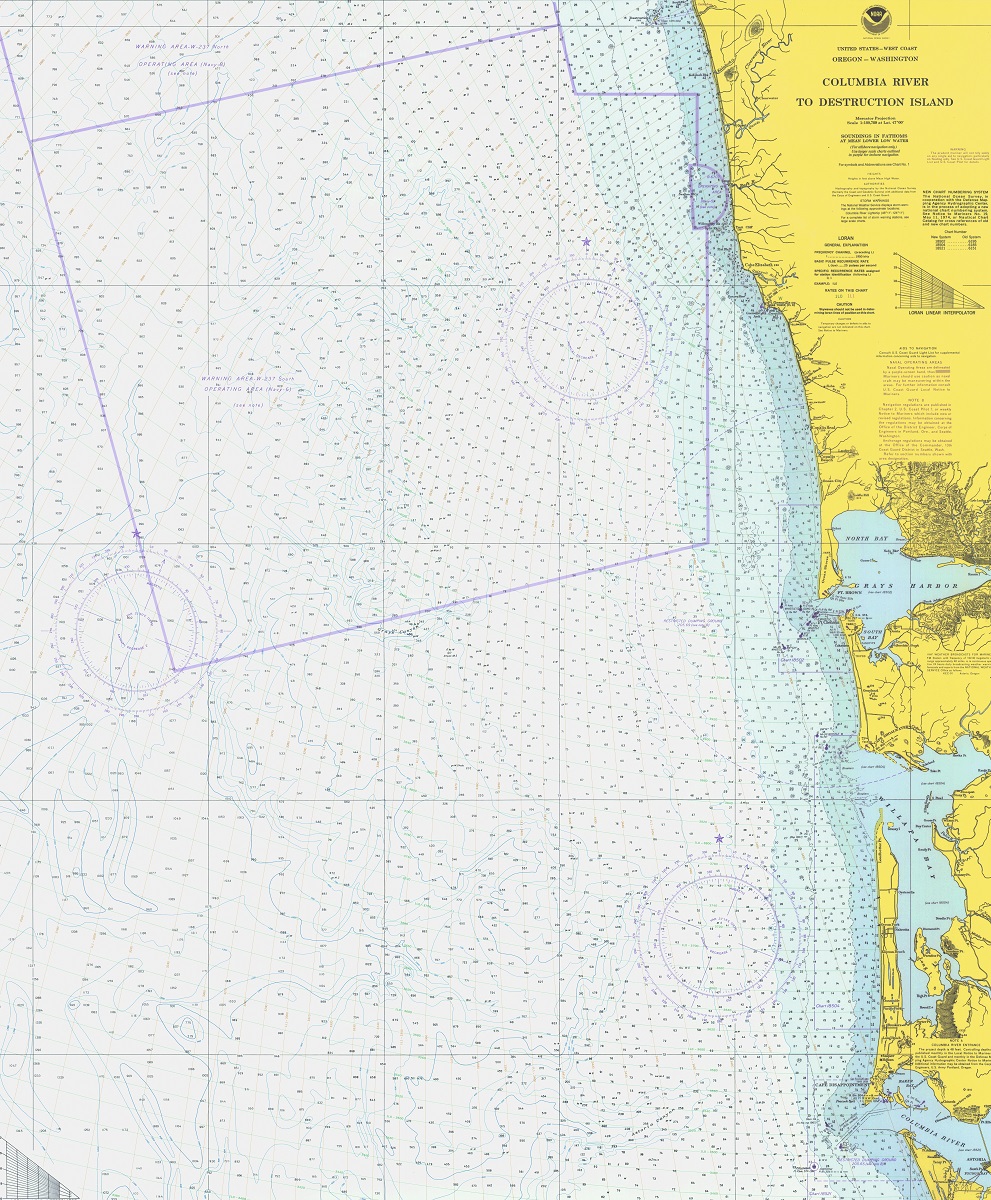
Cartometric Maps
Cartometric maps, also known as equal-area maps or area-preserving maps, are a type of map projection that aims to maintain accurate area measurements of geographic features on the map. Unlike other map projections that distort the size and shape of objects, cartometric maps are designed to preserve the relative areas of land masses, oceans, and other features on the Earth’s surface.
Types of Cartometric Maps
There are several types of cartometric maps, including equal-area cylindrical, equal-area conic, and equal-area azimuthal projections. Each type of projection has its own advantages and disadvantages, and is suitable for different types of mapping applications.
Equal-area cylindrical projections, such as the Lambert cylindrical projection, are useful for mapping large areas of the Earth’s surface. These projections preserve the area of features on the map but distort their shape. Equal-area conic projections, such as the Albers conic projection, are used for mapping regions with a north-south orientation, such as the United States. These projections preserve the area and shape of features along certain parallels of latitude. Equal-area azimuthal projections, such as the Lambert azimuthal equal-area projection, are useful for mapping regions around the poles. These projections preserve the area of features on the map but distort their shape.

Uses of Cartometric Maps
Cartometric maps are used in a variety of applications, including environmental management, land use planning, and geographic information systems (GIS). These maps can also be used to compare and analyze data across regions and to visualize spatial patterns and trends.
One common application of cartometric maps is in the study of climate change. These maps can be used to visualize changes in temperature, precipitation, and other climate variables across regions and over time. Cartometric maps are also used in the study of biodiversity and habitat conservation, allowing researchers to analyze the distribution and abundance of plant and animal species across different regions.
Features of Cartometric Maps
One of the key features of cartometric maps is their ability to preserve accurate area measurements of geographic features on the map. This means they are particularly useful for mapping regions with high variation in area, such as oceans and continents. These maps can also be used to create accurate representations of the distribution and abundance of natural resources, such as forests, fisheries, and mineral deposits.
Another feature is their ability to maintain the integrity of spatial relationships between features on the map. This means that distances and angles between features on the map are preserved, making cartometric maps useful for navigation and spatial analysis.
Benefits of Cartometric Maps
One of the main benefits of cartometric maps is their ability to provide accurate representations of geographic features on the Earth’s surface. This makes them particularly useful for applications where accurate area measurements are important, such as in land use planning, environmental management, and natural resource management.
These maps also allow for more accurate comparisons and analyses of data across regions. By preserving the relative areas of features on the map, these maps make it easier to compare and analyze data across different regions and to identify spatial patterns and trends.
Learn more about Maps
- Topographical Maps: Representation of the physical features of a region or area.
- Contour Maps: Representation of the contours of the land surface or ocean floor.
- Raised Relief Maps: Representation of land elevations with raised features indicating landforms.
- Terrain Maps: Representation of the physical features of a terrain or landmass.
- USGS Topographic Maps: Representation of topographic features and land elevations based on USGS data.
- USGS Historical Topographic Maps: Representation of historical topographic maps created by the USGS.
- Watershed Maps: Representation of the areas where water flows into a particular river or lake.
- Elevation Maps: Representation of land and water elevations with high precision.
- Physical Maps: Representation of physical features of the Earth’s surface such as landforms, oceans, and plateaus.
- Bathymetric Maps: Representation of the topography and features of the ocean floor.
- NOAA Maps: Representation of atmospheric, oceanographic, and environmental data by NOAA.
- Nautical Maps: Representation of the underwater features and depth of an area for navigation purposes.
- Geologic Maps: Representation of the geologic features of an area such as rock types, faults, and folds.
- Satellite Maps: Representation of earth from high-definition satellite imagery.
History of Cartometric Maps
Cartometric maps have a long history dating back to the early days of cartography. One of the earliest examples of this type of map is the 13th-century world map created by the Arab geographer al-Idrisi. This map used a rectangular grid to create an equal-area projection of the Earth’s surface.
In the 19th and 20th centuries, cartometric maps became increasingly important for land use planning, environmental management, and natural resource management. The development of digital mapping technologies in the 21st century has led to new applications of cartometric maps, including the use of satellite imagery to create high-resolution maps of the Earth’s surface.
To learn more about the latest in 3D Maps, check out 3D Maps.