
Mississippi River Watershed Map
Geography and Uses of Mississippi River Watershed Maps
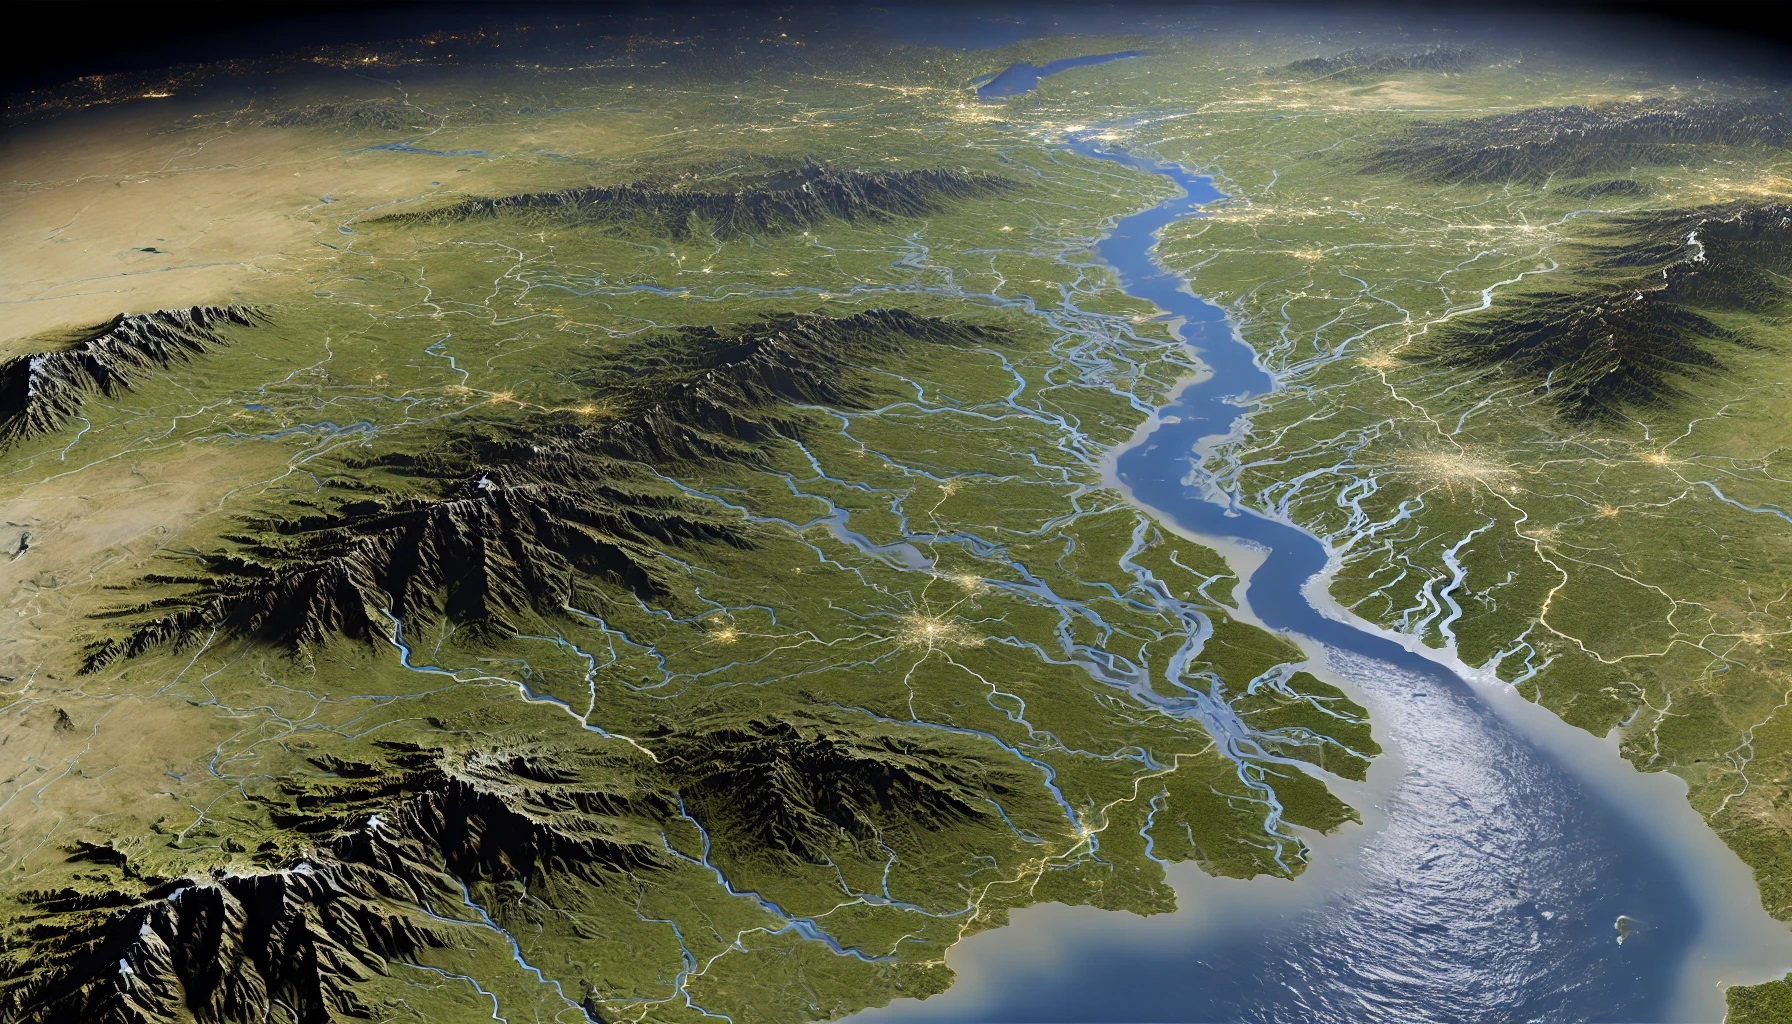
The Mississippi River Watershed is an enormous and intricate network that covers roughly 41% of the continental United States, making it the largest watershed in the country. Spanning 31 states and two Canadian provinces, it includes an elaborate network of rivers, streams, and tributaries, all feeding into the mighty Mississippi River. Mississippi River Watershed maps serve as essential tools for understanding the vast landscape, hydrology, ecology, and socio-economic importance of this system. These maps offer a window into the past, present, and future of one of the world’s most iconic river systems, helping researchers, planners, conservationists, and everyday citizens appreciate its scale and significance.
Mapping the Immensity: Visualizing the Geographic Reach of the Mississippi River Watershed
Imagine a giant funnel encompassing nearly half of the United States. Every drop of water that lands within the boundaries of this funnel eventually makes its way to the Mississippi River and flows southward into the Gulf of Mexico. This immense hydrological system encompasses everything from the arid plains of the Rocky Mountains to the lush forests of the Appalachian Mountains, with the central corridor of the Mississippi River serving as its heart.
To accurately visualize such a vast area, detailed watershed maps are essential. These maps capture the intricate web of rivers and tributaries, from the Ohio and Missouri rivers, which contribute enormous volumes of water, to smaller systems like the Arkansas and Red rivers. Each river plays a crucial role in the functioning of the watershed, helping to regulate water levels, transport sediment, and nourish ecosystems along the way.
Watershed maps typically display the key components of the system, including the river basins, floodplains, wetlands, and reservoirs. These features not only help us understand how water flows across the landscape but also highlight areas prone to flooding or drought. By studying the topography of the land, researchers can identify how water moves from one region to another and how various factors—such as land use, climate change, and urban development—affect the overall health of the watershed.
The Mississippi River Watershed is often divided into two major sections: the Upper Mississippi and the Lower Mississippi. The Upper Mississippi refers to the river’s origins in Minnesota and its journey south to the confluence with the Ohio River in Illinois. The Lower Mississippi continues from this junction and flows south through Arkansas, Mississippi, and Louisiana before reaching the Gulf of Mexico.
Maps of the watershed provide valuable insights into the interconnectedness of different regions. For example, rainfall in Montana can have a direct impact on flooding in Missouri, and drought conditions in the Midwest can affect water availability all the way to New Orleans. The Mississippi River Watershed map illustrates this complexity, helping people visualize the interconnected nature of water systems on a national scale.
A Vital Resource for Environmental Stewardship and Conservation
Watershed maps are indispensable tools for environmental management and conservation. They provide critical data on the distribution of water resources, helping governments, organizations, and communities plan for sustainable development, flood control, and habitat preservation.
One of the most important features of a Mississippi River Watershed map is its ability to display ecological zones within the watershed. The watershed supports a wide range of ecosystems, from freshwater marshes and coastal wetlands in the South to forested headwaters in the North. Many species depend on these ecosystems for survival, including migratory birds, fish, and mammals. The Mississippi River Flyway, for instance, is one of the most significant migration corridors in the world, supporting millions of birds as they travel from their breeding grounds in Canada and the northern United States to their wintering grounds in Central and South America.
Ecologists and conservationists rely on watershed maps to identify critical habitats and biodiversity hotspots within the system. Wetlands, in particular, are vital to maintaining the health of the watershed, acting as natural water filters and flood buffers. Maps of these areas are used to monitor changes in land use, such as agriculture, urban development, and deforestation, all of which can have adverse effects on the watershed’s overall health. By visualizing these changes, conservation efforts can be targeted more effectively to protect vulnerable areas and restore degraded habitats.
Additionally, maps of the Mississippi River Watershed play a key role in water quality monitoring. As the watershed is home to extensive agriculture, including some of the most productive farmlands in the world, runoff from these areas can contribute to water pollution. Pesticides, fertilizers, and other chemicals often enter rivers and streams, leading to nutrient pollution and the creation of dead zones, such as the one found in the Gulf of Mexico. Watershed maps help track the sources and flow of pollution, enabling more effective management strategies to improve water quality.
Mississippi River Watershed Maps: A Tool for Flood Management
Flooding is a natural part of the Mississippi River’s lifecycle, but it can also be devastating. The river and its tributaries are prone to significant floods, particularly during spring and early summer when snowmelt and rainfall combine to swell water levels. Historically, major floods have had catastrophic impacts on communities along the river, including the Great Flood of 1927 and the floods caused by Hurricane Katrina in 2005.
Flood management is a crucial aspect of the Mississippi River Watershed’s governance, and maps play an indispensable role in this process. Topographic maps, floodplain maps, and hydrological models provide essential information about areas at risk of flooding. By analyzing these maps, engineers and planners can design levees, floodwalls, and other flood control infrastructure to minimize damage.
One of the most important innovations in flood management has been the development of digital watershed maps that integrate real-time data on rainfall, river levels, and snowmelt. These maps can predict flood risks with remarkable accuracy, allowing communities to prepare for potential flooding events. Combined with satellite imagery and geographic information system (GIS) technology, modern watershed maps offer a level of detail and precision that was previously unimaginable.
In addition to their use in flood prevention, these maps help communities respond to flooding when it occurs. By tracking water levels in real-time, emergency responders can coordinate evacuations and deploy resources to areas most at risk. Flood maps are also used in the aftermath of floods to assess damage, guide recovery efforts, and inform future planning.
Planning a Physical Mississippi River Watershed Model
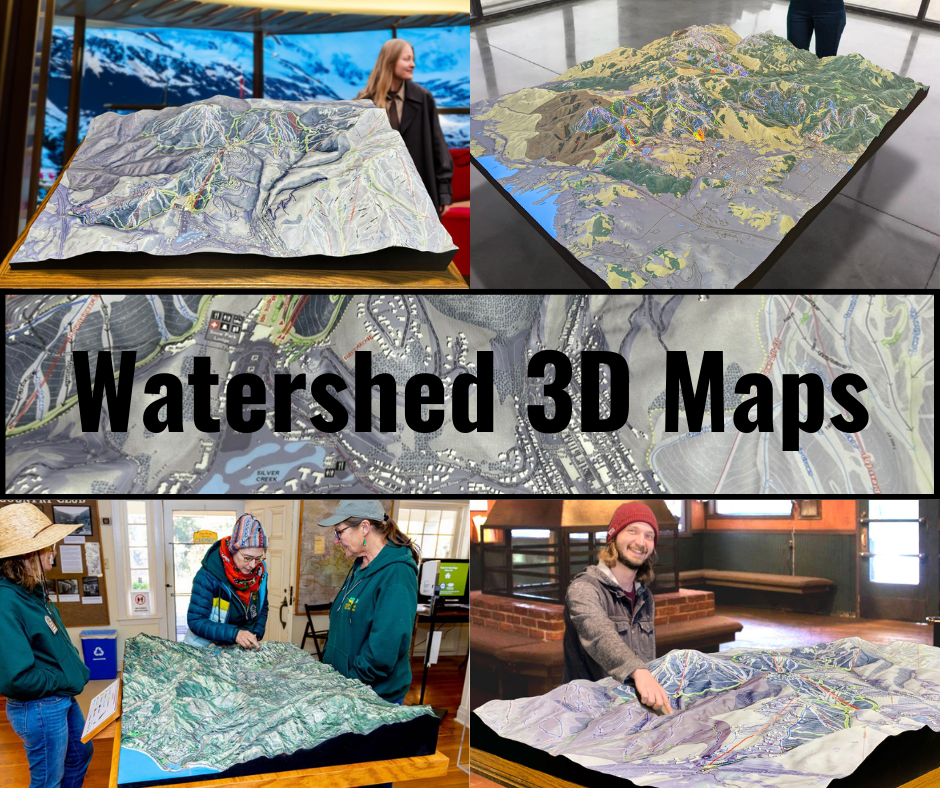
A physical watershed model can make elevation, tributaries, drainage boundaries, and regional relationships easier to compare in one view. The useful level of detail depends on the geographic extent, source data, model scale, and the audience that will use the display.
Using a Watershed Model for Communication
Labels, color, vertical exaggeration, removable overlays, and display orientation can be considered when they support a defined educational, planning, or exhibit purpose. Materials, production method, coating, and finish must be selected for the actual project rather than assumed from this reference article.
Check out WhiteClouds' 3D Maps for more information on Mississippi River watershed maps.
Custom project planning: For a physical model of the Mississippi River Watershed, review WhiteClouds' custom topographical model capabilities and 3D topographical model gallery. Geographic extent, scale, elevation treatment, water-system labels, and display purpose should be defined from the available source data.
Related topographical model resources
Explore WhiteClouds services and completed-project examples related to custom topographical models and watershed displays.
Custom 3D Map Quote
Share the size, placement, finish, timing, and reference files available for your project.