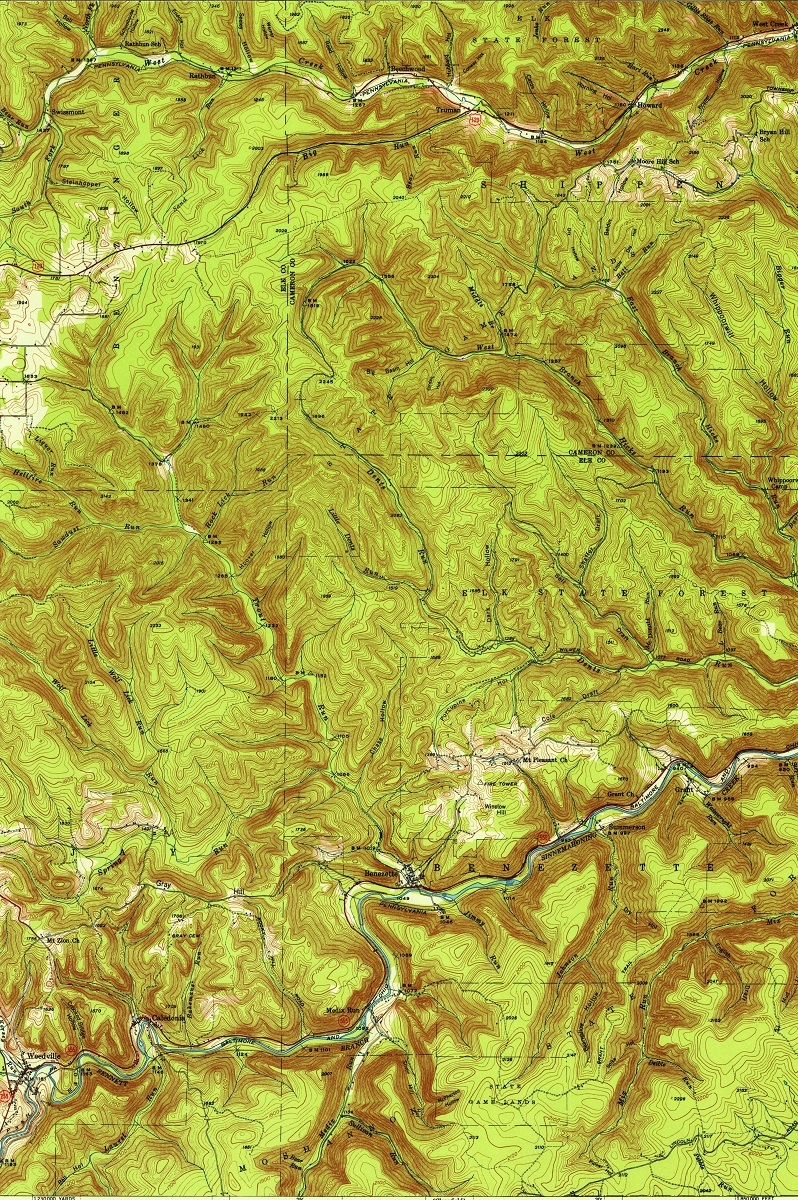
Topographic maps are an essential tool for hikers, campers, geographers, and many other outdoor enthusiasts. They provide a detailed representation of the terrain, including the shape and elevation of the land, making them ideal for navigation, trip planning, and environmental studies. In this beginner’s guide, we will explain how to read and interpret topographic maps, so you can gain the confidence to navigate the great outdoors with ease.
What are topographic maps?
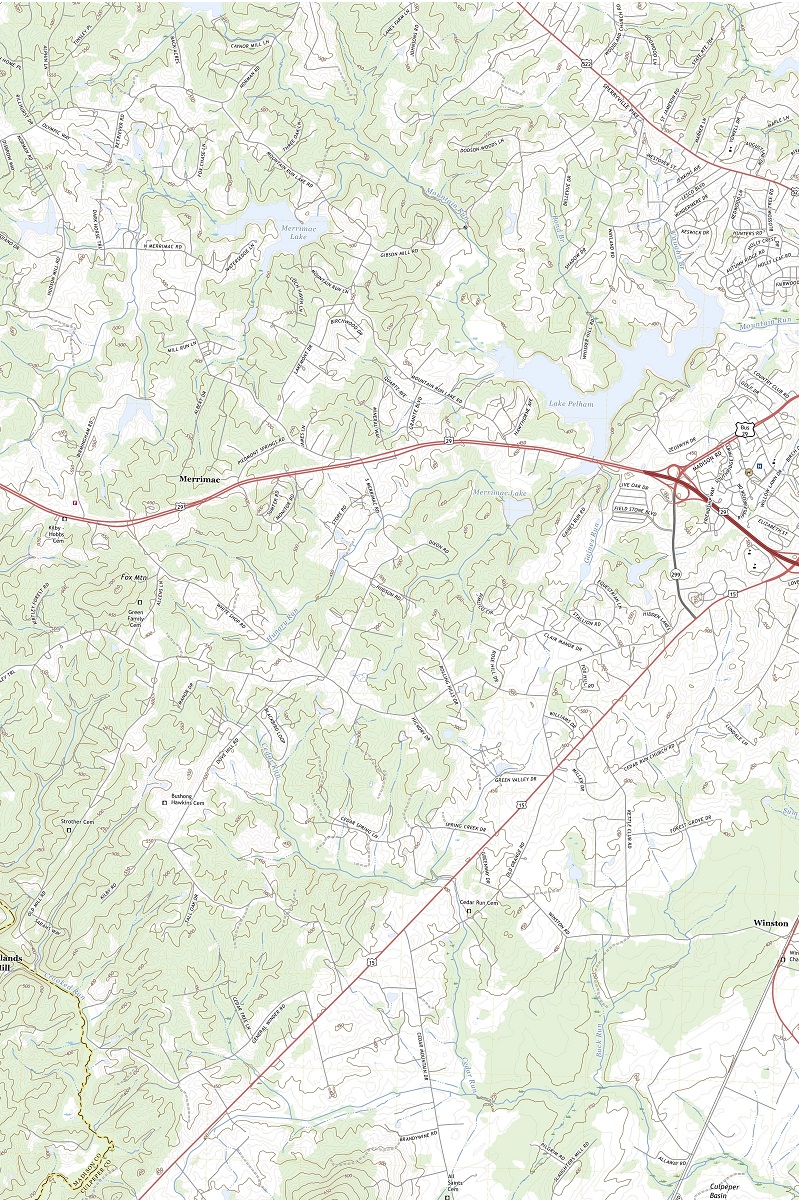
Topographic maps are a type of map that shows the three-dimensional surface features of the Earth. They use contour lines to represent the elevation and shape of the land, along with symbols and colors to indicate various features like rivers, lakes, and buildings. Topographic maps are created by surveying the land and recording its elevation and features, which are then translated into a graphical representation.
What are contour lines?
Contour lines are the primary feature of topographic maps, and they are used to represent the elevation of the land. These lines connect points of equal elevation above sea level, and they form closed loops around hills and depressions. The contour interval, or the vertical distance between contour lines, is usually indicated in the map’s legend.
For example, if the contour interval is 10 meters, a contour line that is closer to another contour line by 10 meters would indicate that the land has risen or fallen by 10 meters. By tracing the contour lines, you can determine the shape of the land and identify features like ridges, valleys, and plateaus.
Colors and symbols
Topographic maps also use colors and symbols to indicate various features. Blue usually represents water bodies like rivers, lakes, and streams, while green represents vegetation and forests. Brown is used to indicate contour lines, and black represents man-made features like roads, buildings, and boundaries. Other symbols, like a triangle with a dot in the center, indicate the location of a peak or summit.
Scale and orientation
The scale of the map indicates the ratio of the distance on the map to the actual distance on the ground. For example, a map with a scale of 1:50,000 means that one unit of measurement on the map represents 50,000 units on the ground. This information is usually found in the map’s legend, along with other useful information like the date of publication and the source of the data.
The orientation of the map refers to the direction of north. Topographic maps usually have a compass rose or north arrow that indicates the direction of north, allowing you to align the map with the actual terrain.
Reading the map
Now that you understand the basic features of a topographic map, it’s time to learn how to read it. The first step is to orient the map correctly, aligning the north arrow with the actual terrain. Once you have done this, you can start to identify the contour lines and use them to determine the shape of the land. One useful technique is to imagine the contour lines as a three-dimensional model, with each line representing a different elevation. By doing this, you can visualize the hills and valleys, and you can use this information to plan your route.
Another useful technique is to look for patterns in the contour lines. For example, if you see a series of parallel contour lines, this indicates a ridge or a plateau. On the other hand, if you see contour lines that form a V shape, this indicates a valley or a depression.
When planning a route, it’s important to take into account the contour interval and the distance between the contour lines. Steep slopes are indicated by contour lines that are close together, while gentle slopes are indicated by contour lines that are further apart. By identifying these features, you can choose the best route that matches your skill level and fitness. Topographic maps are an incredibly valuable tool for anyone who enjoys outdoor activities like hiking, camping, and mountaineering. They provide a detailed and accurate representation of the terrain, allowing you to navigate with confidence and plan your route ahead of time.
While reading topographic maps can seem daunting at first, it’s a skill that can be learned with practice. By familiarizing yourself with the basic features like contour lines, colors and symbols, scale, and orientation, you can quickly start to interpret the map and gain a better understanding of the terrain. It’s important to remember that topographic maps are just one tool in your navigation arsenal. They should be used in conjunction with other tools like a compass, GPS, or a map and compass combination to ensure that you stay on course and avoid getting lost.
Finally, it’s essential to understand that topographic maps are not perfect. They can contain errors, and the terrain can change over time due to natural events like erosion, landslides, and volcanic activity. It’s important to always be aware of your surroundings and use your judgment when navigating in the great outdoors.
In conclusion, learning how to read topographic maps is a valuable skill that can enhance your outdoor experiences and keep you safe in the wilderness. By following the tips outlined in this guide and practicing regularly, you can become an expert in topographic map reading and take your adventures to the next level.
Learn more about Maps
- Topographical Maps: Representation of the physical features of a region or area.
- Contour Maps: Representation of the contours of the land surface or ocean floor.
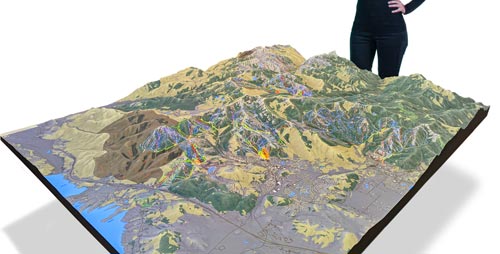
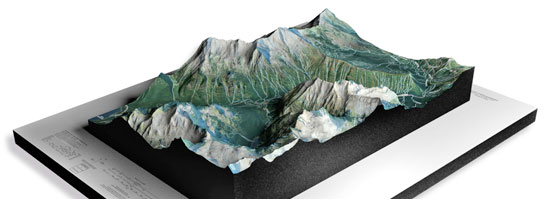
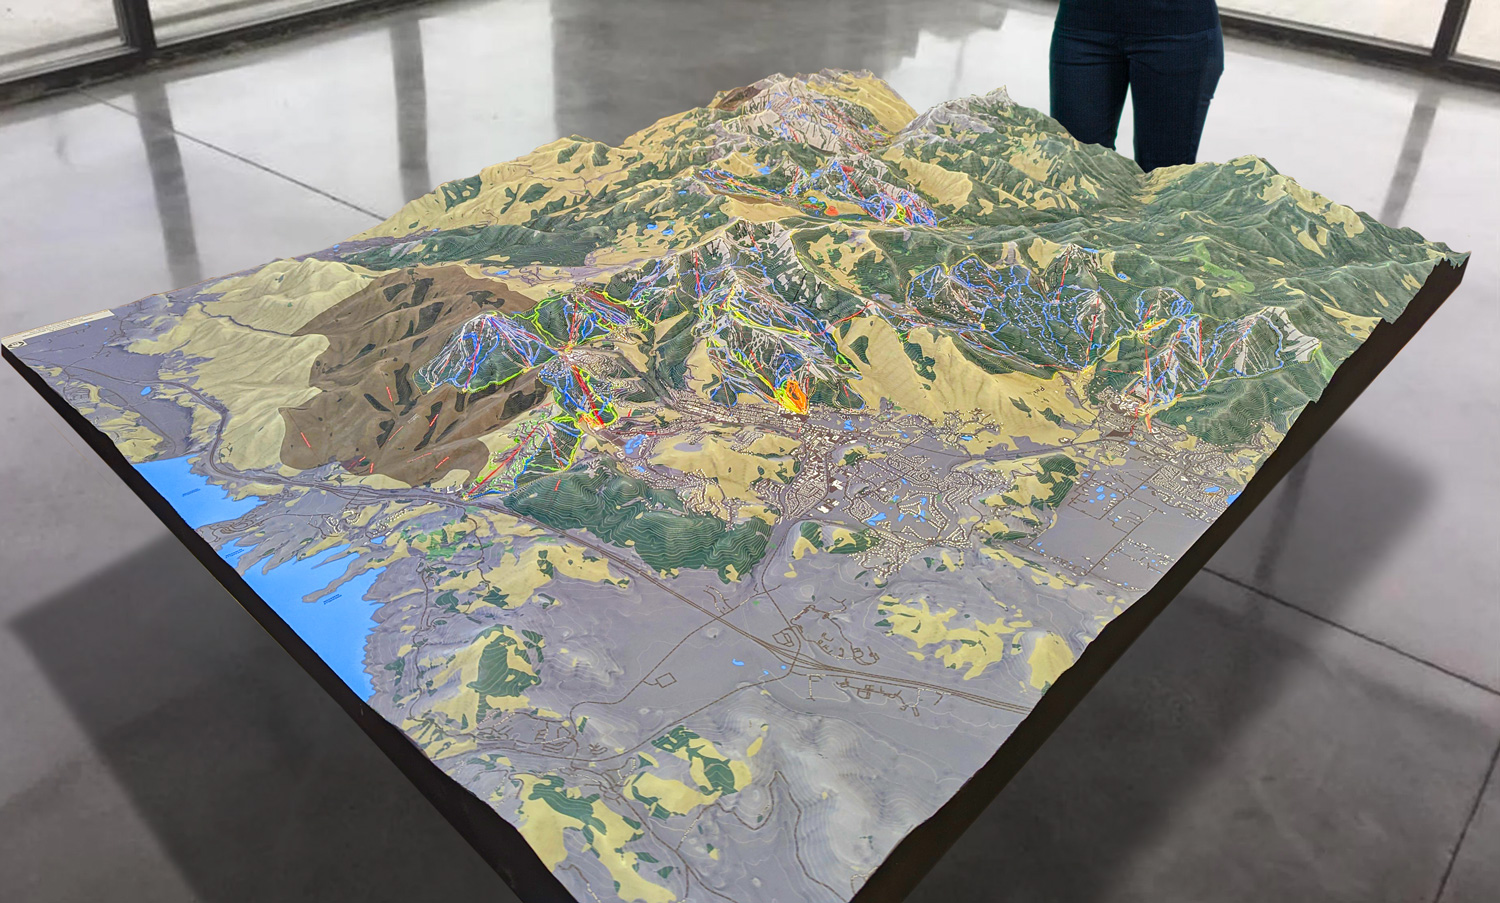
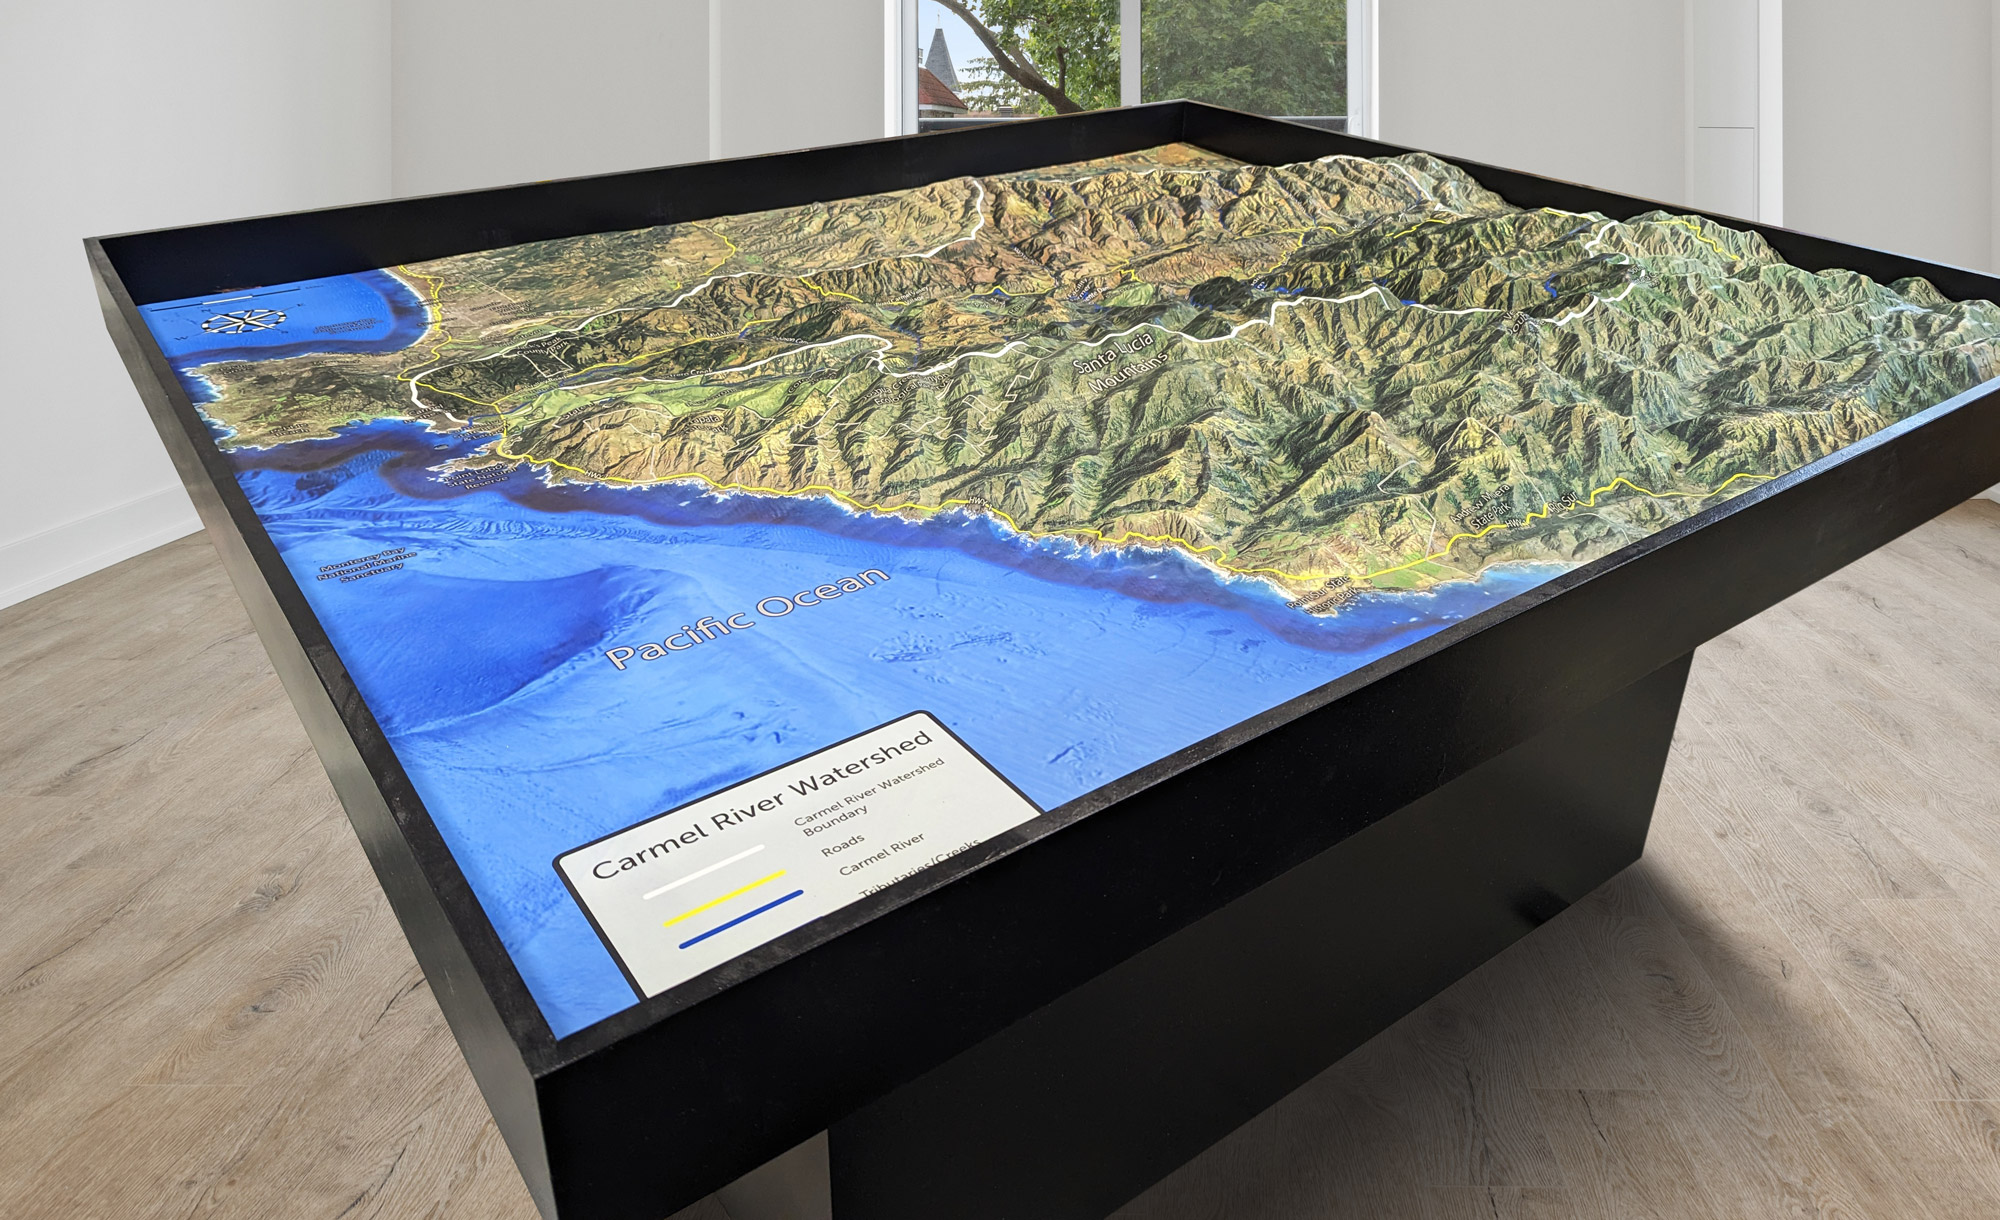
- Raised Relief Maps: Representation of land elevations with raised features indicating landforms.
- Terrain Maps: Representation of the physical features of a terrain or landmass.
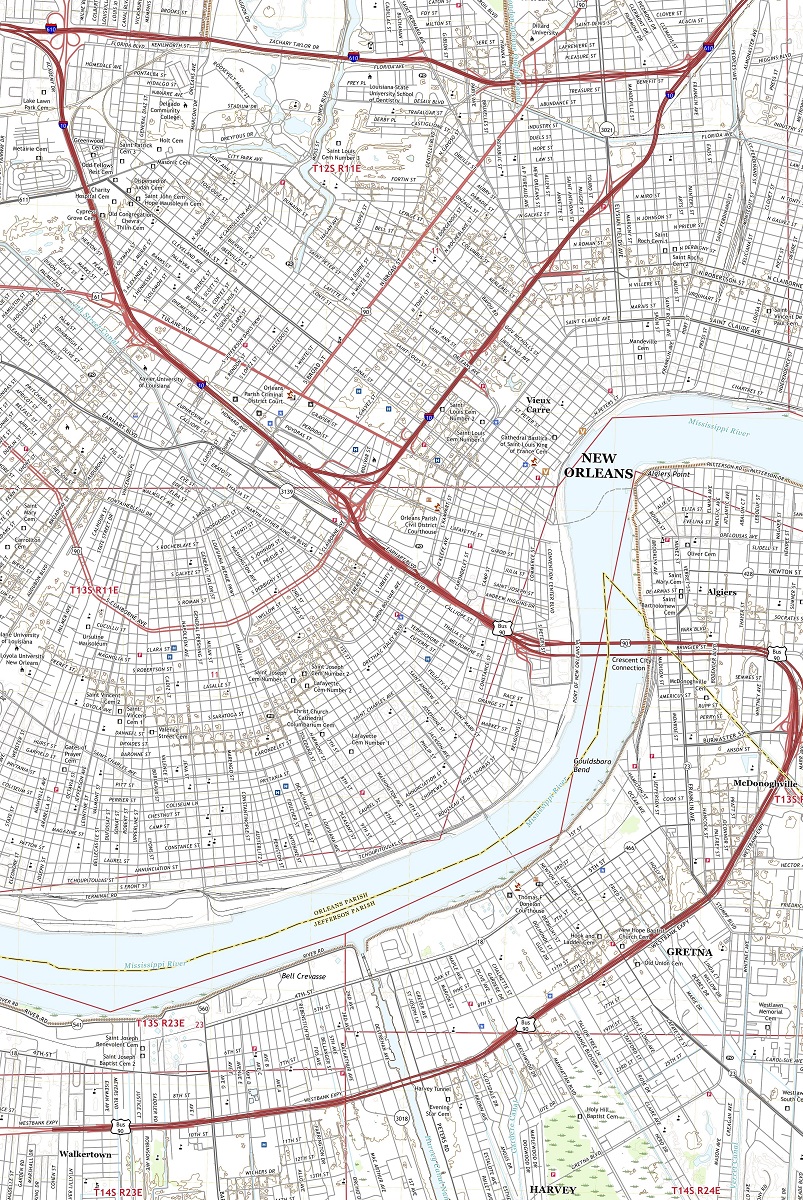
- USGS Topographic Maps: Representation of topographic features and land elevations based on USGS data.
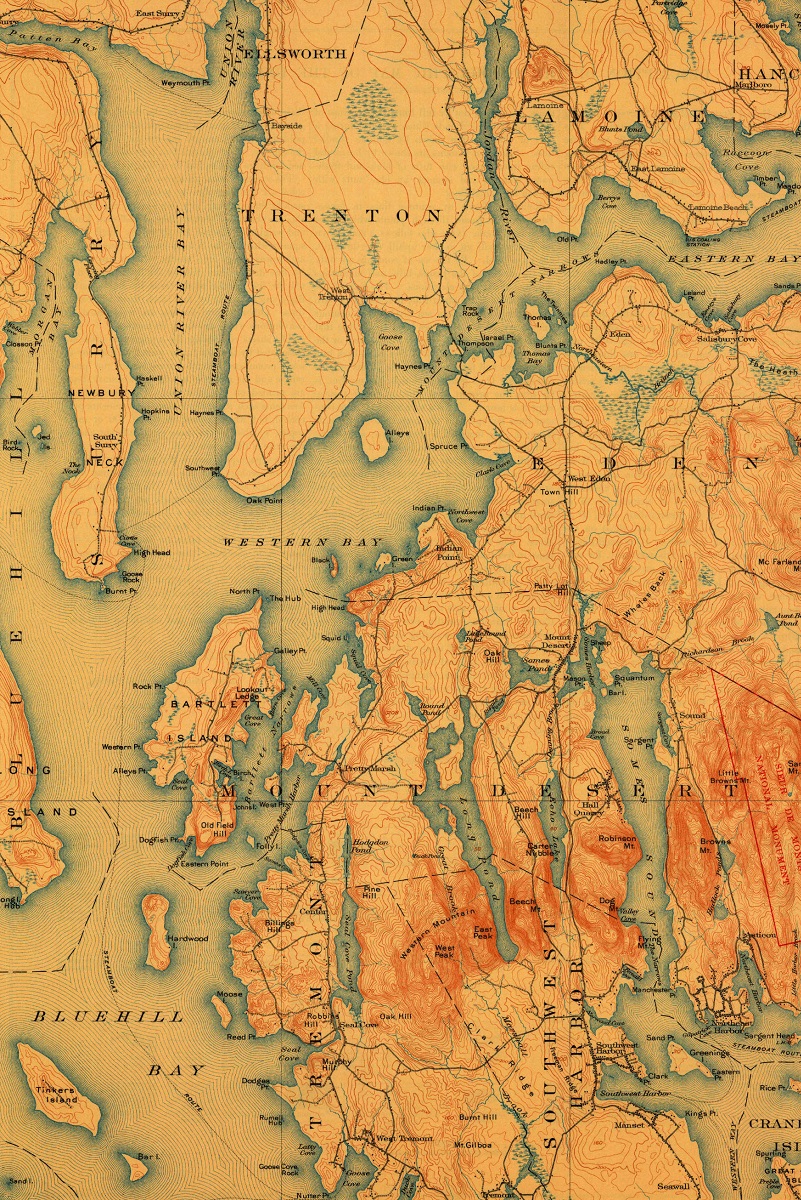
- USGS Historical Topographic Maps: Representation of historical topographic maps created by the USGS.
- Watershed Maps: Representation of the areas where water flows into a particular river or lake.
- Elevation Maps: Representation of land and water elevations with high precision.
- Physical Maps: Representation of physical features of the Earth’s surface such as landforms, oceans, and plateaus.
- Bathymetric Maps: Representation of the topography and features of the ocean floor.
- NOAA Maps: Representation of atmospheric, oceanographic, and environmental data by NOAA.
- Nautical Maps: Representation of the underwater features and depth of an area for navigation purposes.
- Geologic Maps: Representation of the geologic features of an area such as rock types, faults, and folds.
- Satellite Maps: Representation of earth from high-definition satellite imagery.
Contact us today to learn more about our services and how we can help you achieve your goals.