
What Is a Contour Map? How Contour Lines Show Elevation
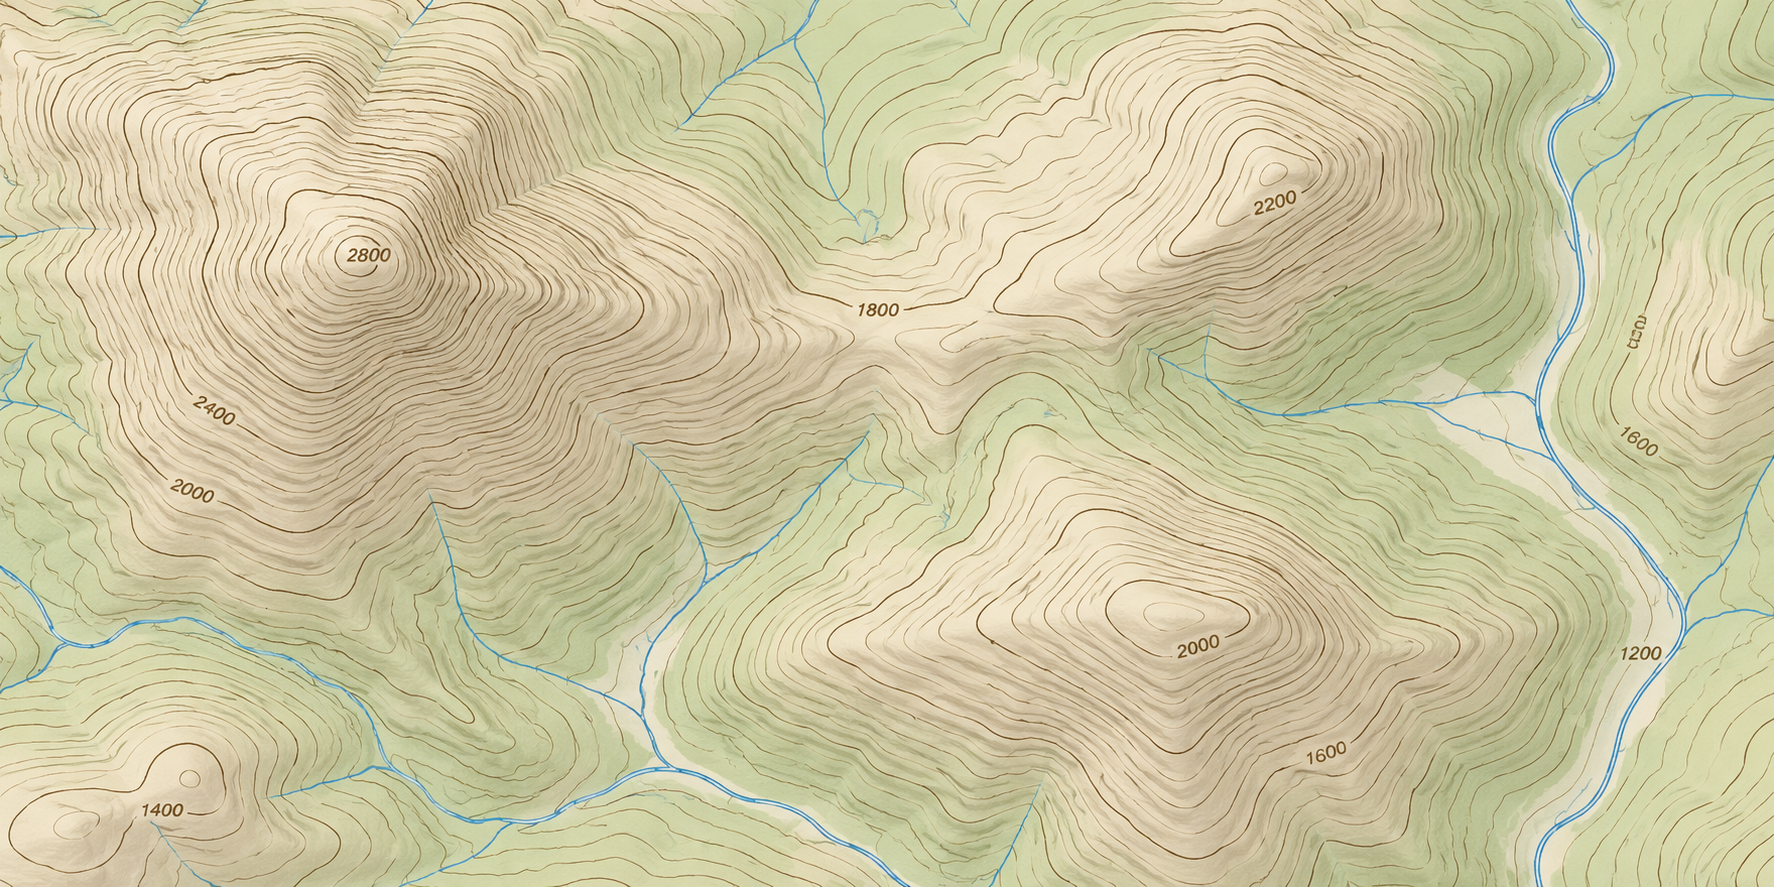
A contour map uses lines to show changes in elevation across a surface. Each contour line connects points at the same elevation relative to the map's stated reference surface. The pattern of those lines helps a reader understand whether terrain is relatively level, steep, rising, falling, or shaped into a recognizable landform.
The core idea: equal-elevation lines
A contour line connects locations with equal elevation. The map's contour interval states how much elevation changes between adjacent contour lines. Once the reference surface and interval are understood, the lines can be read as a compact way to describe the shape of the ground rather than as a simple outline of an object.
Contour interval controls the detail
The contour interval is the elevation difference between neighboring contour lines. A smaller interval can show more subtle changes when the source data and map scale support that level of detail. A larger interval can make a regional map easier to read while leaving some smaller changes unrepresented. The interval should be read from the map rather than assumed.
Spacing helps describe slope
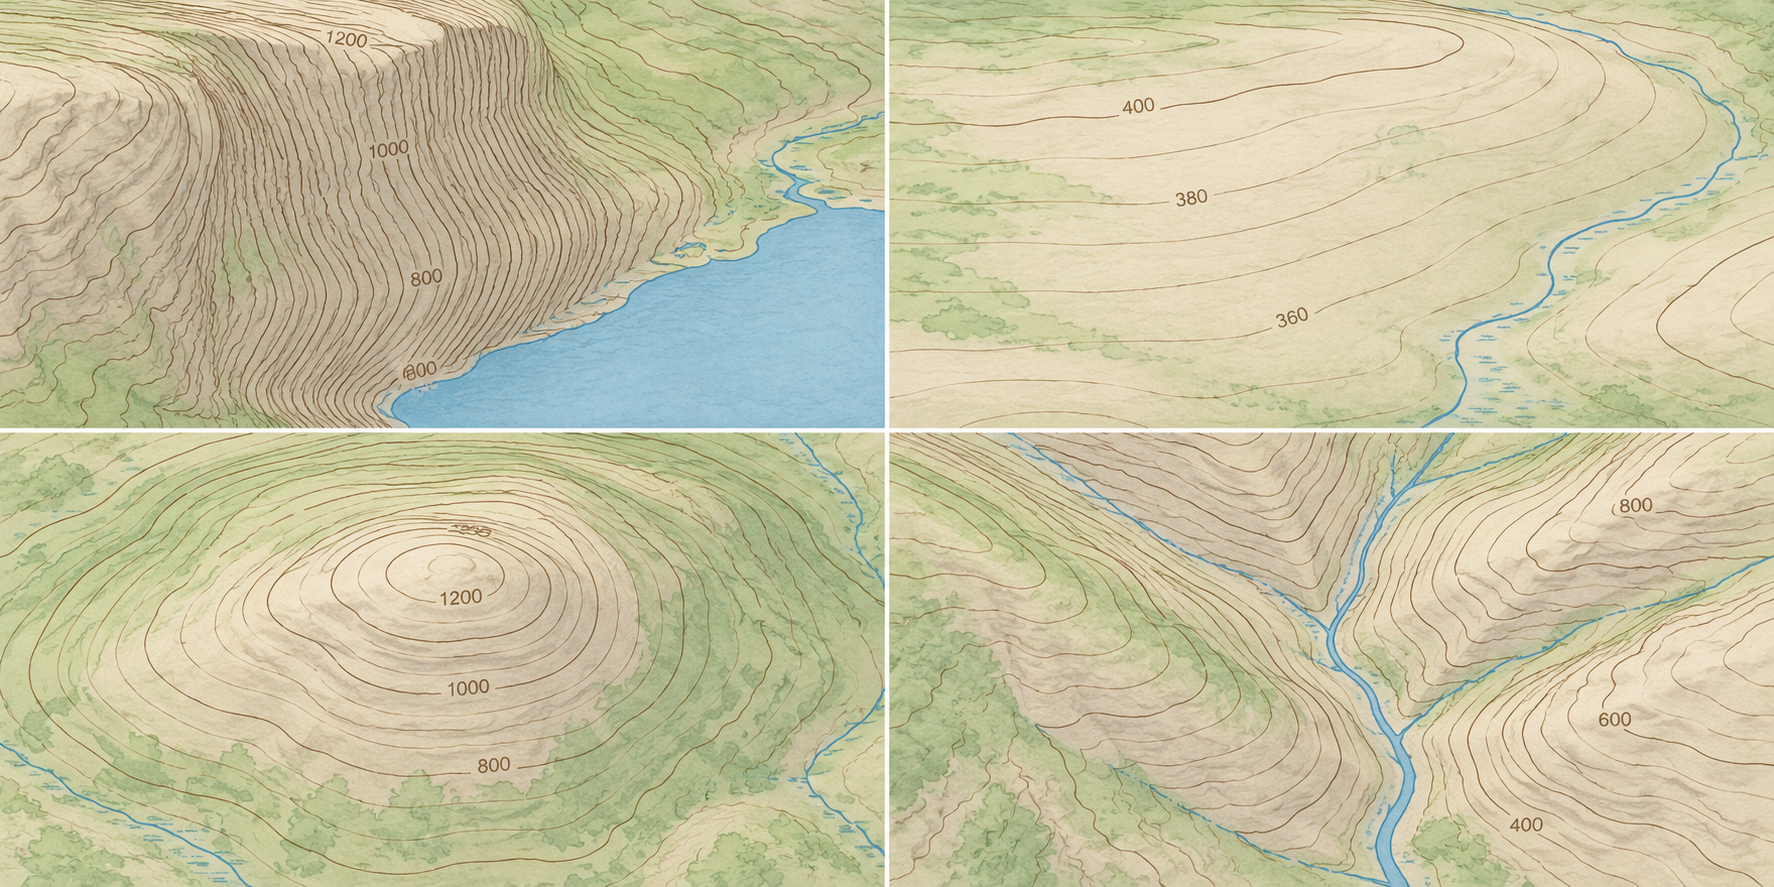
Contour spacing provides a visual clue about slope. Lines that are close together generally indicate a steeper change over a shorter horizontal distance, while lines farther apart generally indicate a gentler change. The conclusion still depends on the map scale, interval, data quality, and the part of the terrain being interpreted.
Read the overall shape, not one line in isolation
A useful reading combines the direction, spacing, continuity, and grouping of several contour lines. Closed or nested patterns, broad bands, narrow corridors, ridges, valleys, and other forms can become clearer when the whole area is viewed together. Labels, spot elevations, symbols, and the map's legend help keep the interpretation tied to the actual source.
Contour maps and topographic maps
Contour lines are one of the main ways a topographic map communicates elevation, but a topographic map can also include roads, water, structures, boundaries, vegetation, and other mapped features. A contour-only drawing may focus on the terrain surface, while a broader topographic map places elevation information in a fuller geographic context.
What contour lines cannot tell you by themselves
Contour lines do not replace the map legend, scale, source notes, or other data needed to interpret a site responsibly. They do not automatically provide an engineering design, a current property survey, or a complete description of every small feature. Use the source map and qualified project professionals for decisions that depend on precise site conditions.
How contour data becomes a physical terrain model
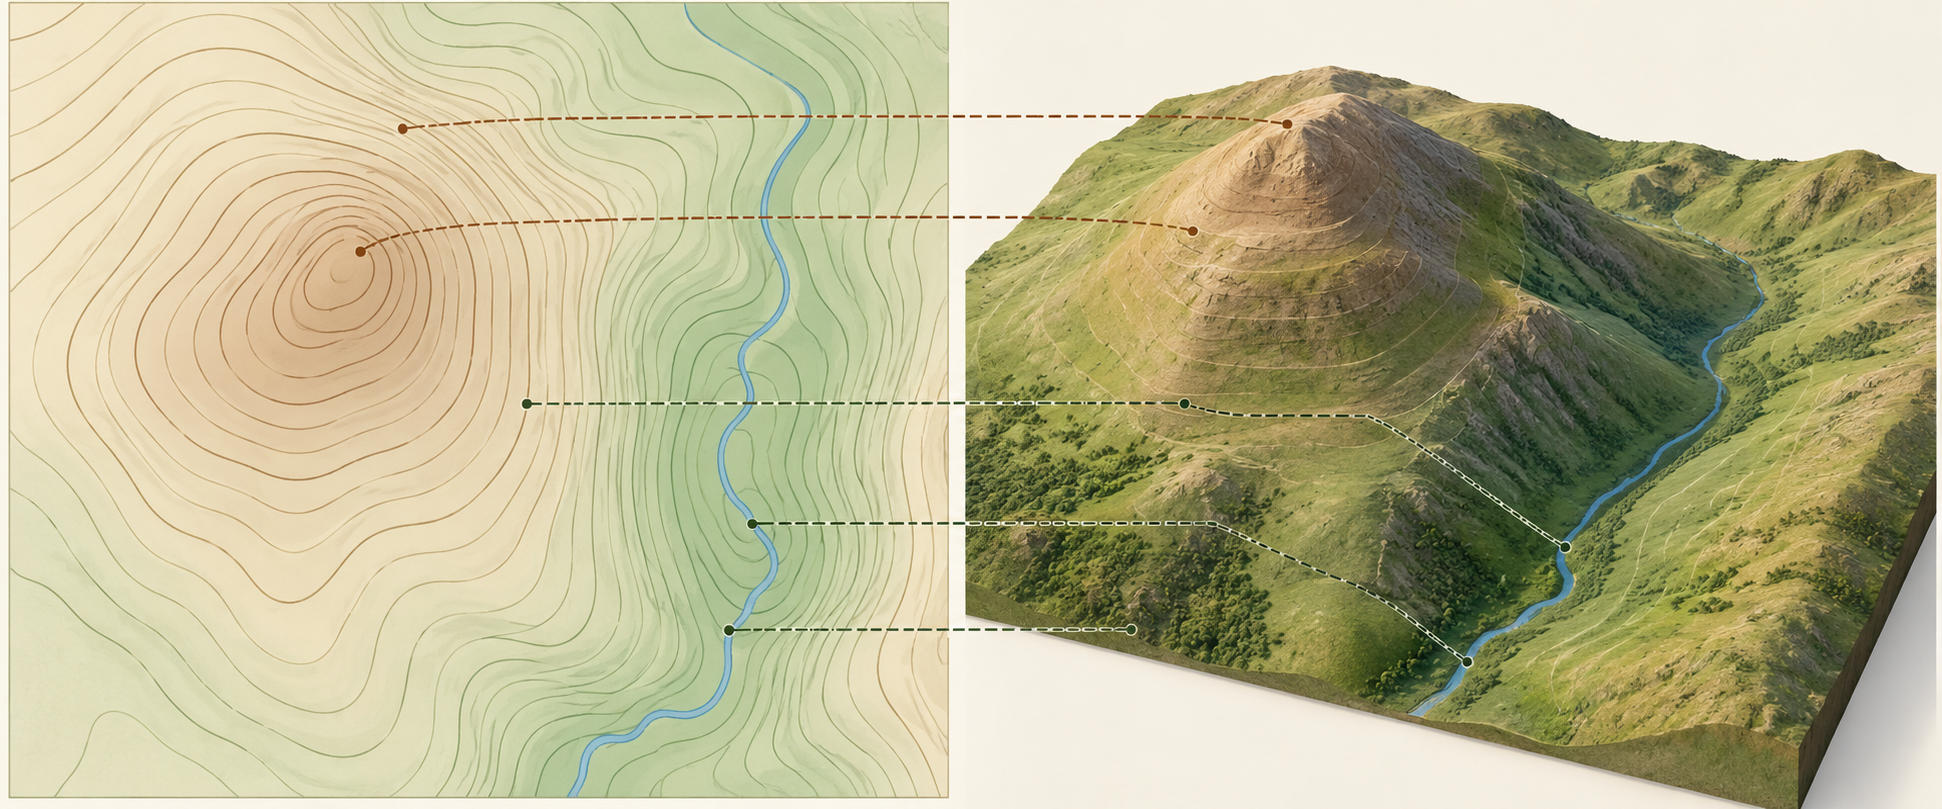
A physical 3D model can translate selected contour and elevation data into a surface that people can inspect from above and around the display. The brief should identify the geographic extent, vertical scale or exaggeration, contour interval or source data, labels, boundaries, finish, mounting, and intended audience. The physical model should explain the chosen information clearly without pretending to replace the source map.
Contour maps and physical 3D map projects
Physical terrain models are useful when a school, museum, public agency, planning group, visitor center, or other organization wants a tangible way to discuss landform and elevation. WhiteClouds can review the source files, geographic scope, display setting, target dimensions, and labeling through the topographical models service. For a fabrication-focused discussion, see the contour maps article.
Common questions
Do close contour lines always mean a cliff?
Close spacing generally indicates a steep change in elevation, but the map scale, interval, data quality, and the size of the mapped area still matter. Read the legend and surrounding contour pattern before drawing a more specific conclusion.
What is a contour interval?
It is the elevation difference between adjacent contour lines on a map. The interval is part of the map's information and should be checked before comparing line patterns or estimating relief.
Can contour data be used for a 3D model?
Yes, when the source data is suitable for the intended geographic area, scale, and display purpose. The project team still needs to decide how to handle vertical scale, labels, boundaries, color, mounting, and the difference between a physical interpretation and a precise survey product.
Plan a physical contour map with WhiteClouds
Share the source map or elevation data, geographic extent, target dimensions, vertical-scale preference, display setting, labeling needs, and schedule through the topographical models service. The topographical models gallery shows related physical terrain-display work.
Related contour map resources
Explore custom topographical models and physical terrain displays while you plan elevation data, relief, labels, dimensions, and presentation.
Custom 3D Map Quote
Share the size, placement, finish, timing, and reference files available for your project.