Physical Maps
What is a Physical Map?
We build 2D and 3D Physical Maps
Table of Contents
Physical Maps
The art of cartography has come a long way since the days of ancient explorers mapping the uncharted territories of the world. Today, we have access to advanced technologies and techniques that allow us to create highly detailed and accurate representations of the world around us. One such technique is the creation of physical maps, which offer a unique and compelling way to visualize the topography of a particular area.
Unlike traditional maps, which present a two-dimensional representation of the earth’s surface, physical maps use shading and contour lines to convey the three-dimensional features of the land. By highlighting the peaks and valleys, rivers and lakes, and other natural features of a particular area, physical maps offer a more immersive and accurate view of the world around us.
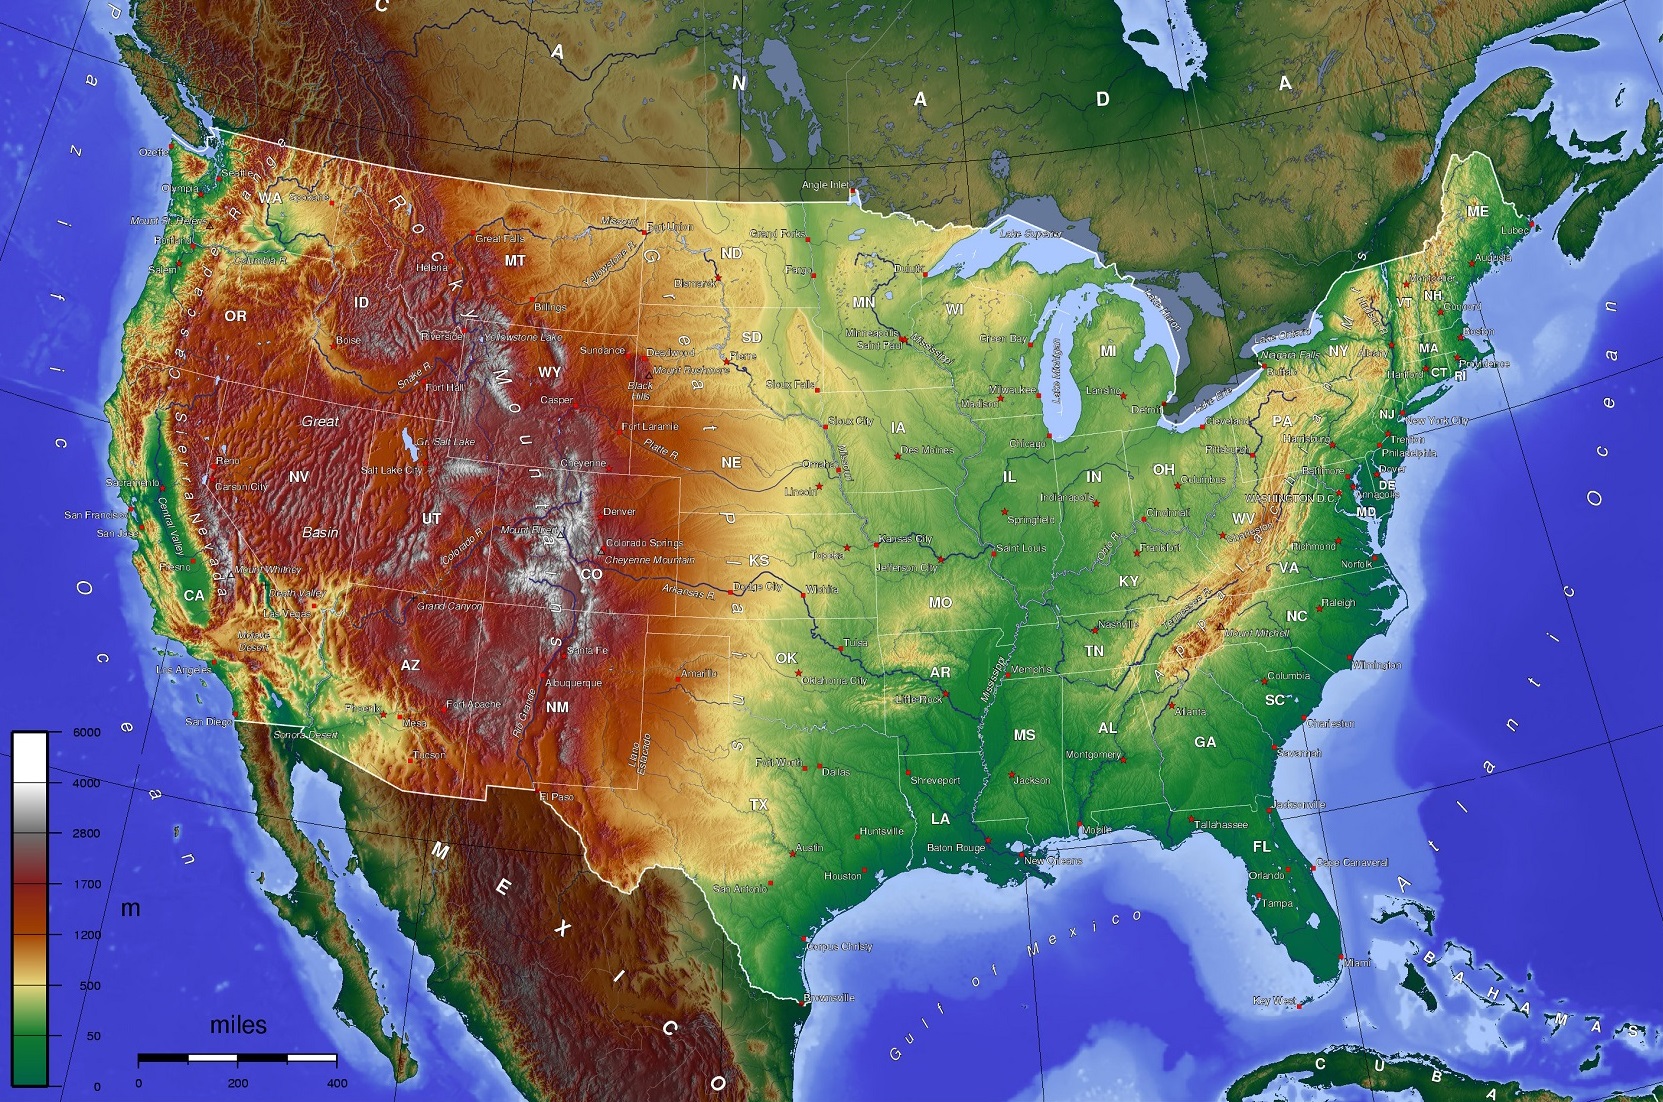
But physical maps are more than just a tool for geographers and cartographers. They are also a source of inspiration and wonder, revealing the incredible beauty and complexity of the natural world. Whether exploring the rugged terrain of the Rocky Mountains, rolling hills of Tuscany, rugged cliffs of the Pacific Northwest, or towering peaks of the Alps, physical maps invite us to experience the majesty of the natural world in a whole new way.
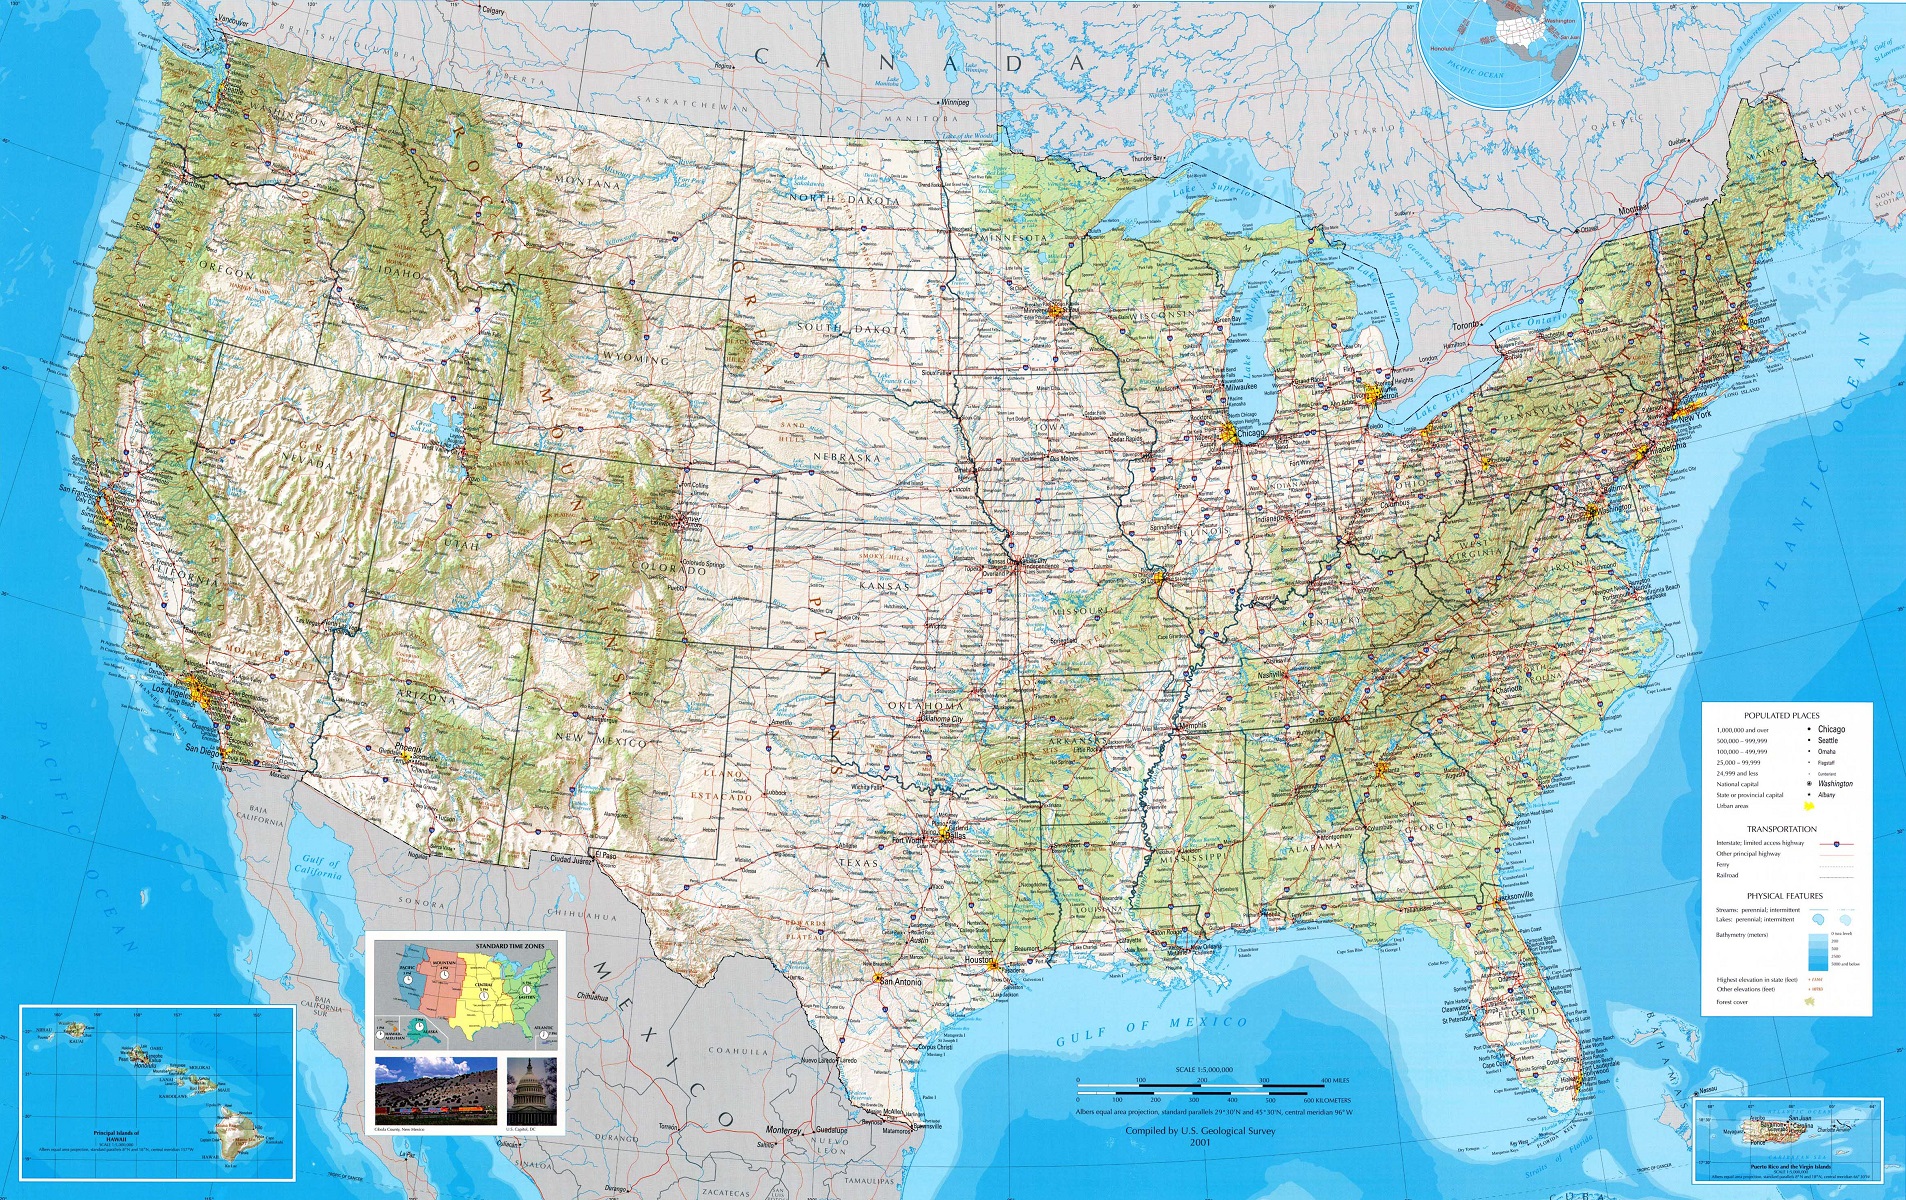
Two-dimensional physical maps have become increasingly popular over the years due to their ability to provide an accurate representation of the topography of a particular area. They are a valuable tool in a variety of fields, from urban planning to emergency response, and offer a unique and compelling way to visualize the world around us. Let’s explore some of the many uses of physical maps and how they are changing the way we view and interact with the world.
- Urban Planning: One of the most common uses of physical maps is in urban planning. City planners use physical maps to visualize the topography and other natural features of a particular area, such as rivers, lakes, and hills. By doing so, they can design infrastructure projects that take into account the unique characteristics of the landscape, such as building highways and bridges that follow the contours of the land rather than cutting straight through it. This helps to create more sustainable and functional cities that work in harmony with the natural environment.
- Architecture: In addition to urban planning, architects also use physical maps to plan and design buildings that are in harmony with the landscape. They can use the maps to identify areas that are prone to flooding or other natural disasters, and design structures that are better able to withstand these events. Additionally, architects can use physical maps to design buildings that fit seamlessly into the landscape, creating structures that blend in with their surroundings and enhance the natural beauty of the area.
- Environmental Science: Physical maps are also valuable tools for environmental scientists. They use the maps to identify areas that are at risk of erosion or other environmental degradation, and design projects to protect and restore these areas. Additionally, physical maps can be used to identify areas of high biodiversity, which can help scientists to prioritize conservation efforts.
- Emergency Response: In emergency situations, such as natural disasters or search and rescue operations, physical maps can be invaluable tools for emergency responders. Physical maps can help to identify the best routes for rescue teams to take, highlighting areas that are too steep or too dangerous to navigate. Additionally, physical maps can help to identify areas that are at risk of flooding or other natural disasters, allowing emergency responders to plan and execute evacuation plans more effectively.
- Geology: Geologists also use physical maps to study the earth’s crust and identify geological formations. Physical maps can help geologists to identify areas that are prone to earthquakes, landslides, and other natural disasters, allowing them to develop strategies to mitigate the risk of these events. Additionally, physical maps can help geologists to identify areas of mineral deposits or other natural resources, which can inform decisions about mining and other resource extraction activities.
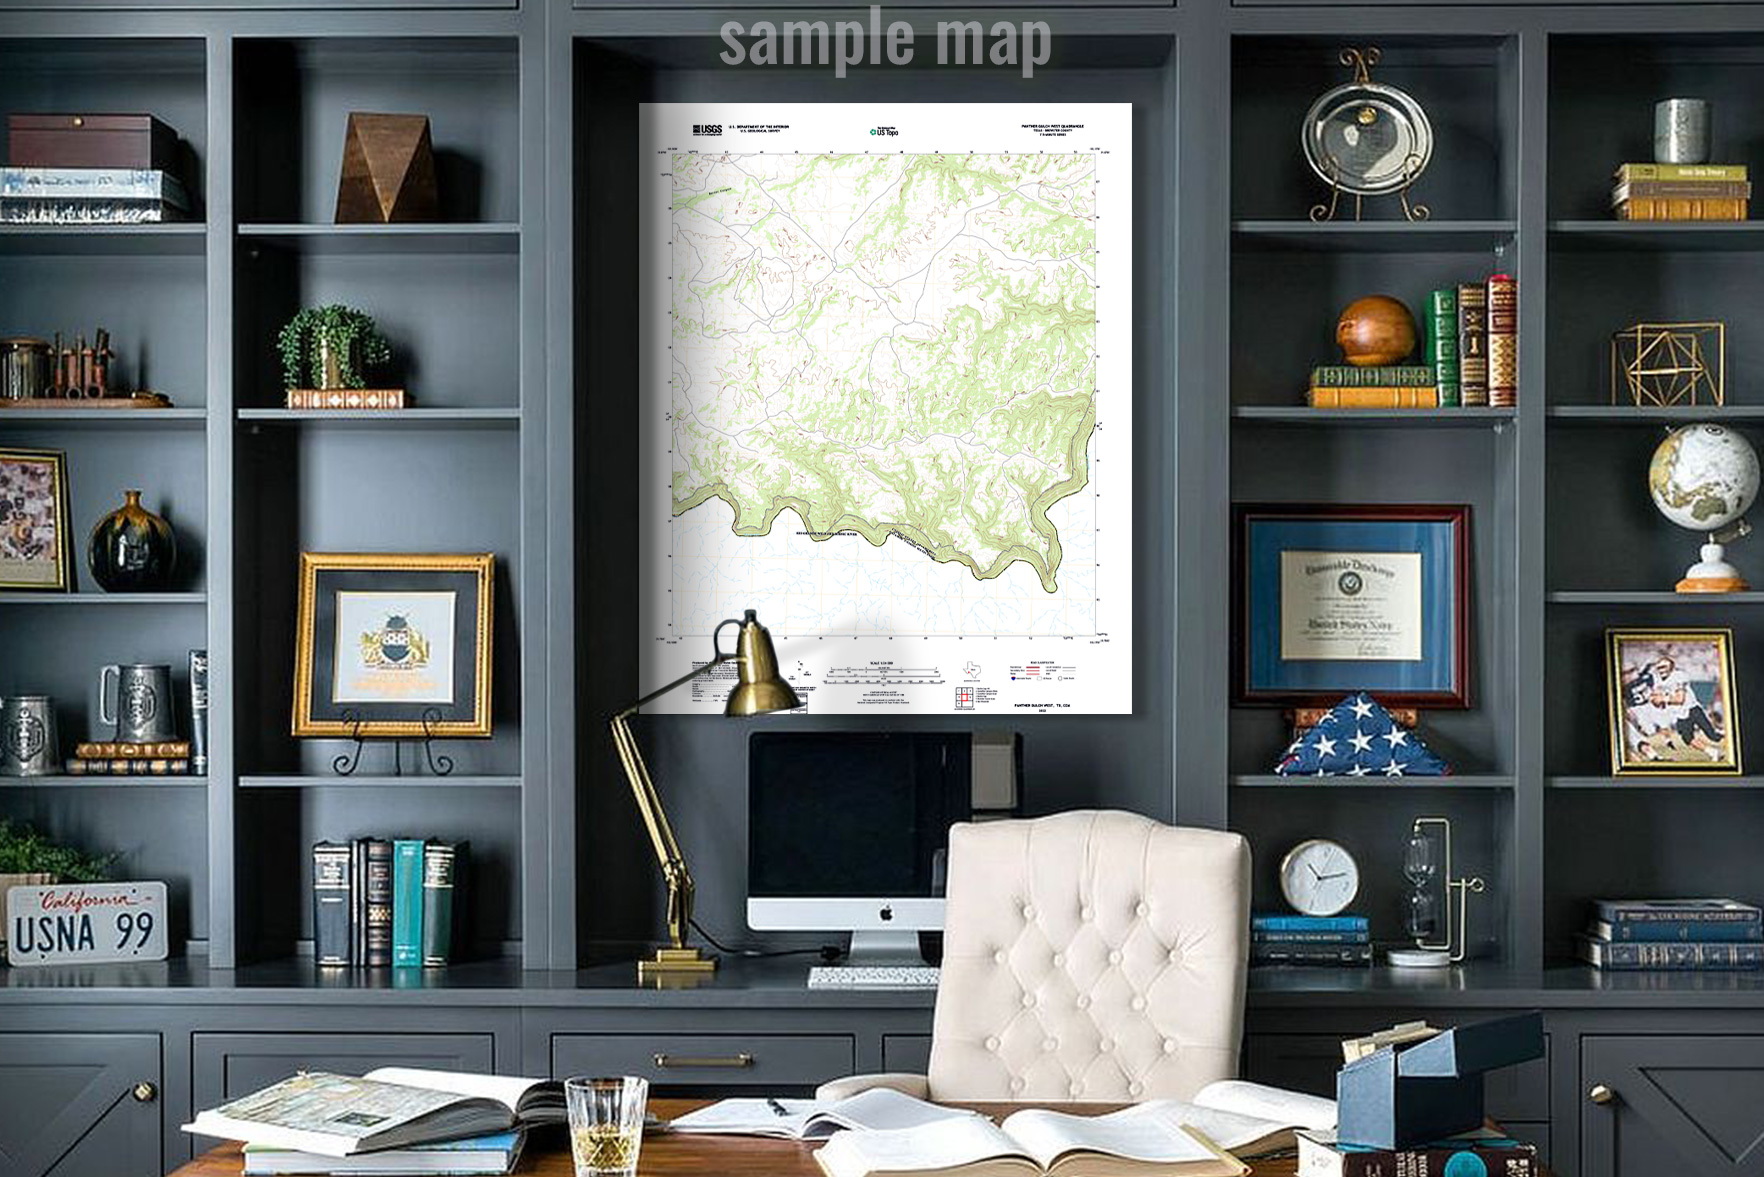
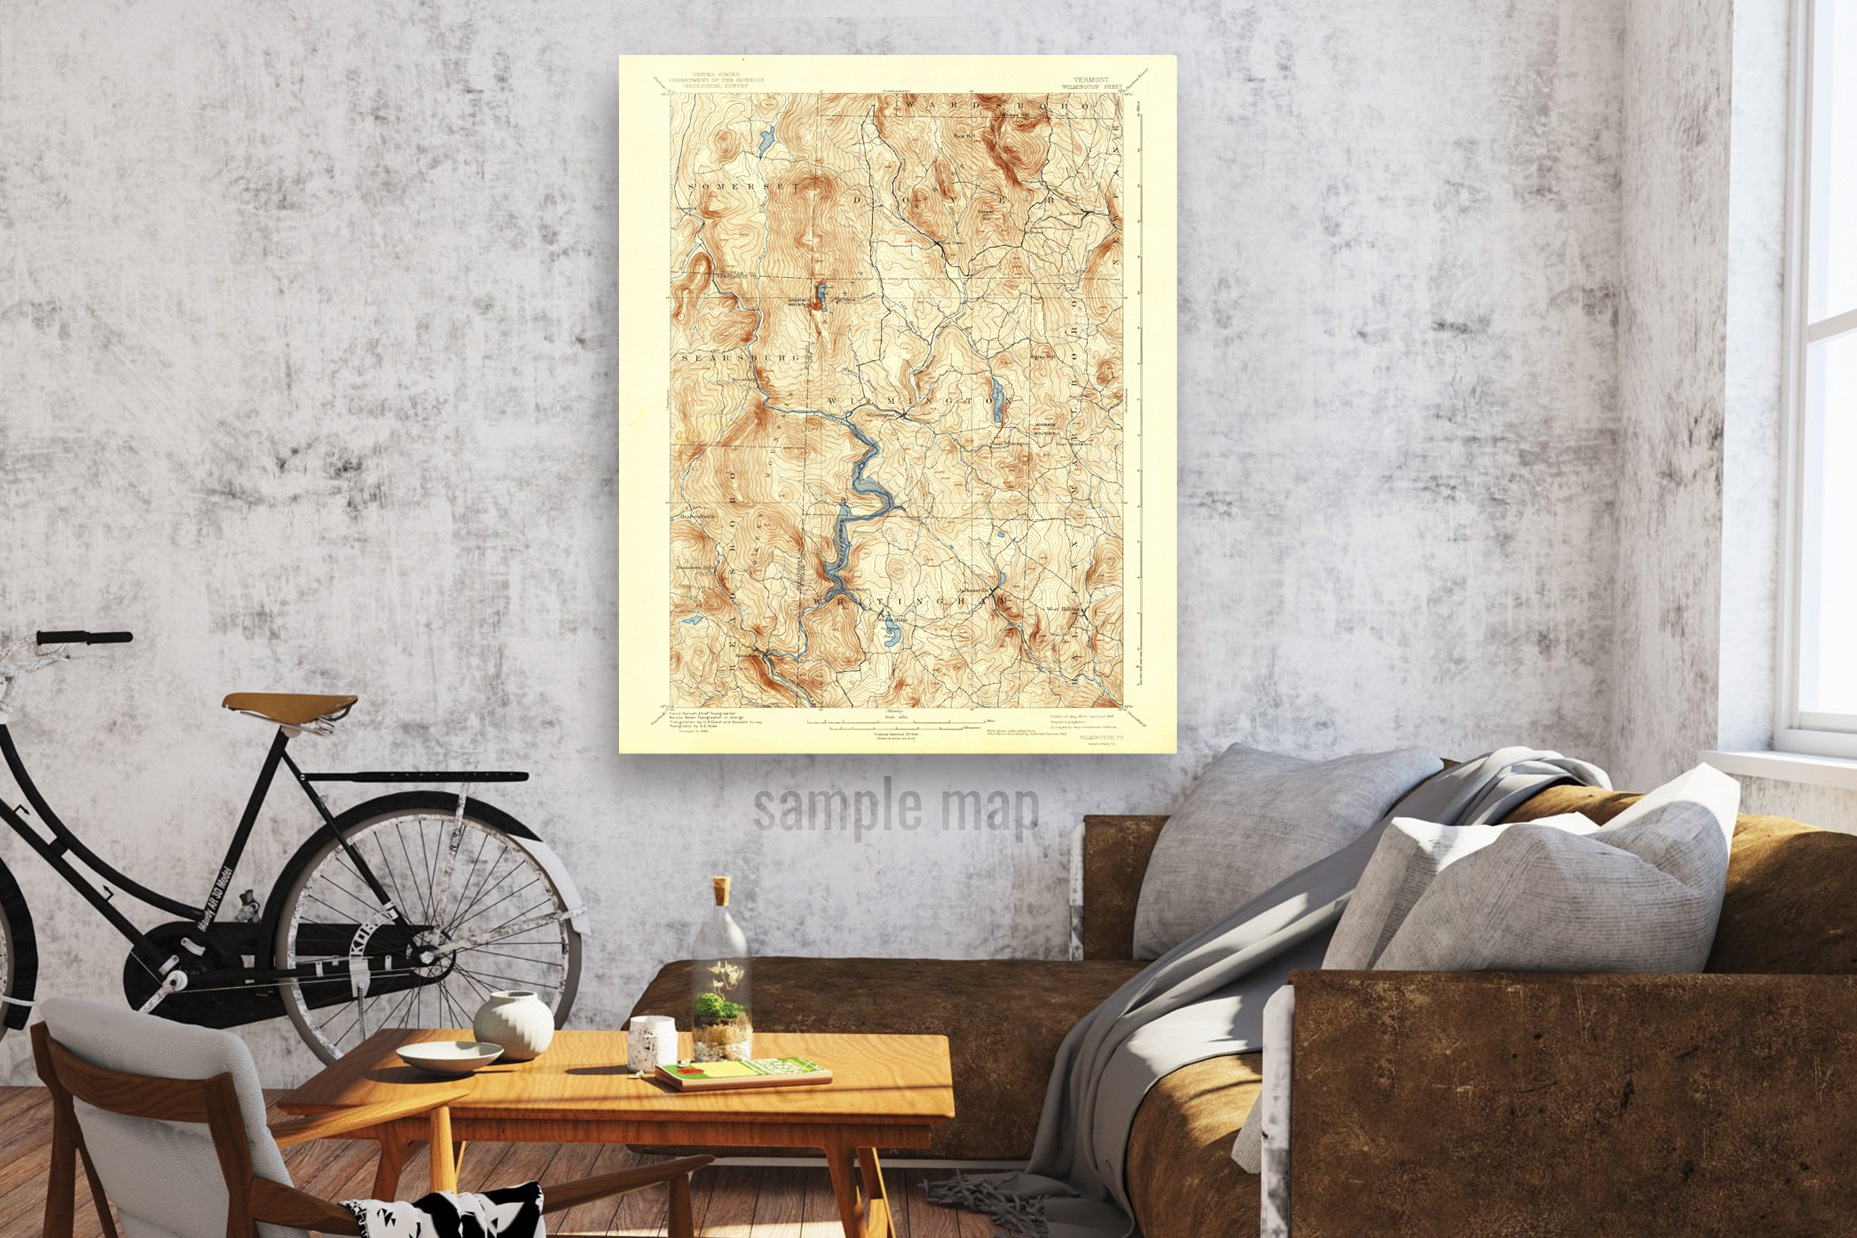
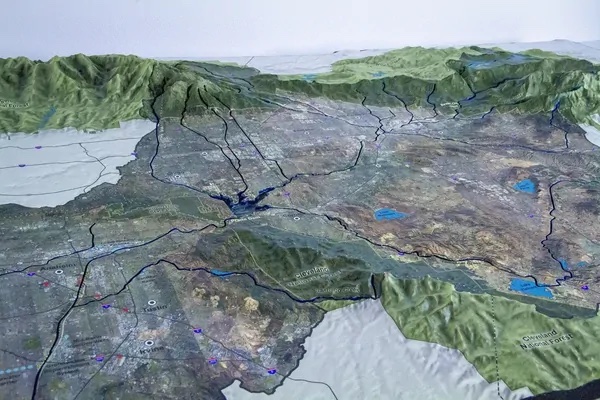
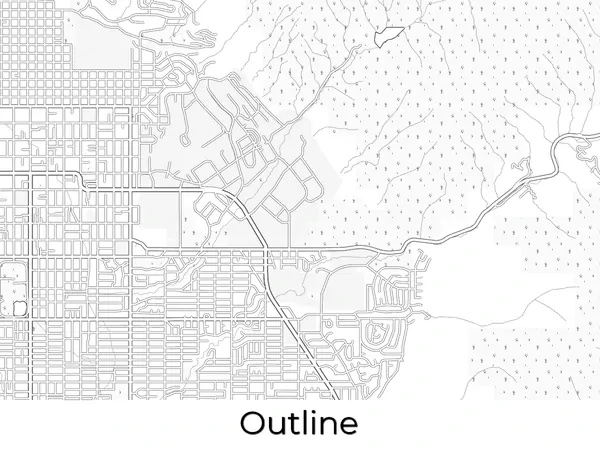
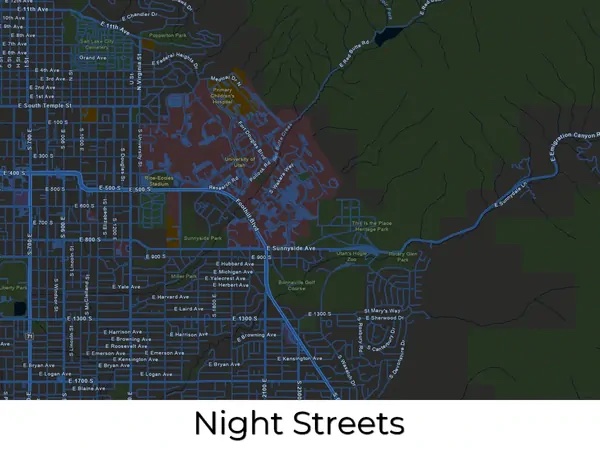
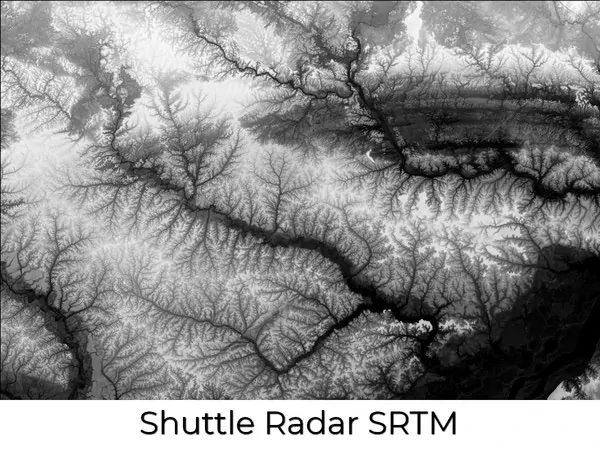
Sample 2D Physical Maps
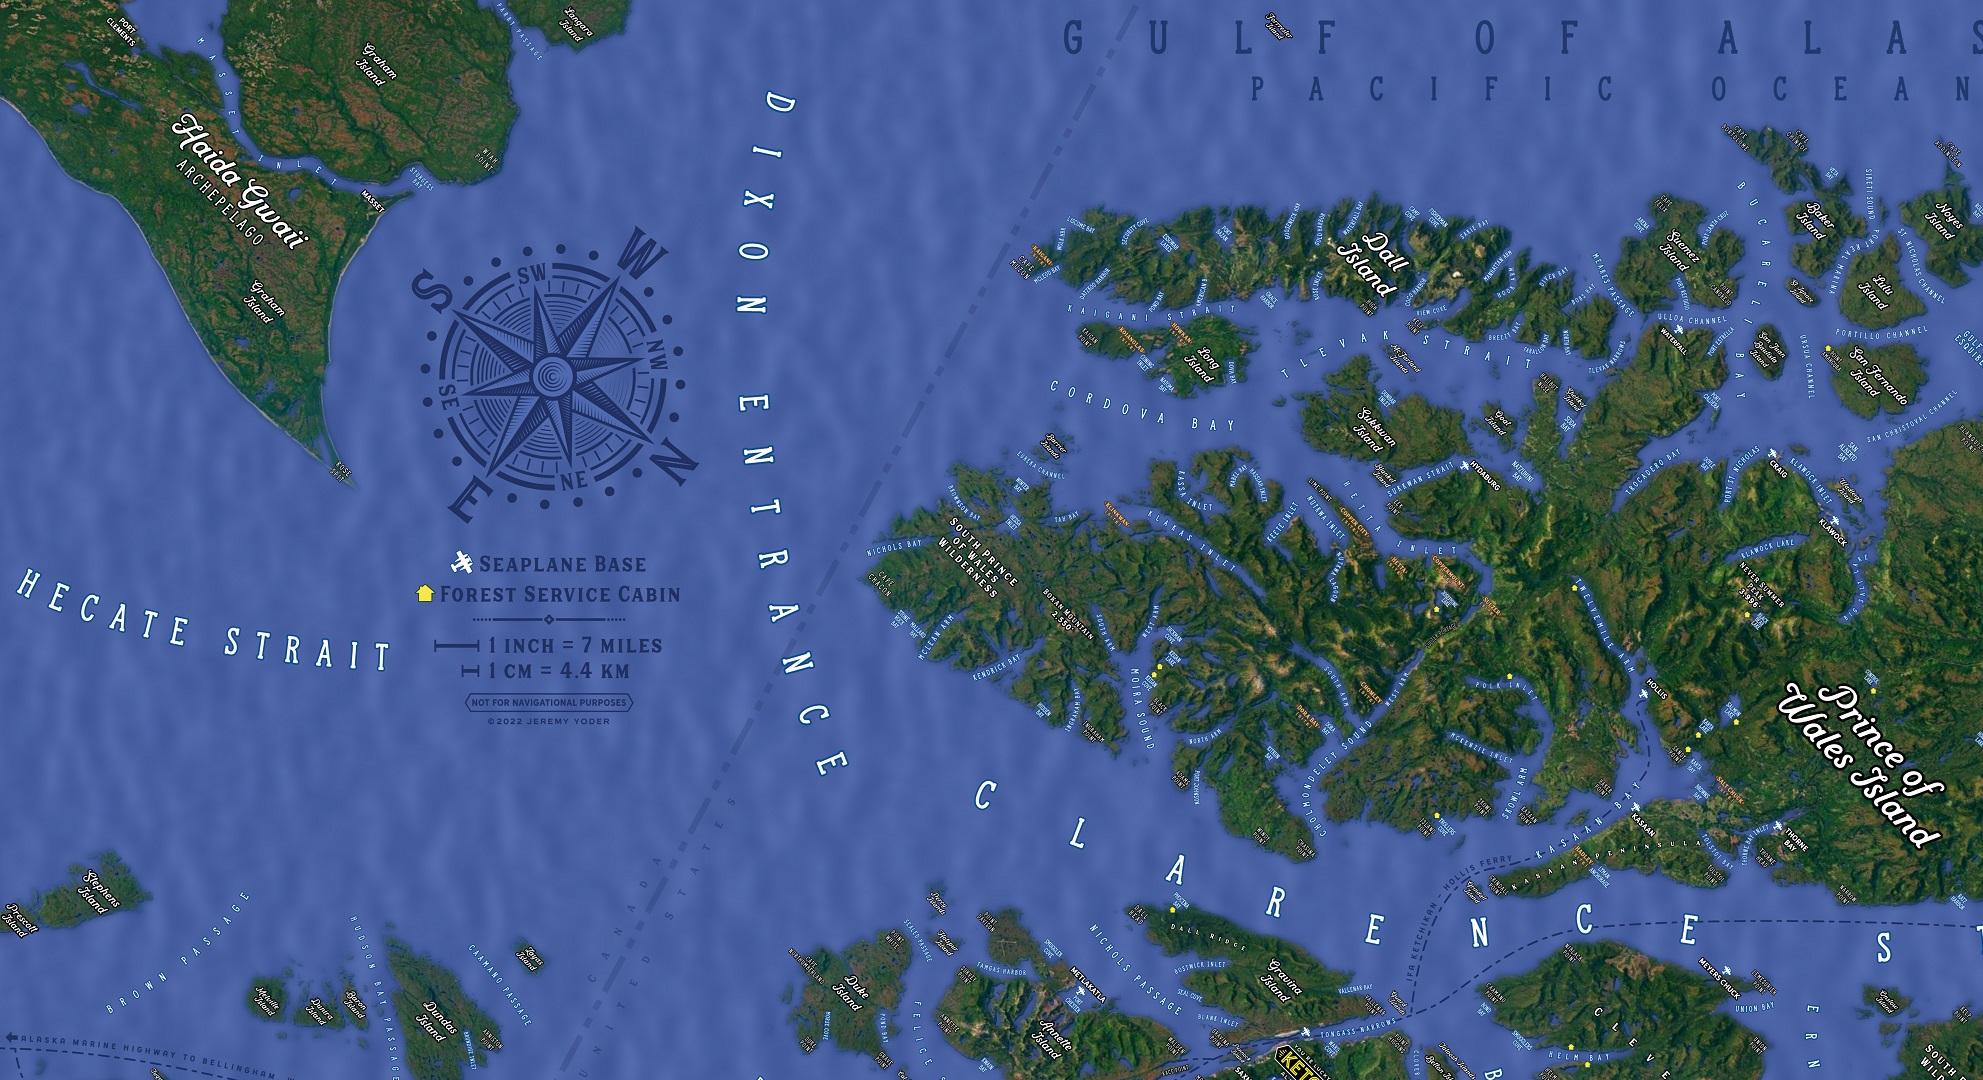
Physical maps are a powerful tool for visualizing the topography of a particular area. Unlike traditional maps, which present a two-dimensional representation of the earth’s surface, physical maps use shading and contour lines to convey the three-dimensional features of the land. Listed below are some of the features of physical maps and how they are used to create accurate and immersive representations of the natural world.
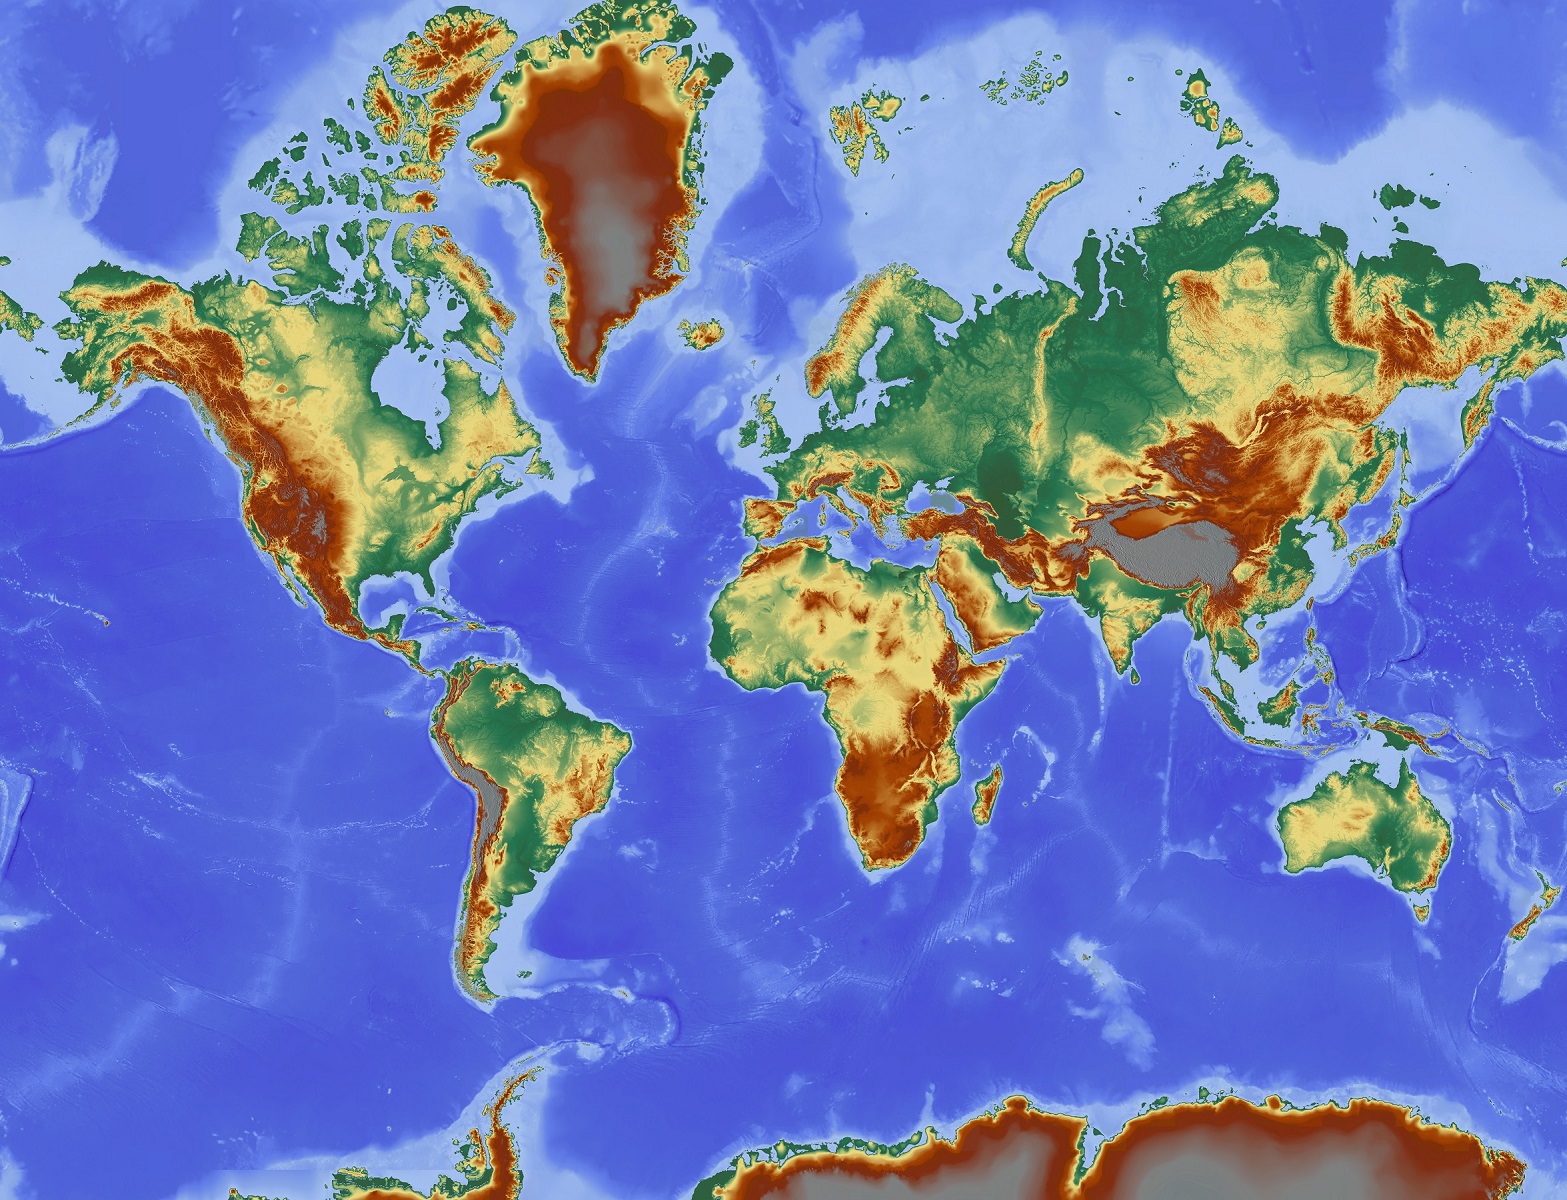
- Shading: One of the most distinctive features of physical maps is the use of shading to convey the topography of a particular area. Shading is typically used to show the direction of the light source, creating the illusion of shadows and highlights that help to make the terrain look three-dimensional. By using shading, physical maps can create a more realistic and immersive representation of the landscape, giving viewers a better sense of the shape and character of the terrain.
- Color: Another important feature of physical maps is the use of color. Color is often used to differentiate between different types of terrain, such as forests, rivers, and mountains. This can help viewers to better understand the natural features of a particular area, and can also make the map more visually appealing. Additionally, color can be used to highlight specific features, such as a particular mountain peak or river delta.
- Scale: Like all maps, physical maps use a scale to convey the size and distance of the terrain being represented. The scale of a map is typically shown in the form of a ratio, such as 1:10,000, which indicates that one unit on the map represents 10,000 units on the ground. By using a scale, physical maps can provide an accurate representation of the size and shape of the terrain being represented, allowing viewers to better understand the relationships between different features.
By using the above features, physical maps can convey the three-dimensional features of the land in a way that traditional maps cannot, helping viewers to better understand the shape, character, and natural features of a particular area. As technology continues to advance, physical maps will only become more sophisticated and more widely used, helping us to better understand and appreciate the natural world around us.
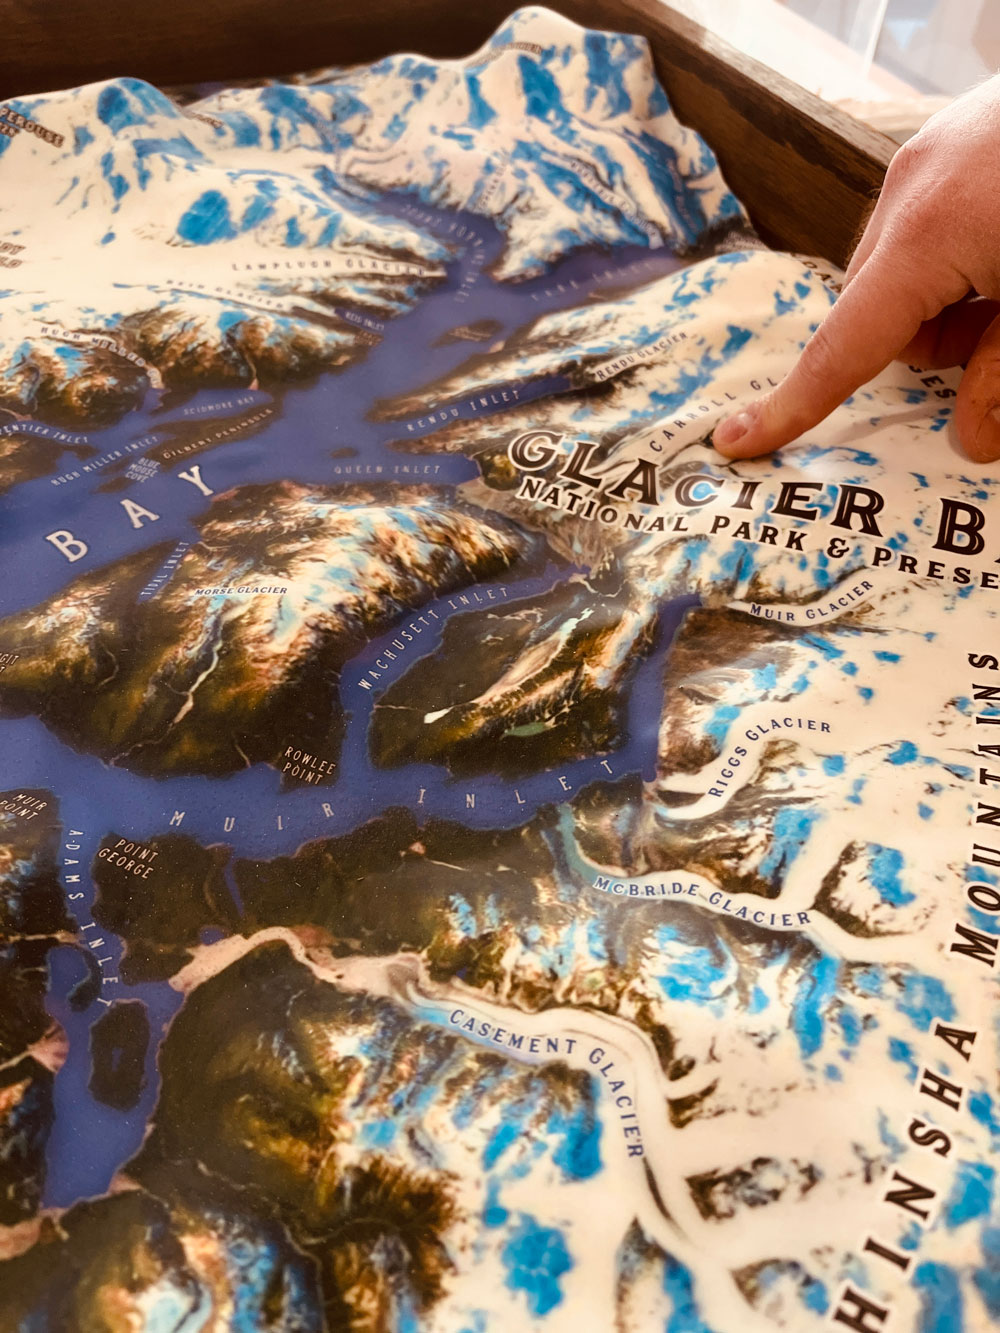
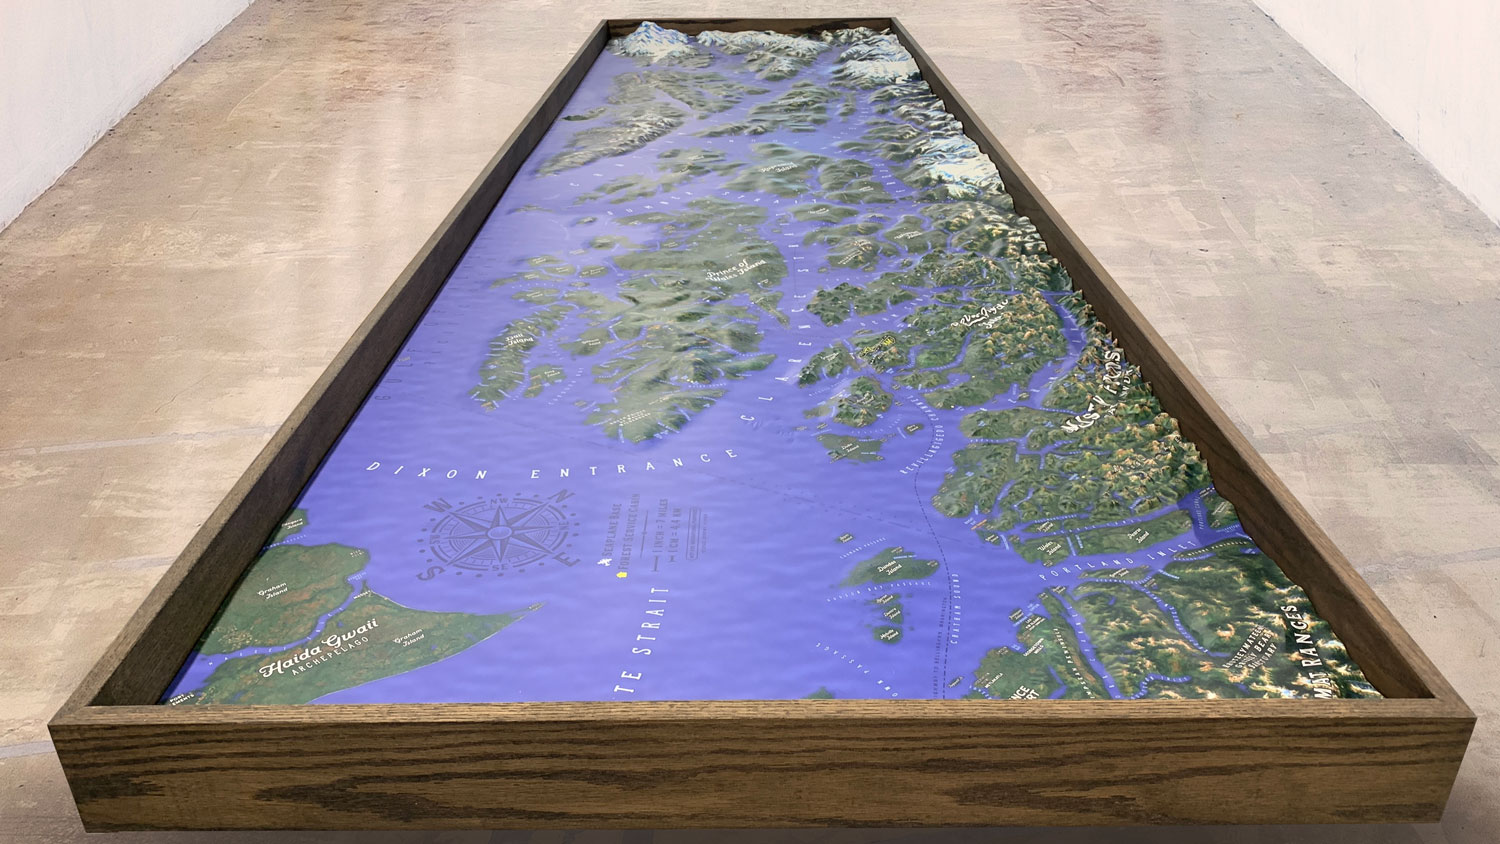
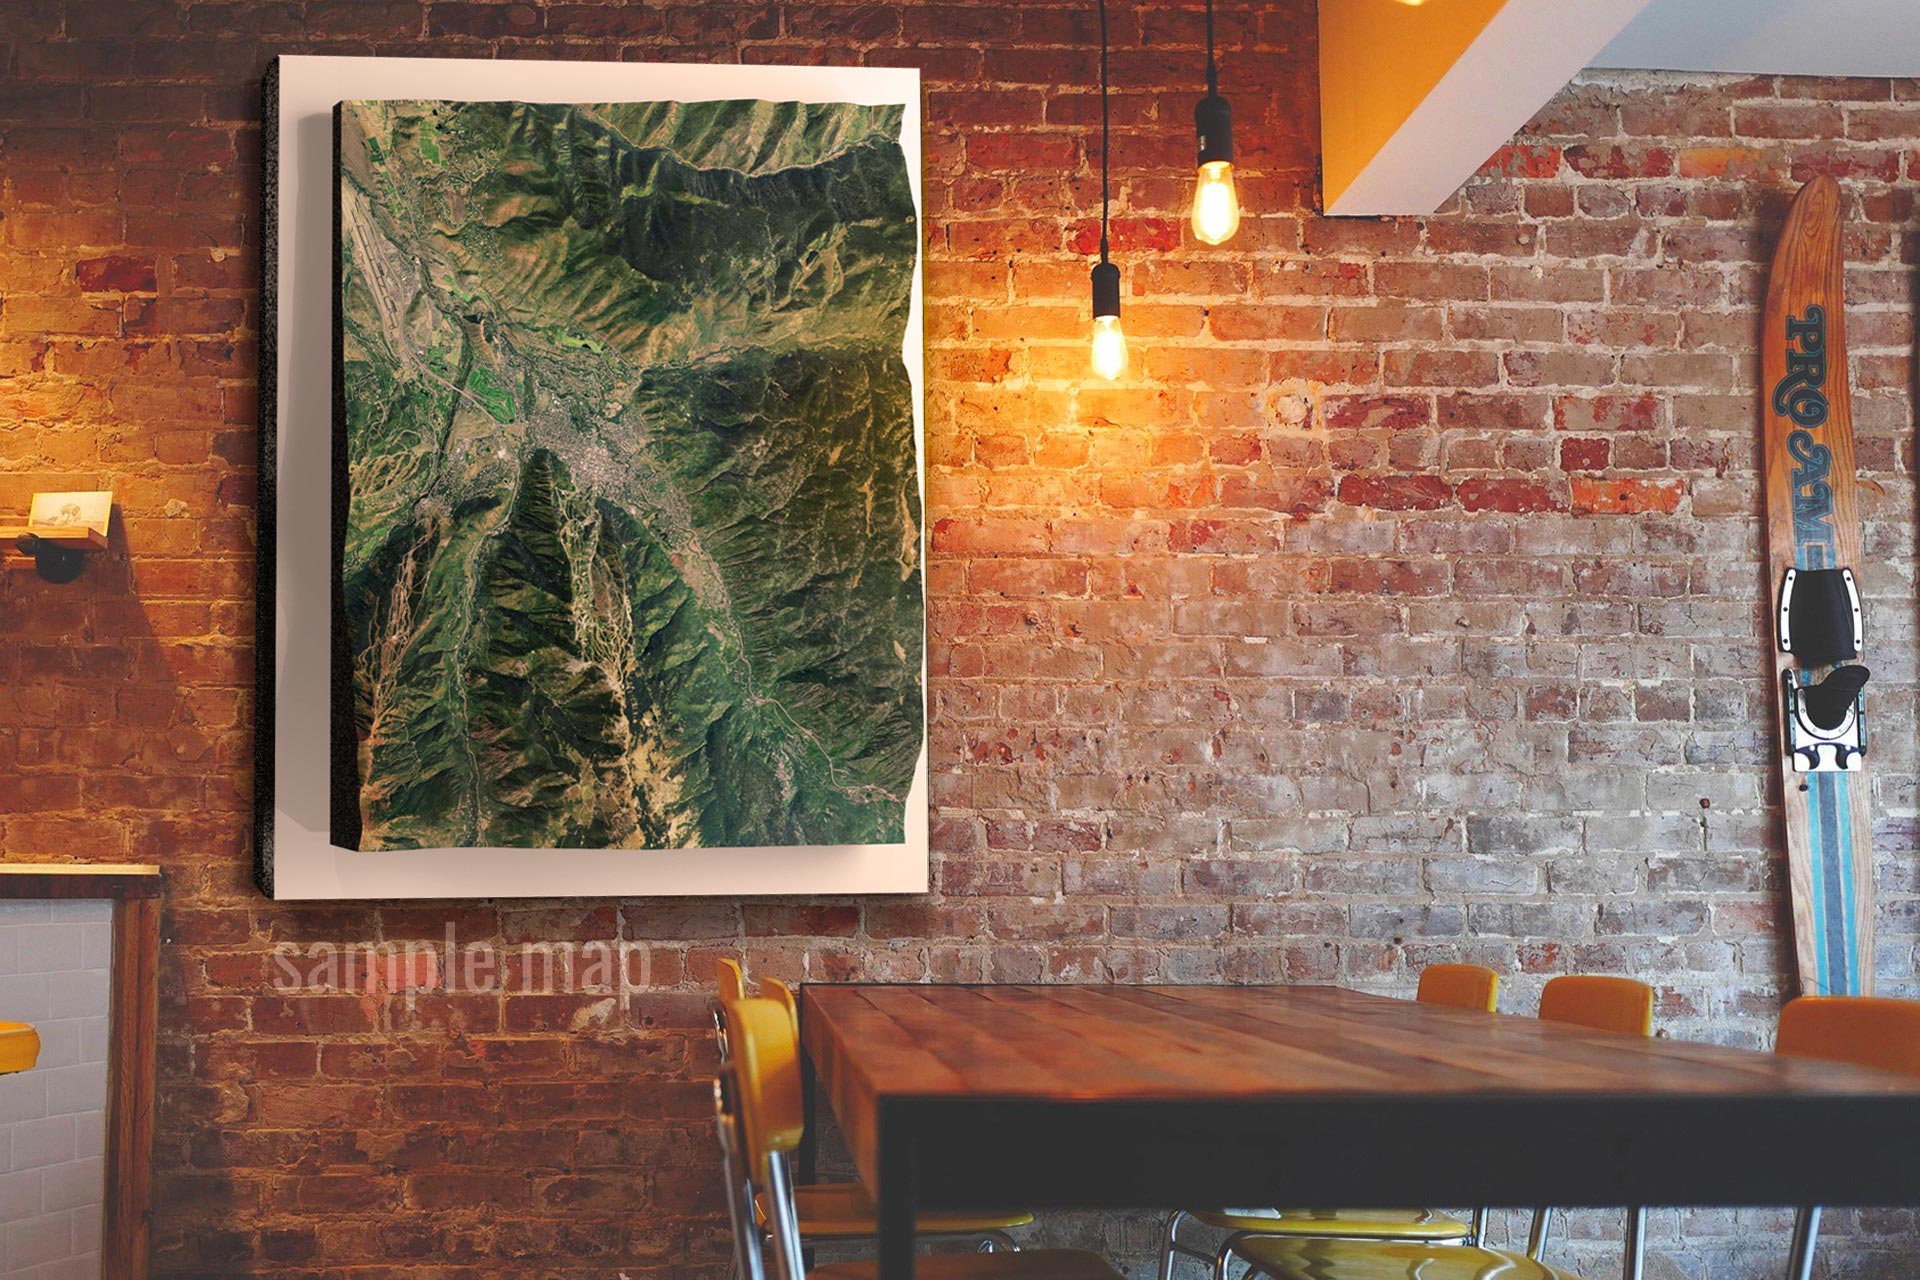
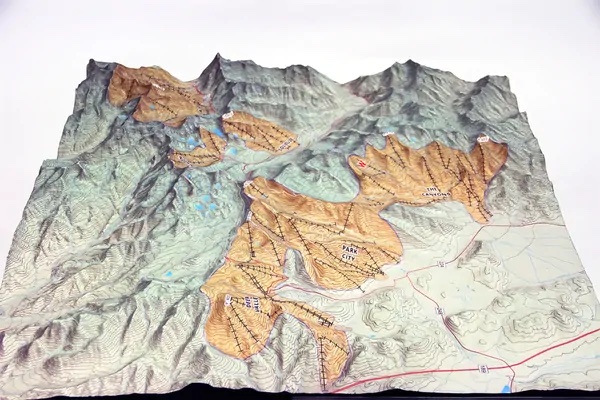
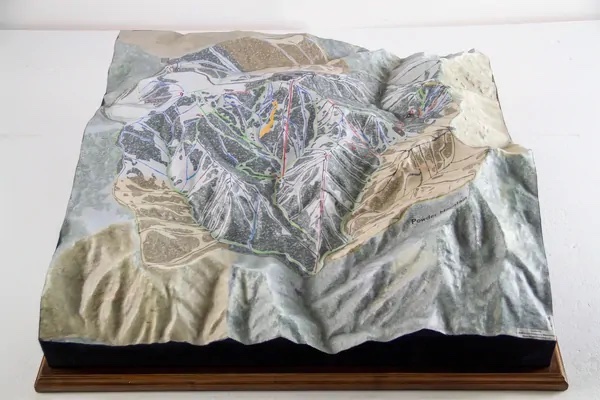
Sample 3D Physical Maps
Physical maps have been around for centuries. From aiding in navigation to providing a deeper understanding of the topography of an area, physical maps have proven to be an invaluable tool. The benefits of physical maps are numerous and are listed below.
- Improved Navigation: One of the most significant benefits of physical maps is their ability to aid in navigation. Unlike traditional maps, which can be challenging to read and interpret, physical maps provide a more detailed and accurate representation of the terrain. With contour lines, shading, and color, viewers can get a better sense of the slope, shape, and natural features of the land. This information can be crucial when planning a route, helping travelers avoid hazardous areas and stay on track.
- Better Understanding of Topography: Another key benefit of physical maps is their ability to provide a deeper understanding of the topography of an area. By using shading and contour lines, physical maps can convey the three-dimensional features of the land in a way that traditional maps cannot. This can be particularly helpful when studying geology, hydrology, or other natural sciences. By examining the features of a physical map, scientists can gain a better understanding of the landscape and how it has evolved over time.
- Enhanced Visualization: Physical maps also provide an enhanced visualization of the terrain. By using color, shading, and contour lines, physical maps can create a more immersive and visually appealing representation of the landscape. This can be particularly useful for educational purposes, helping students to better understand the features of a particular area. Additionally, the enhanced visualization provided by physical maps can help to stimulate the imagination, inspiring people to explore and appreciate the natural world.
- Improved Disaster Planning: Physical maps are also an essential tool for disaster planning. By providing an accurate and detailed representation of the terrain, physical maps can help emergency planners to better understand the potential risks of an area. This information can be crucial when preparing for natural disasters, such as floods or landslides. By using physical maps, emergency planners can create more effective evacuation plans, identify potential hazards, and mitigate the impact of disasters.
The benefits of physical maps are numerous. From aiding in navigation to providing a better understanding of the topography of an area, physical maps are an essential tool for scientists, explorers, and everyday hikers alike. The enhanced visualization provided by physical maps can inspire people to explore and appreciate the natural world, while the accurate representation of the terrain can help to mitigate the impact of natural disasters. As technology continues to advance, physical maps will only become more sophisticated and more widely used, helping us to better understand and appreciate the world around us.
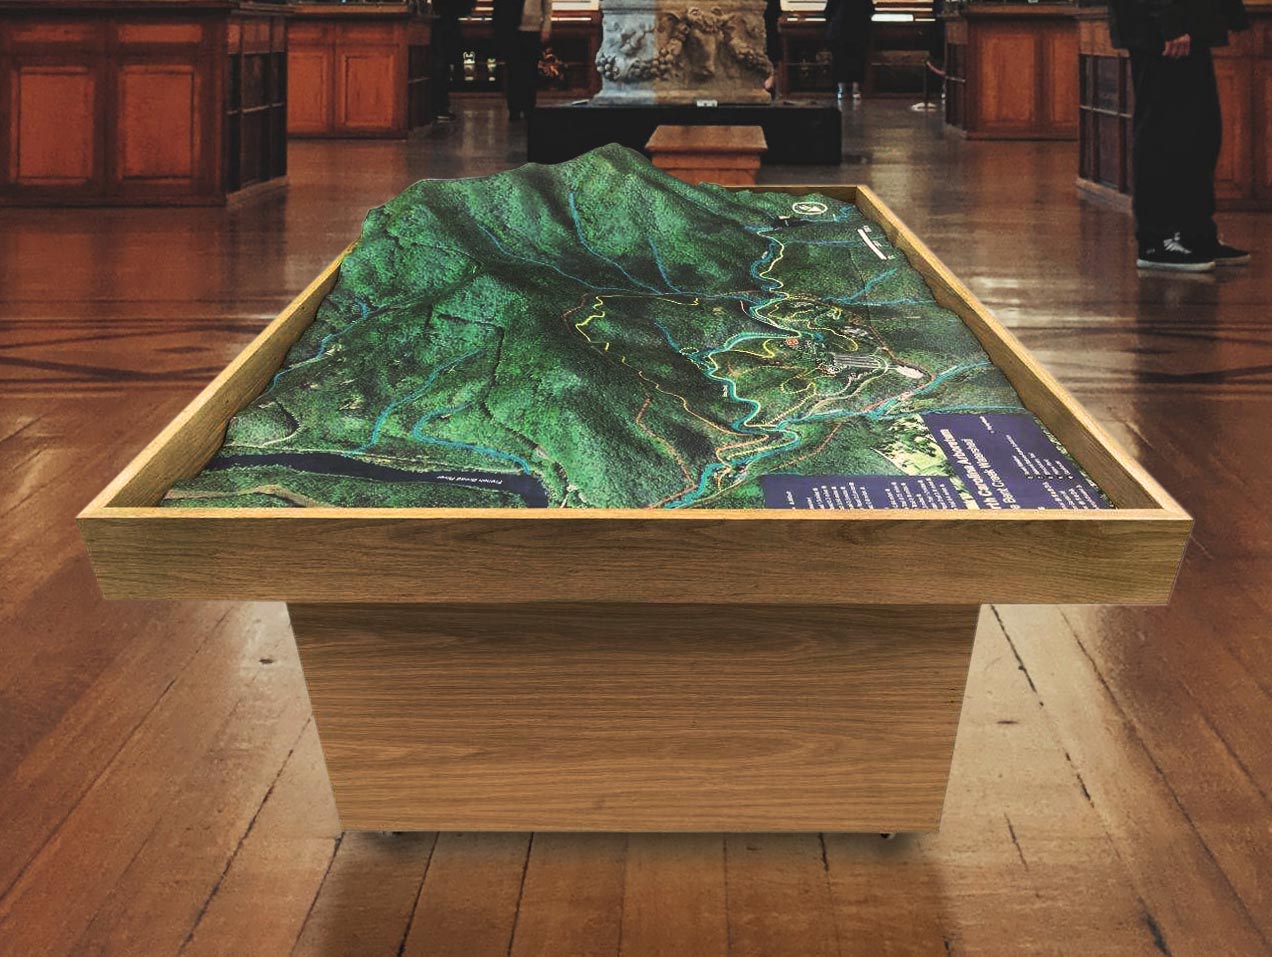
Our high-quality maps and models are on display at museums, national parks, university campuses, sports facilities, hospitals, and research organizations worldwide. One of our more recent physical map projects was of the Great Smoky Mountains National Park and the surrounding area. This large physical map covered over 1.2 million acres in a 91″ x 56″ frame.
We meld top-of-the-line technologies with professional cartography resources to create stunning physical maps and models. Our expertise in 3D printing enables us to allow more markets to benefit from purchasing durable, portable, and affordable models.
Gallery of eCommerce 3D USGS Topographic Maps and 2D Canvas Prints
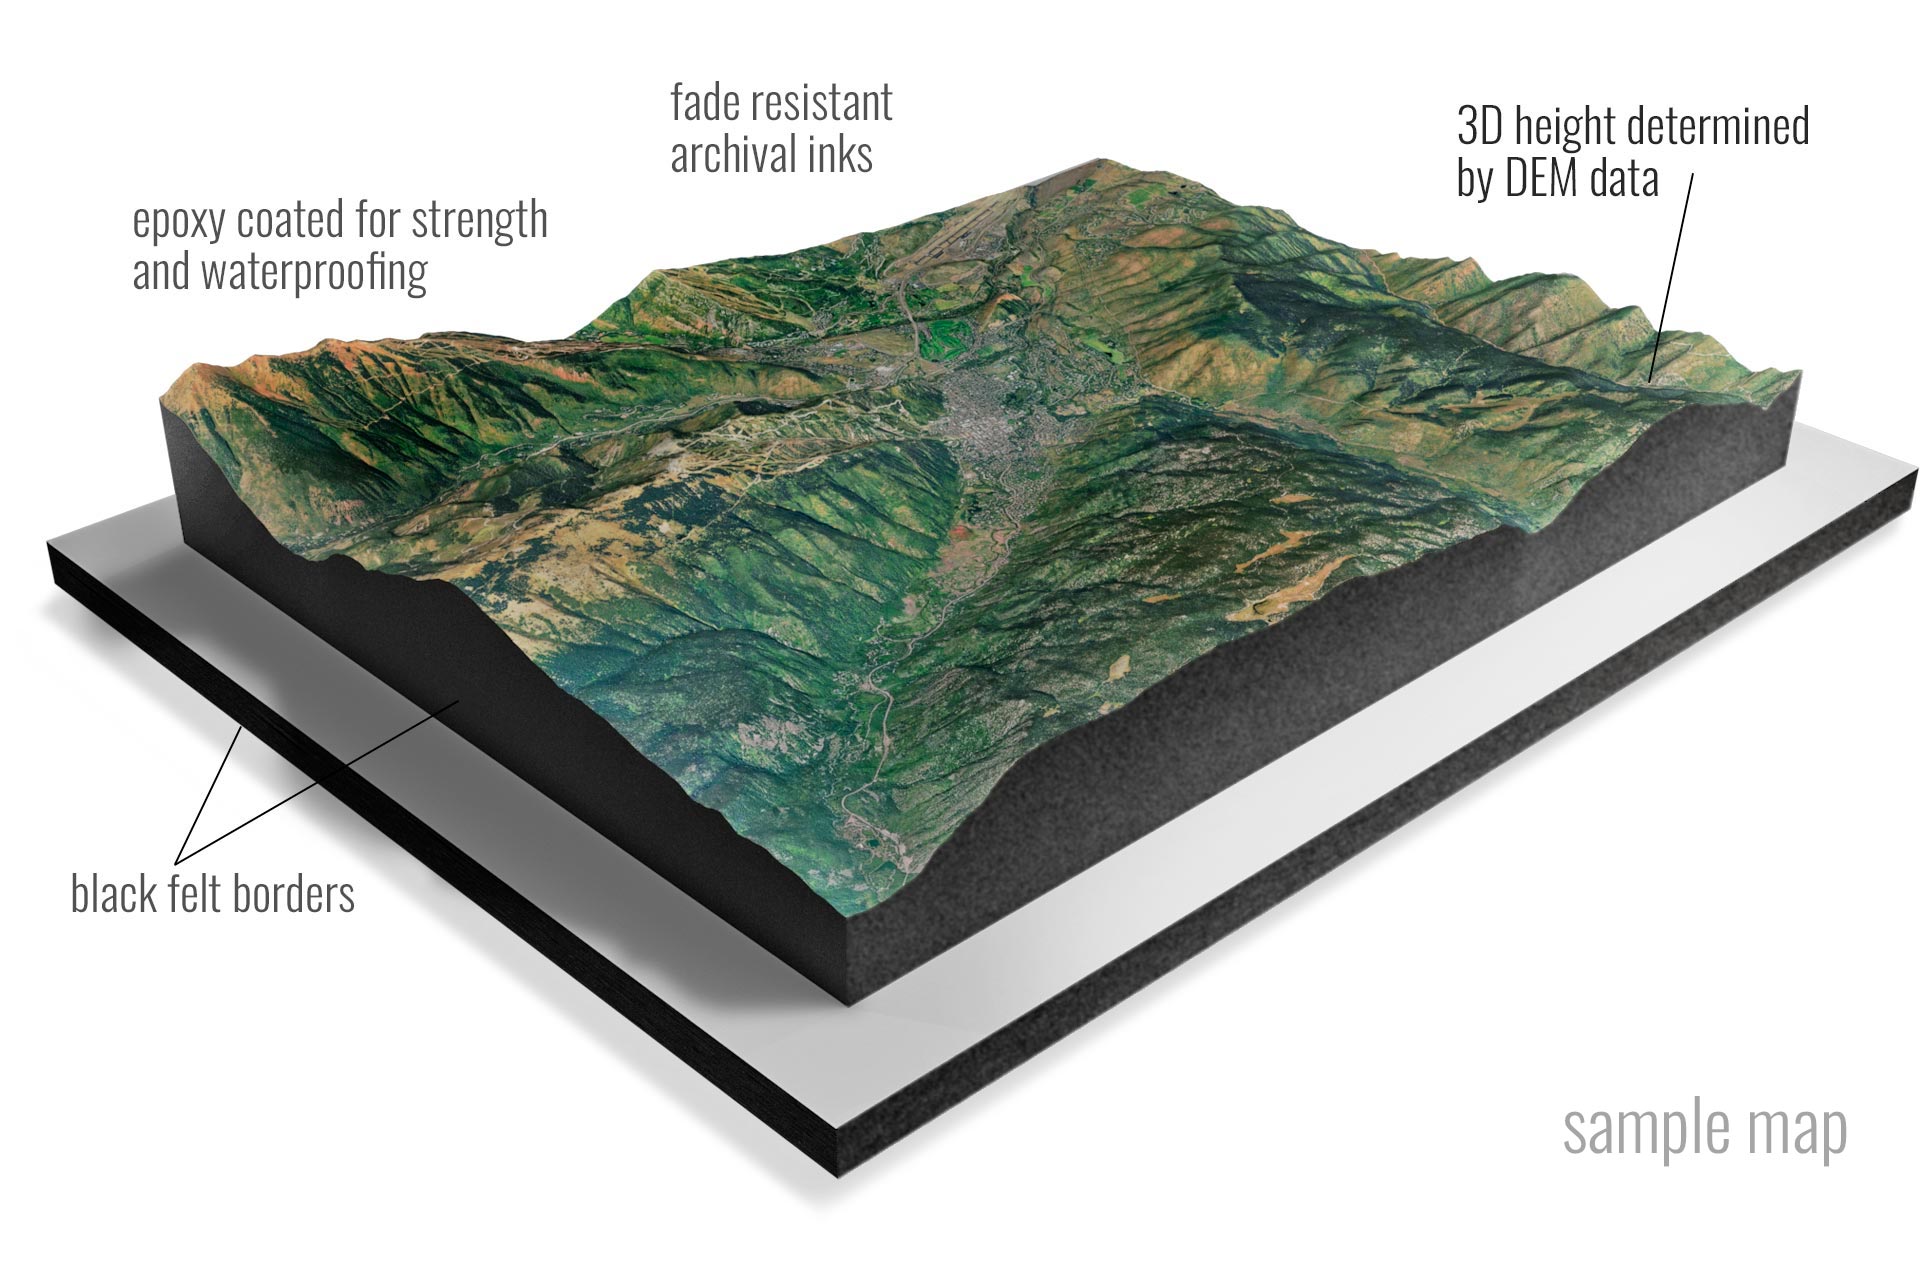
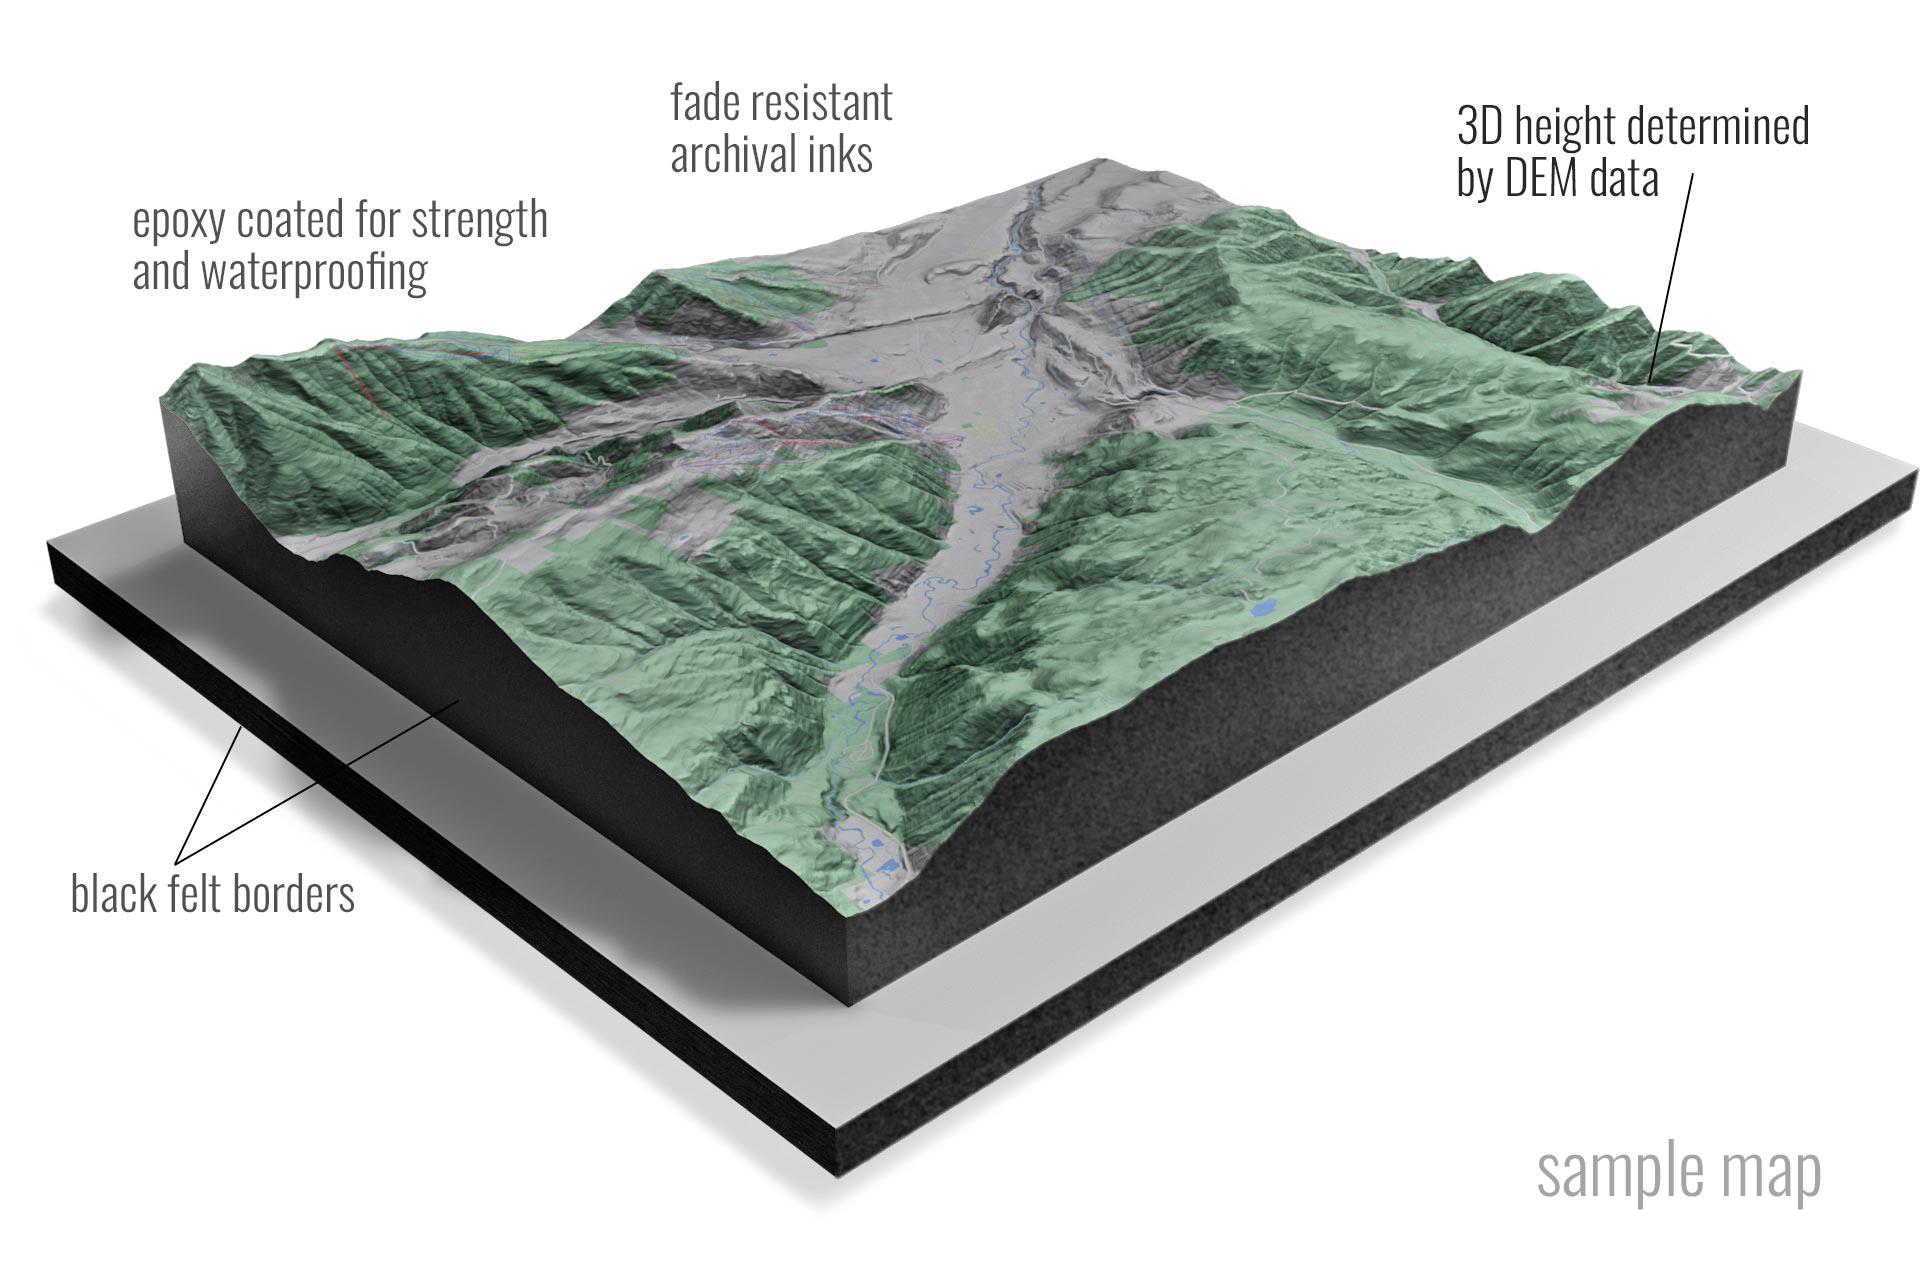
Shop WhiteClouds 3D USGS Topographical Maps with 65,240 three-dimensional maps to choose from. There are also 361,902 3D USGS Historical Topographical Maps to choose from. These maps are not flat. They are three-dimensional, with the height being determined by Digital Elevation Model (DEM) data. These 3D maps are built by combining satellite imagery data from the USGS and DEM data. Make a statement with these beautiful 3D map images from every part of the United States.
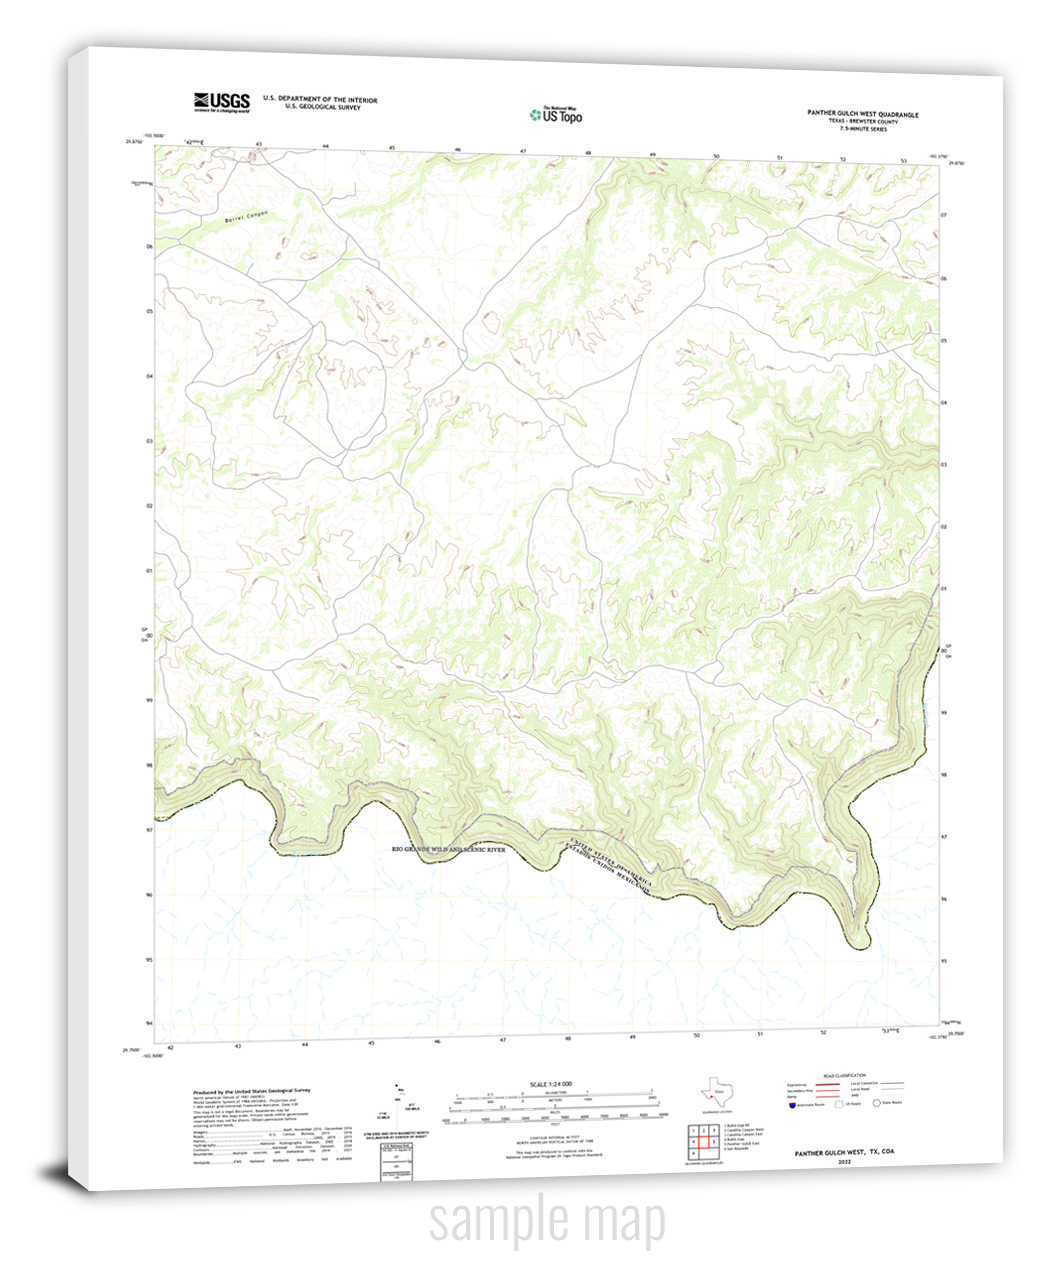
Shop WhiteClouds 2D USGS Topographical Canvas Print Maps with 427,142 maps to choose from. These canvas print maps have both current and historical USGS topographic maps (from 1882 to present). There are also satellite and terrain canvas print maps that use the USGS coordinates.
Gallery of Custom 3D Map Projects
How 3D Physical Maps are Made
There are several techniques used to create physical maps, and the process can vary depending on the scale and complexity of the map. However, the basic steps involved in making a physical map are as follows:
- Create a base map. The first step in making a contour map is to create a base map of the area. This can be done using imagery from a standard two-dimensional map, aerial photographs, satellite images, or WhiteClouds can do it for you.
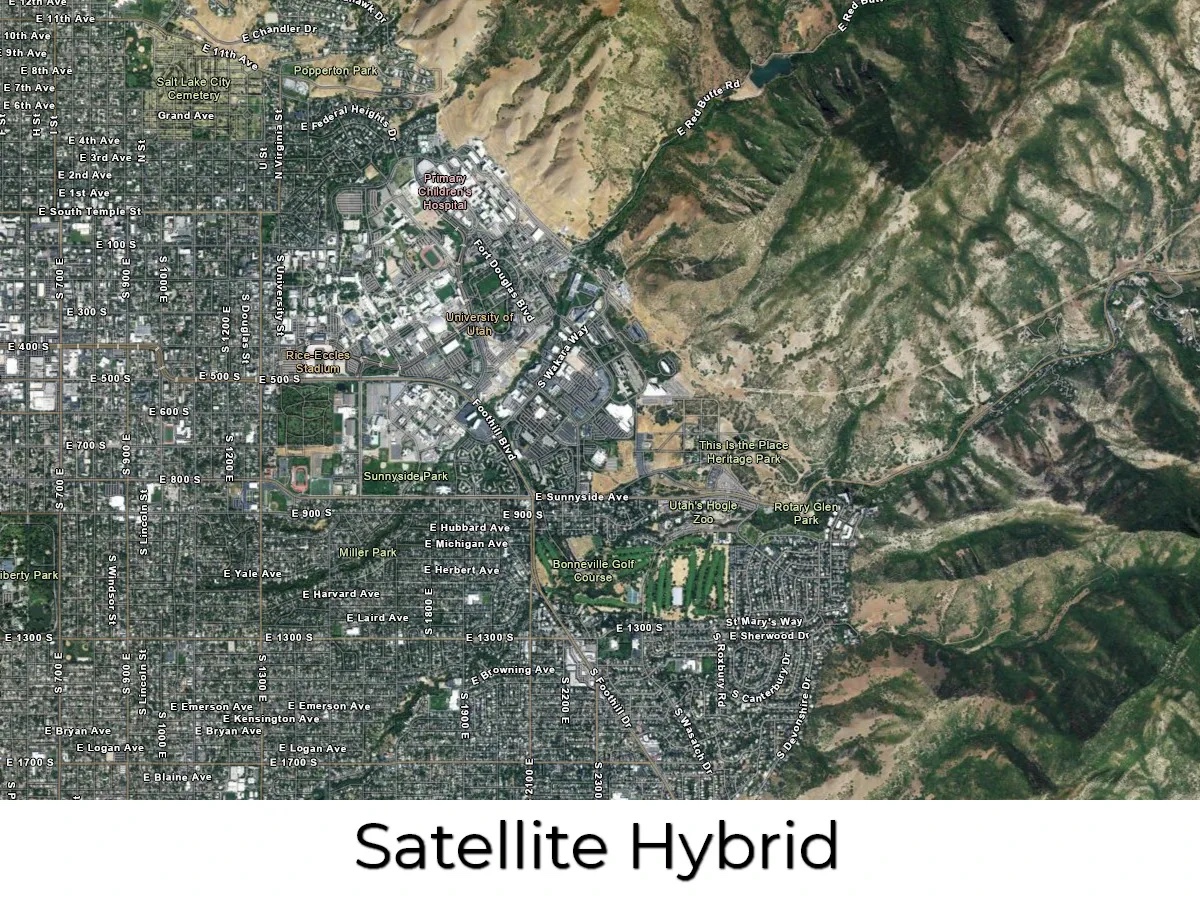
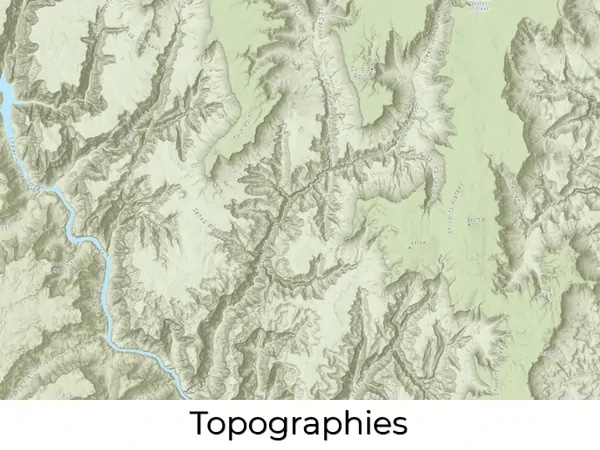
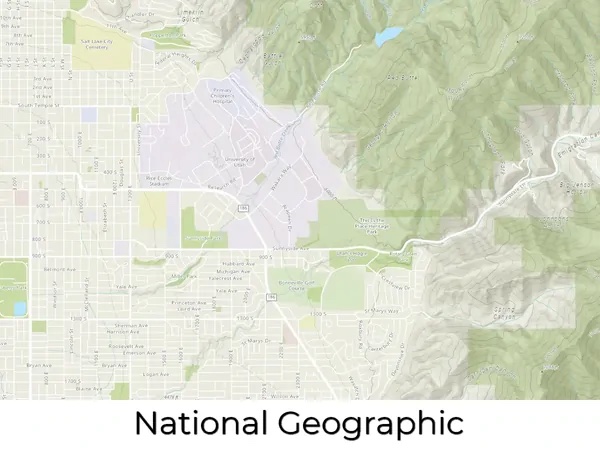
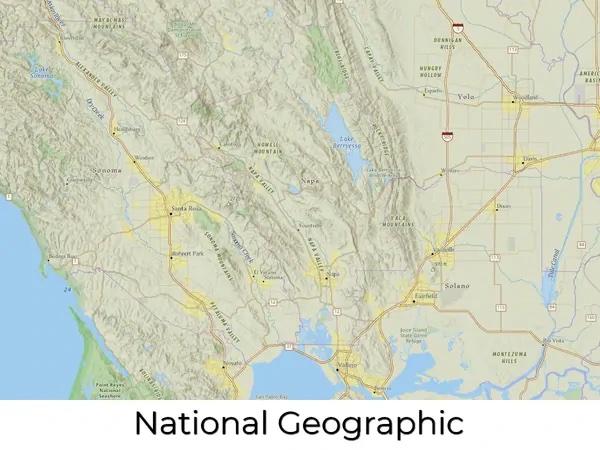
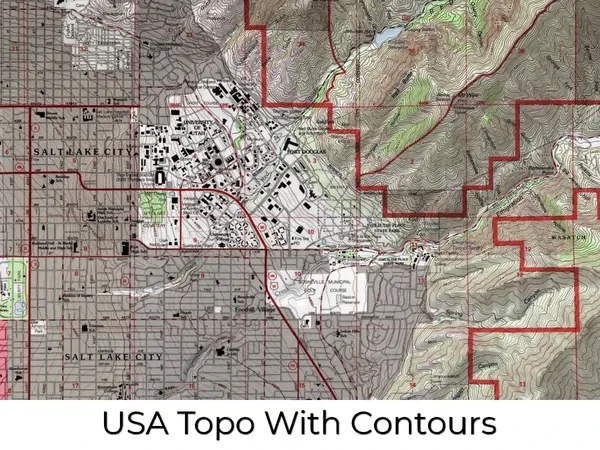
- Determine the design style of the map. There are over 40 styles to choose from. Popular ones include satellite, terrain, topography, raised relief, and satellite hybrid.
- Add any special design features not included in the source map, such as special features, landmarks, legends, roads, cities, symbols, etc.
- Add elevation data. The next step is to add elevation data to the map. This can be done using a variety of techniques, such as contour lines, shading, or digital elevation models (DEMs).
- Print the Map Overlay. Latex vinyl materials are used for the map details and colors.
- Create the 3D physical map. Once the elevation data has been added to the map, a physical 3D structure is created that replicates the topography of the area. This can be done using 3D printed plastic or thermoformed molding/casting. Either approach is combined with the Vinyl overlay.
- Finish the map. This is where any excess materials are cutaway. Any special sealers, matte finishes, hardeners, or UV protection is applied. Wood, metal or plastic bases are built and border flocking may be applied.
Features & Benefits of Physical Maps
- Remarkably Strong: You can drive a 1-ton truck over our physical maps.
- Precision: We print our physical maps to scale as accurately as are the original files and images.
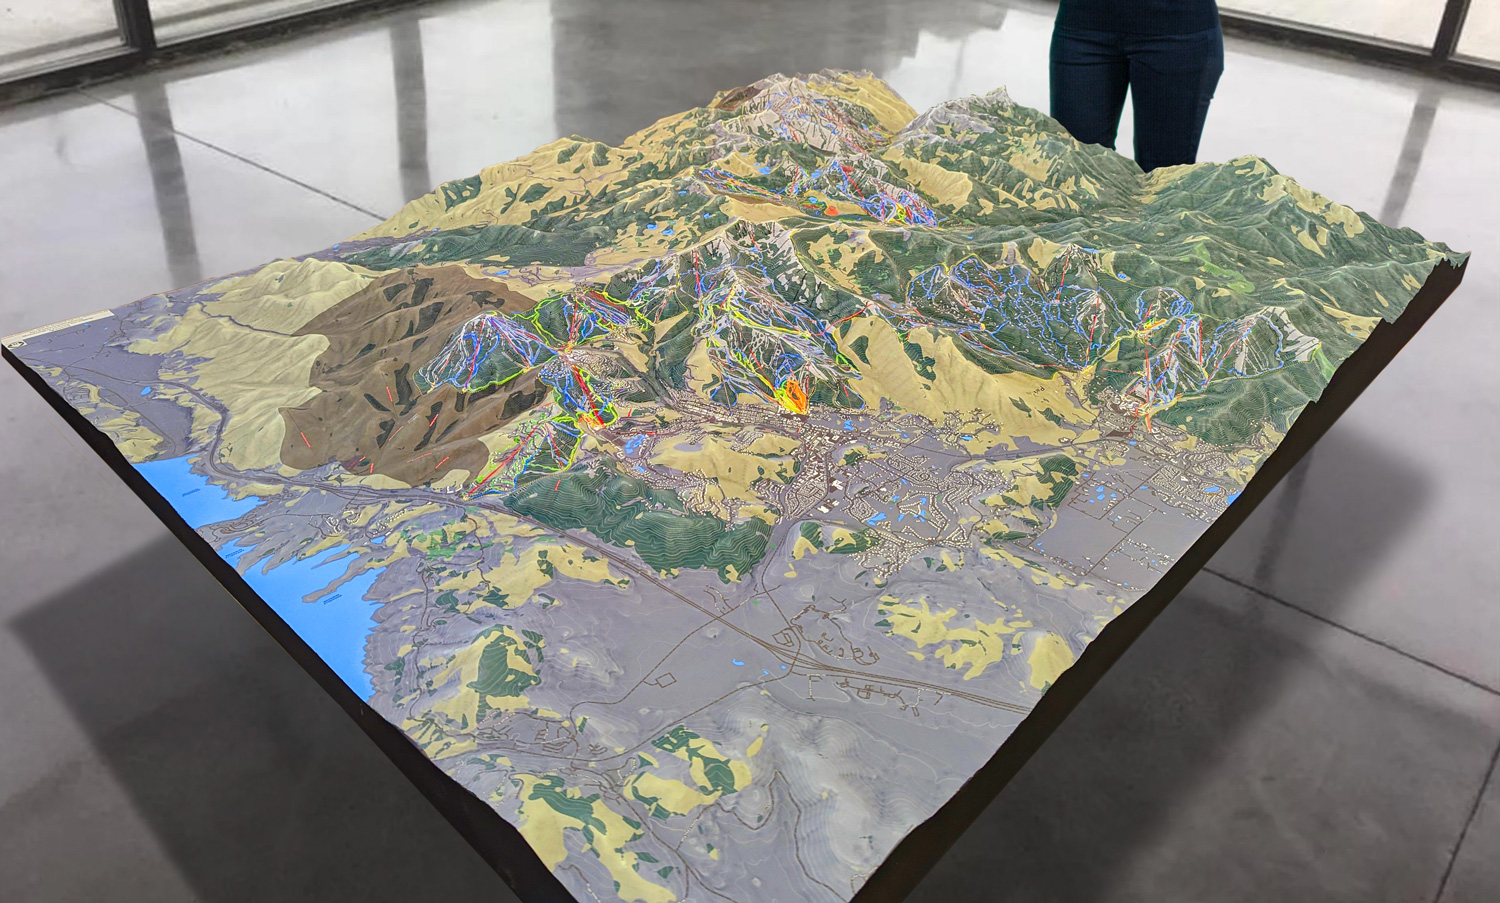
- Excitement: It is much easier to get excited about 3D views of your ski runs or trails than flat printed maps.
- Stain and Water Resistance: Spills are easy to wipe up.
- Communication: Physical maps are simple to understand with a quick glance.
- Affordability: Our 3D technologies allow you to order custom 3D maps for a reasonable price.
- Testability: 3D technologies are affordable enough to test designs, such as several versions of planned work.
- Consistency: Using modern print and casting technologies, you can easily recreate identical 3D maps.
- Portability: We use lighter materials than what was available in the past, making our physical maps easy to transport.
Videos of 3D Maps
Map Design Styles of Physical Maps
Many design styles, or base maps, serve as a starting point for your physical map. We source and create our base maps using the same digital tools that expert cartographers use to create maps. Once you have selected your base map, everything else is fully customizable. We can layer informational text (such as landmarks or other points of interest) and even change the colors to suit your preferences.
Complex layers can be added such as streams and lakes, terrain, roads, and even more detail like political boundaries, religious, and other population-based demographics. Multiple layers can also be added to the same physical map. For example, community developers and city planners can benefit from a 3D map with layers that include parcel lines, existing building footprints, and utility lines. Take a look at the map style categories below for inspiration.
Technology and Materials Used in Physical Maps
- With 3D printing technology, you are not limited to straight lines and boxes. The curves and cliffs are captured accurately and beautifully in astonishing detail.
- Your vision of the final 3D map determines which materials we will choose to produce the best results. We help you to determine the materials that best suit your project.
- We use fabrication technologies such as 3D printing, CNC cutting, and molding/casting.
- Physical maps show incredible detail.
- Our maps are printed in full color (with over 17 million variations of color) for awe-inspiring presentations and displays. No painting required!
- Typically, we use a special process for finishing the sides of the raised relief maps in a suede-like material, similar to the finish of a jewelry box.
- Our in-house paint booth gives us flexibility in different types and grades of paint and finishing capabilities; we can provide UV-resistant coatings to protect the coloration of your 3M map for many years.
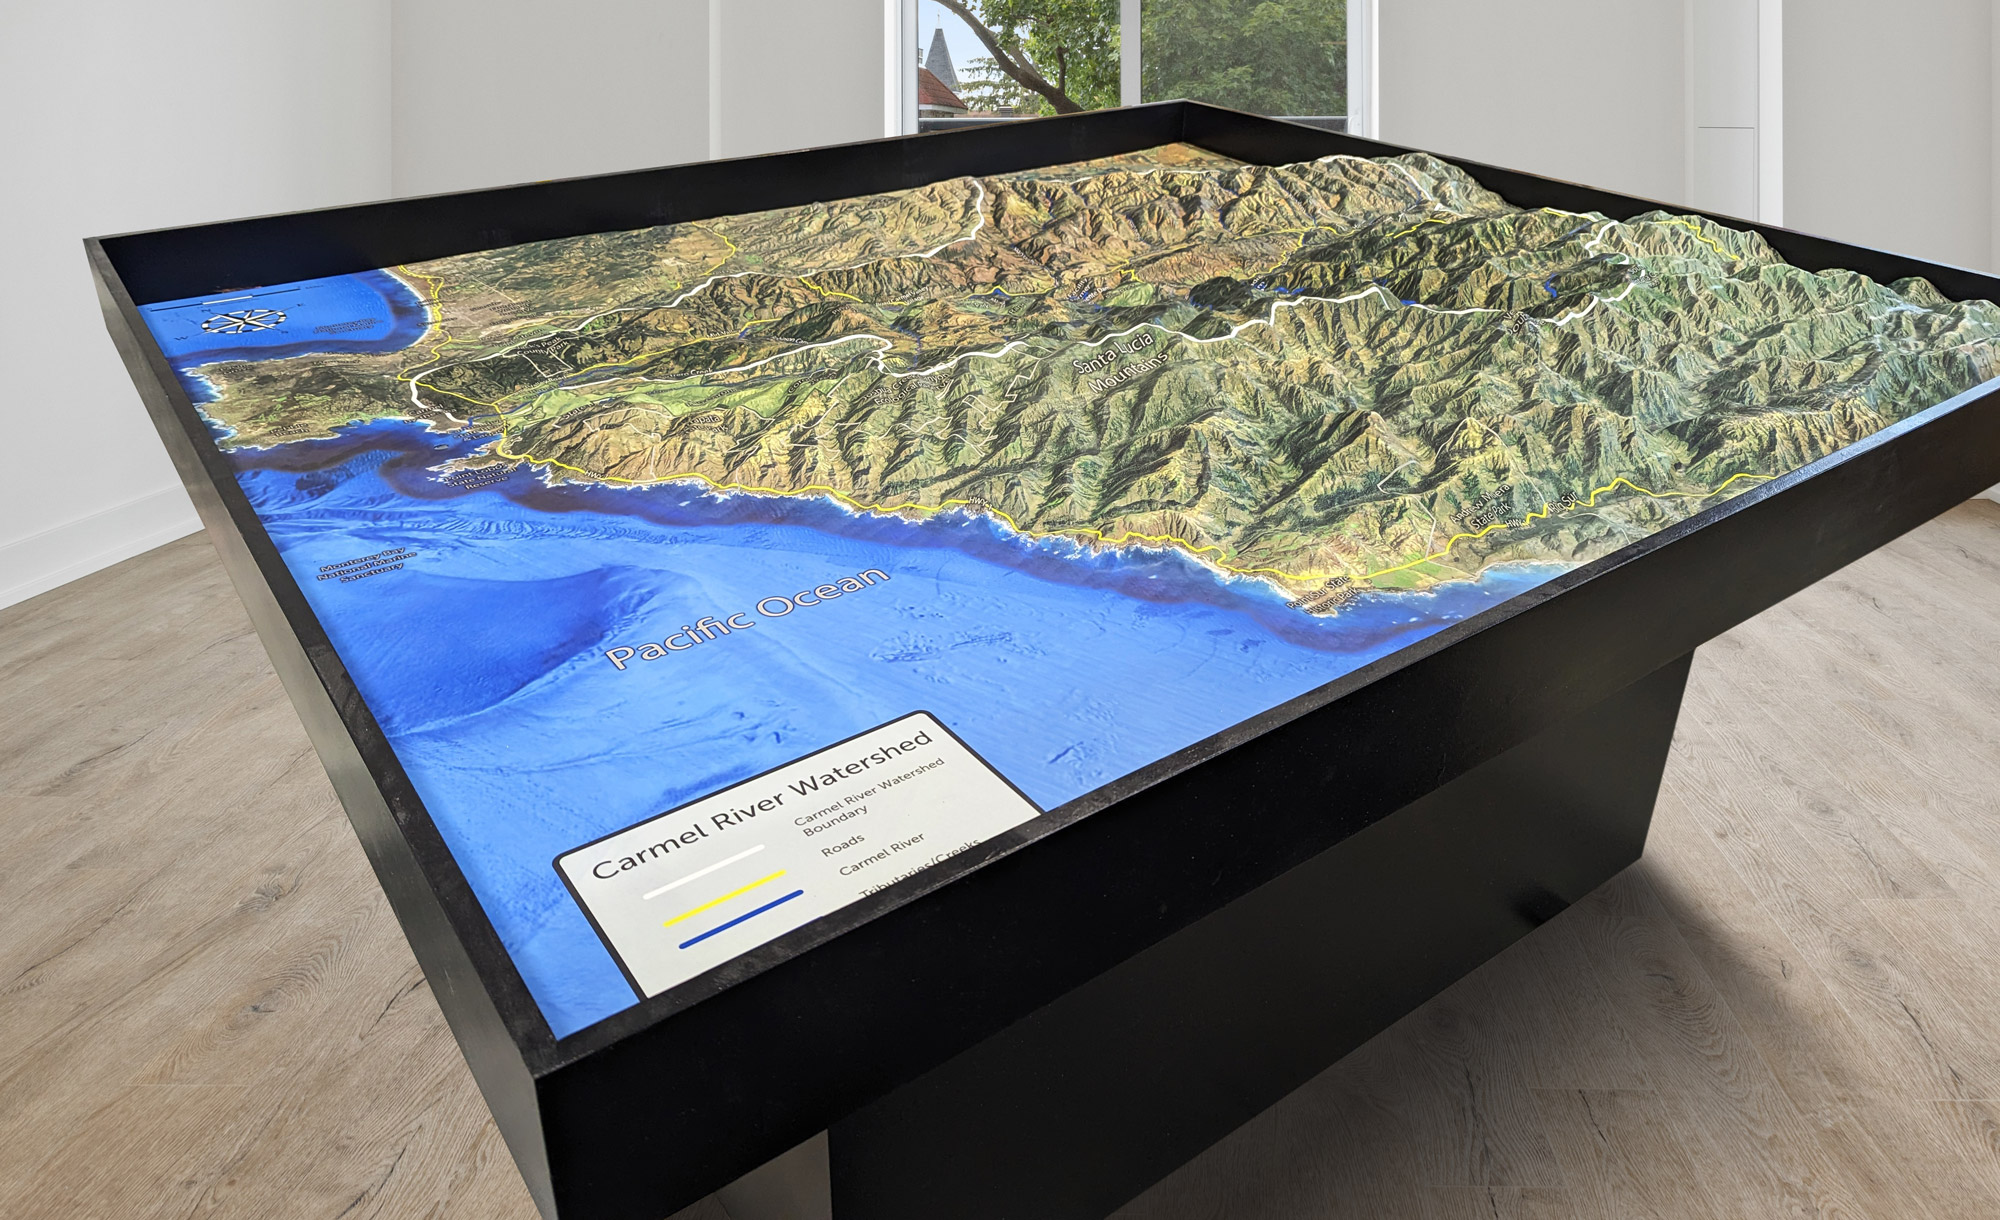
- We also offer customized additions to our 3D maps and models. Our in-house carpentry shop will build elegant bases, tables, or cabinetry to display any map you choose. Worried about dust? We can customize a case to protect your display as well. Our skilled artisans can hand-paint details to make your map a true work of art.
Pricing of Custom Physical Maps
The price of 3D maps and models are generally based on your size requirements, specific design needs, and the amount of work it will take to produce. Each map is custom-built and charged for accordingly. The best way to determine cost is to email us, call us at 385-206-8700, or fill out the form below and let us bid on your project.
Get a Free Price Estimate for a Custom Physical Map
Custom Fabrication Workflow

Common Questions & Answers
- What is the largest map you can fabricate? There is no limit to the size of a map we can build. There are practical limits that will impact shipping and installation, but we work closely with our customers on these special requirements.
- What type of 3D maps can you fabricate? All types. Satellite Maps, Terrain Maps, Topographical Maps, Raised Relief Maps, USGS Maps, Contour Maps, and many more.
- Can you fabricate with different technologies and materials? Yes. Our most common fabrication technology is 3D Printing, but we can also build 3D Maps with CNC Cutting, 3D Foam, Molding/Casting, Thermoforming, and Sculpting.
- What materials can you 3D print in? We match the correct material and fabrication process to your requirements in terms of presentation, size, and transportability. We can 3D print in PLA, FDM, Full-Color Sandstone, UV-cured resin, plastic, rubber-like, acrylic, and nylon – as well as combining multiple technologies.
- Can you sign a Non-disclosure Agreement that you supply? Yes.
- How long will it take to create my map? That depends on the design and size of the map. A more complex or detailed map will take longer than a simple map, we can’t really say exactly how long it will take until we have the chance to understand what type of map you want fabricated. Generally, smaller standard maps can be a couple of weeks and large museum exhibition maps can be 6 months.
- What do you need from me to start the map fabrication? Boundaries are a good place to start. Determining map styles, sizes, height (may be exaggerated), and cabinetry needs are all part of the process. Special design features can also be added.
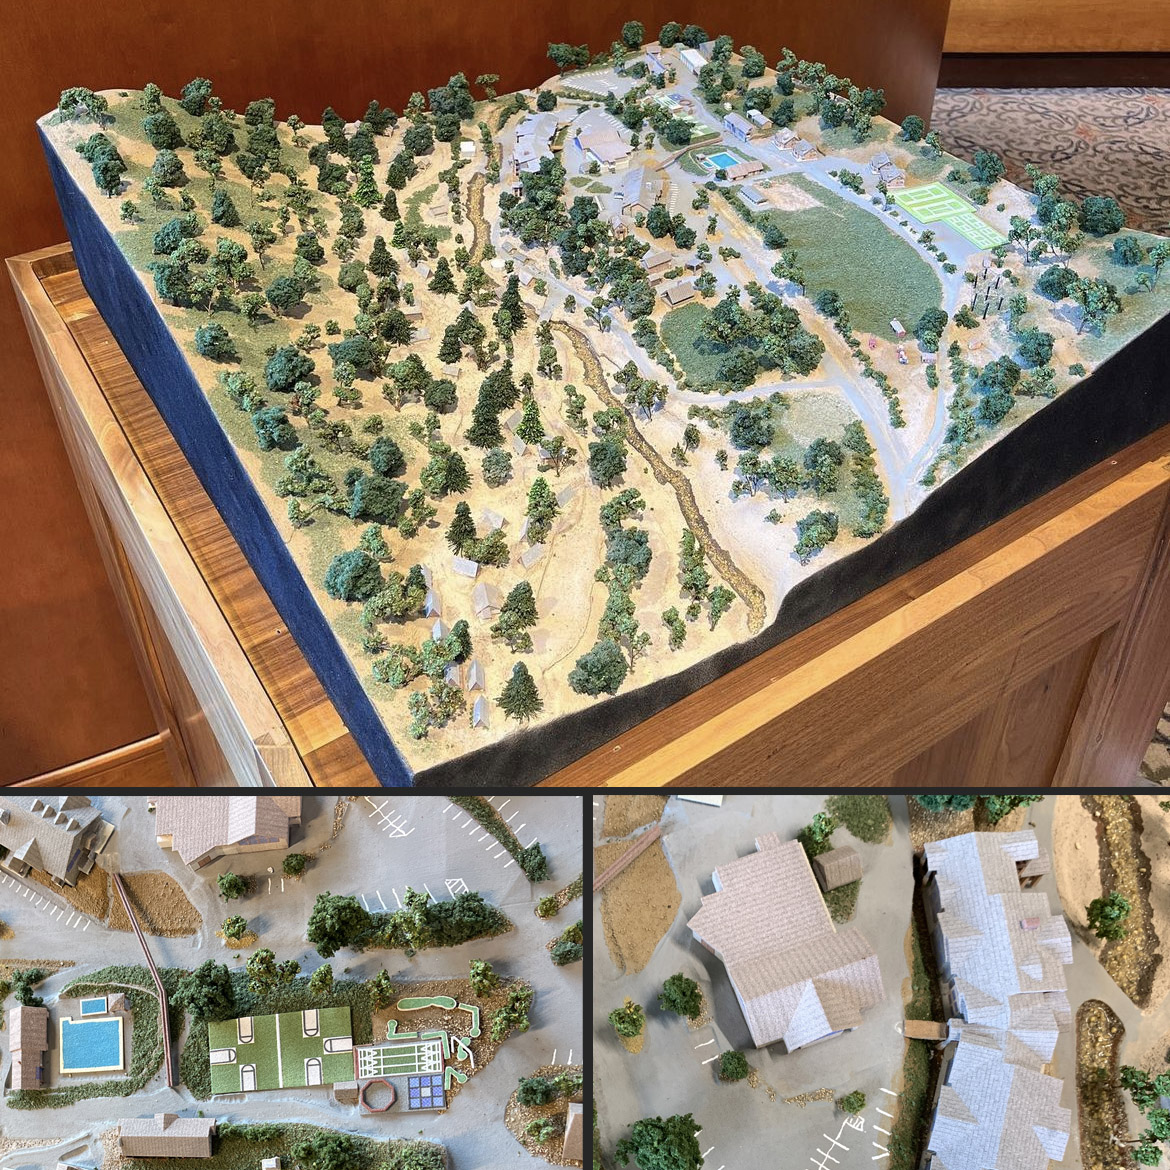
- Can you add homes, buildings, swimming pools, arbors, hardscaping features, etc.? Yes. We can 3D print many of these items and include them in our maps. We refer to these more complex maps as architectural dioramas.
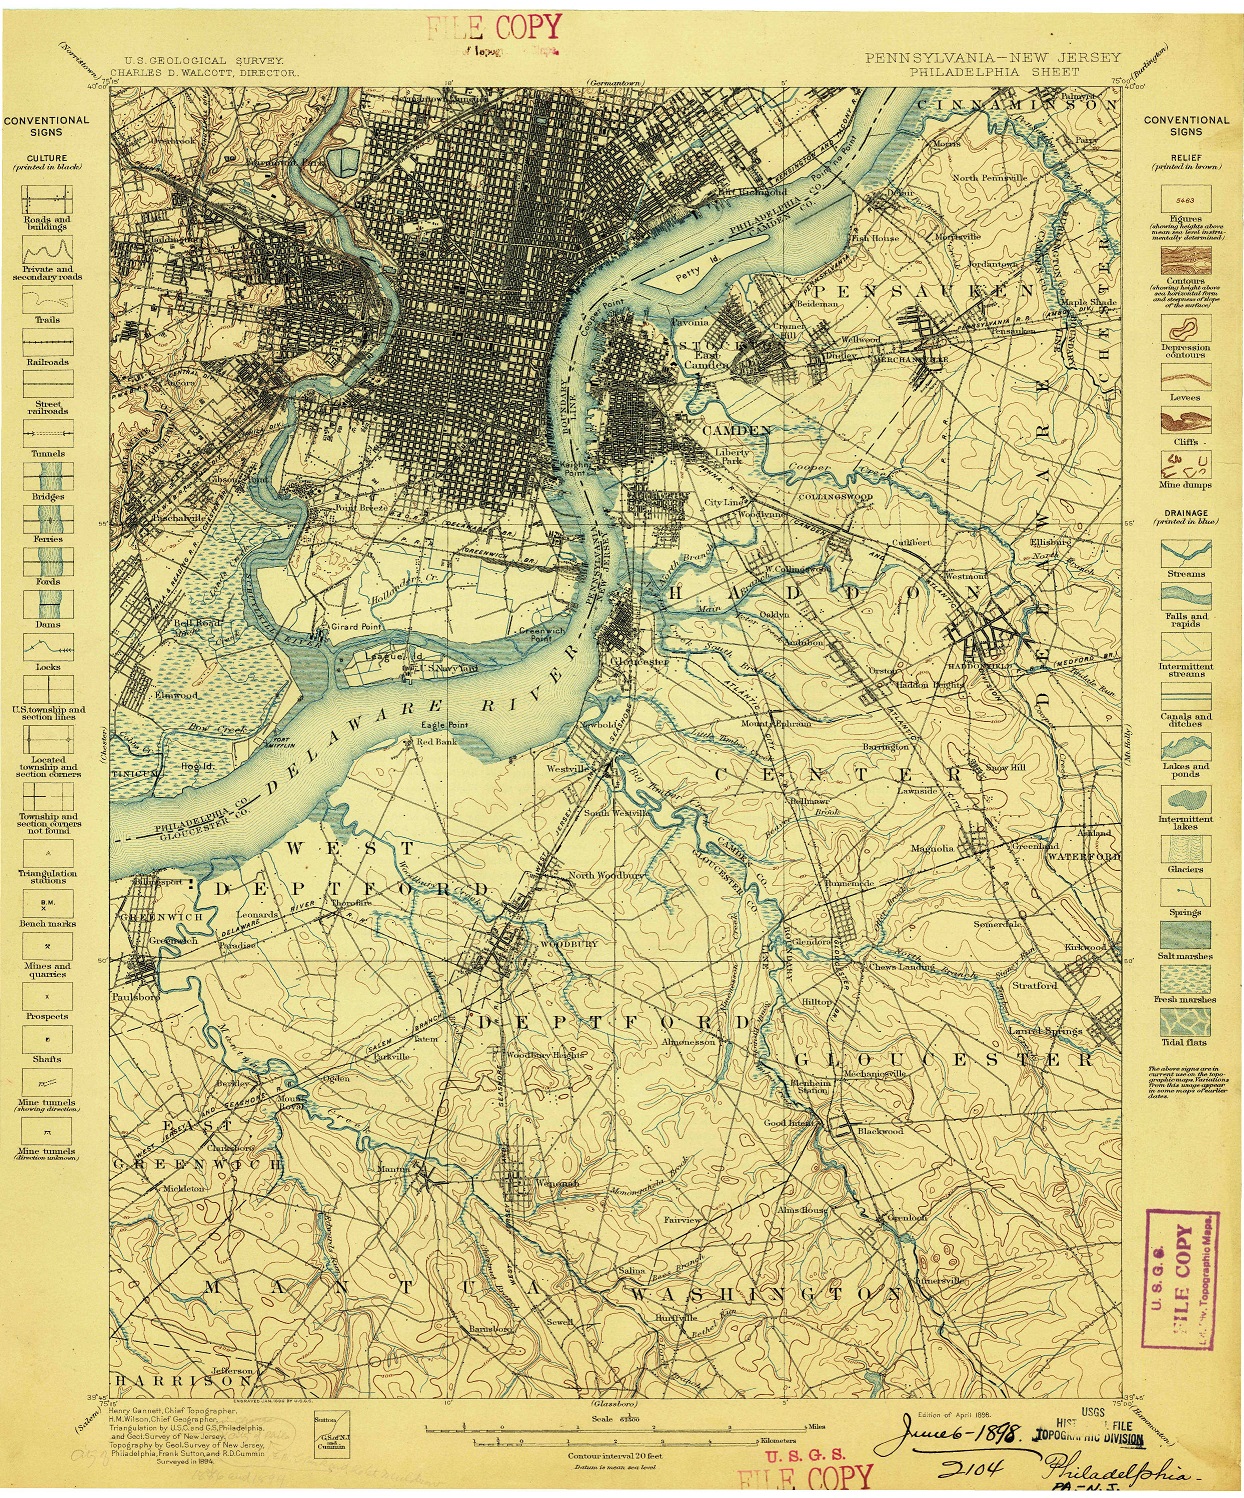
- What is a physical map? A physical map is a type of map that represents the physical features of a particular area or region using contour lines. These lines connect points of equal elevation and are used to create a 2D representation of the terrain.
Unlike a 3D relief map, a physical map does not display the terrain in three dimensions. Instead, it provides a flat representation of the land that is useful for a wide range of purposes, from outdoor recreation to urban planning.
One of the key benefits of physical maps is that they provide a clear and detailed picture of the terrain, which can be incredibly helpful for hikers, climbers, and other outdoor enthusiasts. By showing the contour lines and elevation changes in a particular area, these maps can help people plan their routes and navigate difficult terrain more effectively.
Overall, a physical map is an important tool for understanding the physical features of a particular area or region. By providing a clear and detailed representation of the terrain, these maps can help people appreciate the natural beauty of the land and navigate it more effectively.
What is on a physical map? A physical map is a type of map that represents the physical features of a particular area or region using contour lines. These lines connect points of equal elevation and are used to create a 2D representation of the terrain.
On a physical map, the key feature that is represented is the terrain and shapes of the land. Additionally, physical maps may also include information such as bodies of water, roads, and other man-made features. These features can be helpful for outdoor enthusiasts, hikers, and other adventurers who need to navigate the area.
Overall, physical maps are an important tool for understanding the physical features of a particular area or region. By providing a clear and detailed representation of the terrain, these maps can help people appreciate the natural beauty of the land and navigate it more effectively. Whether for recreational or professional purposes, a physical map is an invaluable resource for anyone who wants to explore and understand the world around them.
What does a physical map show? A physical map shows the physical features of a particular area or region using colors. These colors are used to create a 2D representation of the terrain, providing a clear and detailed picture of the land’s elevation, slopes, and shape.
Physical maps may include other important features such as rivers, lakes, and other bodies of water, as well as man-made features such as roads, buildings, and landmarks. These features can help people navigate the area more effectively and appreciate its natural and cultural resources.
Overall, a physical map is a useful tool for understanding the physical characteristics of a particular area or region. By providing a clear and detailed representation of the land’s terrain, these maps can help people plan routes for hiking or other outdoor activities, understand the geology of an area, and appreciate the natural beauty of the land.
How does a physical map show elevation? A physical map sometimes shows elevation using contour lines that connect points of equal elevation. These lines are used to create a topographic map that represents the land’s elevation, slopes, and shape.
Contour lines on a physical map represent changes in elevation at specific intervals, such as every 10 or 20 meters. The distance between the lines represents the change in elevation between them, with closer lines indicating steeper slopes and further lines indicating flatter terrain. For example, if contour lines are spaced closely together, it indicates a steep incline or decline in the terrain. On the other hand, if the contour lines are spaced far apart, it indicates a relatively flat or level terrain.
To give an example, a contour line with an elevation of 100 meters indicates that all the points along that line have the same elevation of 100 meters above sea level. The next contour line might have an elevation of 110 meters, indicating that all the points along that line have the same elevation of 110 meters above sea level. By connecting these contour lines, a physical map shows the shape of the terrain and provides a visual representation of the area’s elevation.
Overall, contour lines can be an essential feature of physical maps, allowing users to understand the terrain’s elevation and plan their routes more effectively.
What does a physical map look like? A physical map is a two-dimensional representation of the physical features of a particular area or region. It sometimes shows the terrain’s elevation and shape using contour lines that connect points of equal elevation.
The map may also include other important features such as rivers, lakes, and other bodies of water, as well as man-made features such as roads, buildings, and landmarks. These features are typically depicted using different colors or symbols to help users distinguish them from the contour lines.
Overall, a physical map provides a clear and detailed picture of the land’s terrain and sometimes elevation, making it a valuable tool for hikers, geologists, cartographers, and other professionals who need to navigate and understand the natural environment.
What is a definition of a physical map? A physical map is a type of map that shows the physical features and sometimes elevation of a particular area or region in a two-dimensional format. It uses contour lines to represent changes in elevation and shape, connecting points of equal elevation and providing a visual representation of the terrain’s features. These maps are commonly used in outdoor recreation, cartography, geology, and other fields where a clear and detailed representation of the land’s elevation is required.
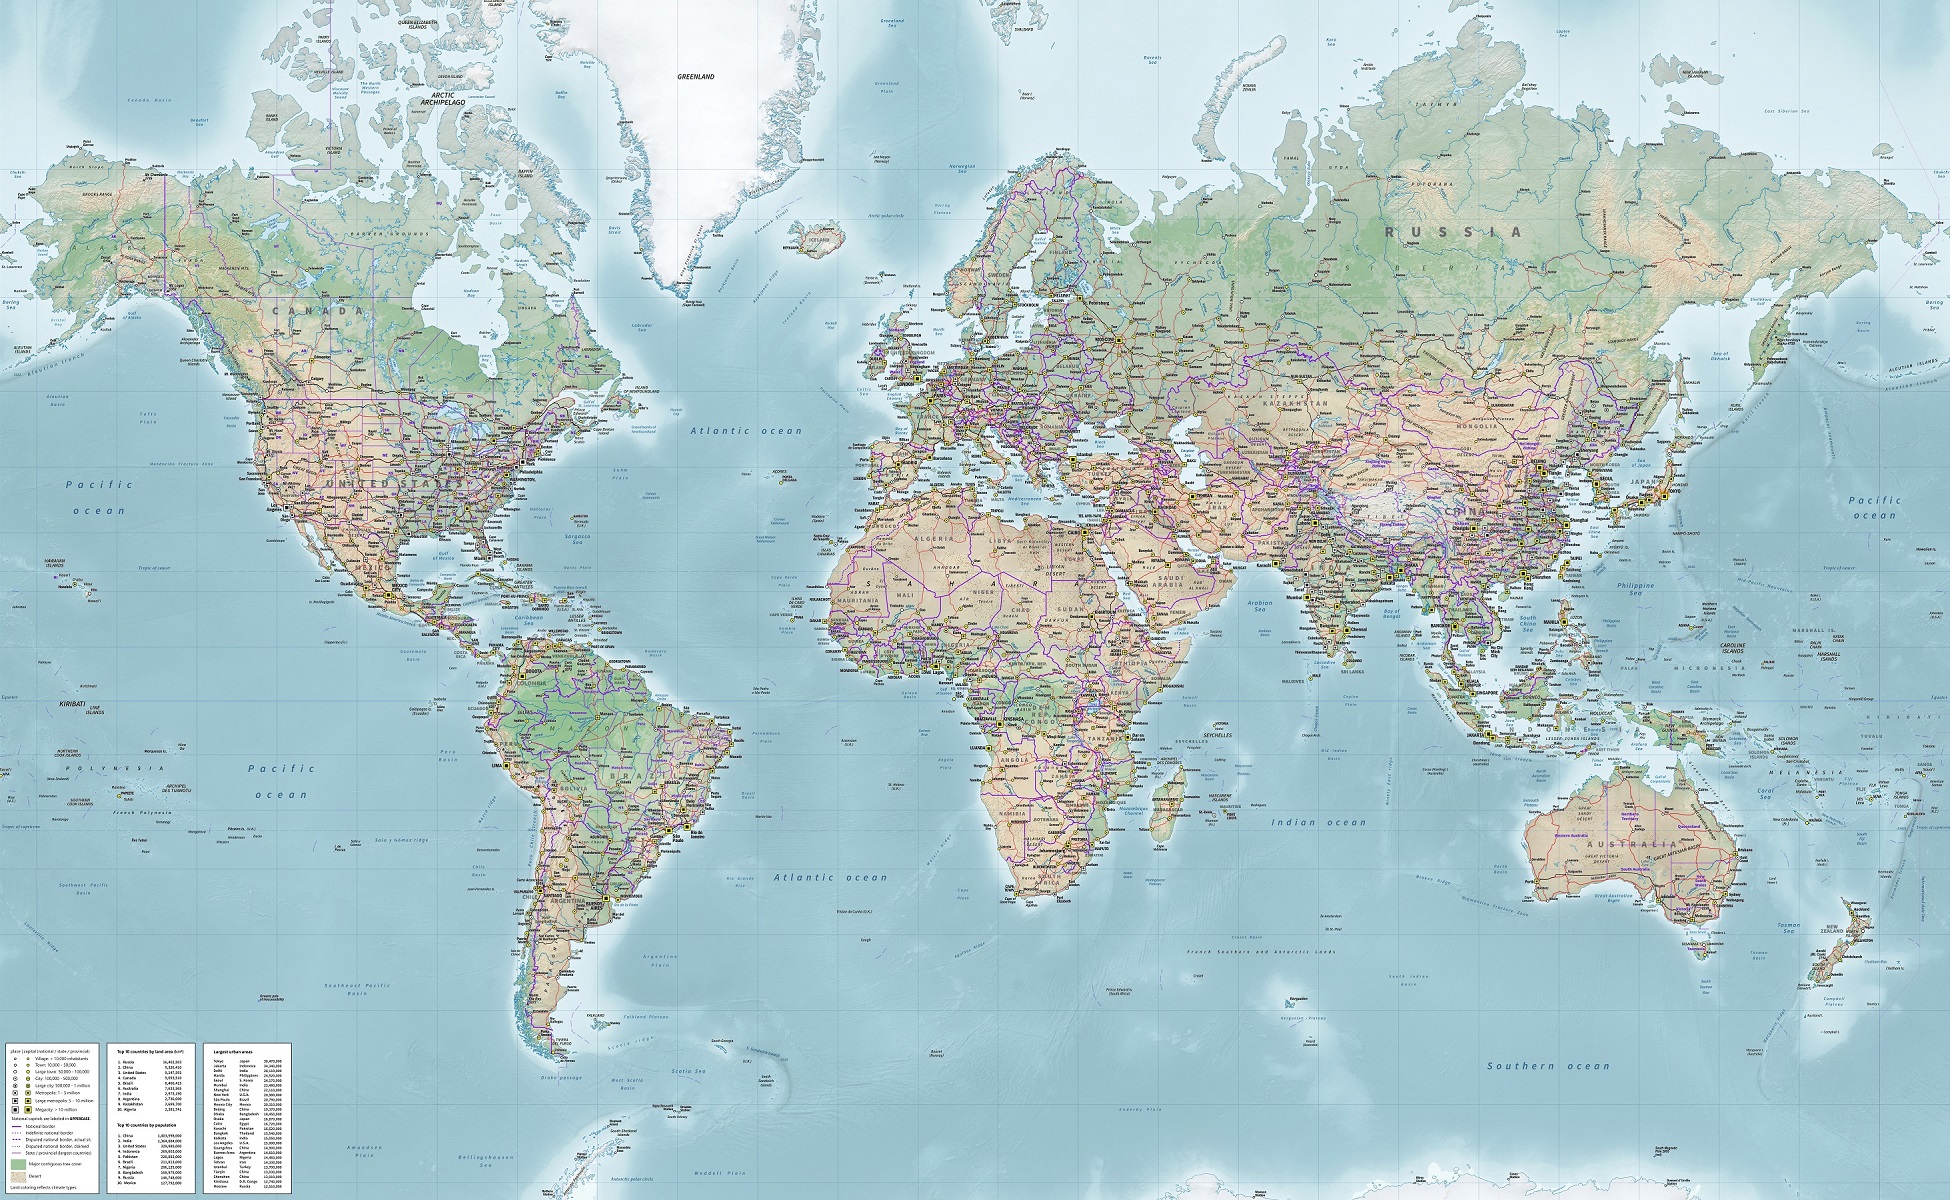
What is the difference between a physical map and political map? The main difference between a physical map and a political map is the type of information they convey.
A physical map shows the physical features and sometimes elevation of a particular area or region, using contour lines to represent changes in elevation and shape. It provides a visual representation of the terrain’s features, such as mountains, valleys, and plateaus. This type of map is commonly used in outdoor recreation, geology, and other fields where a clear and detailed representation of the land’s elevation is required.
On the other hand, a political map shows the boundaries of countries, states, provinces, and other political entities, as well as major cities, roads, and other man-made features. It provides information about the administrative divisions of a particular region, as well as its population centers and transportation networks. Political maps are commonly used in social studies, history, and other fields where an understanding of the political geography of a region is required.
Overall, while both types of maps provide valuable information about a particular region, they differ in the type of information they convey. A physical map focuses on the physical features of the land, while a political map focuses on its political boundaries and man-made features.
What is the purpose of a physical map? The purpose of a physical map is to provide a clear and detailed representation of the physical features and sometimes elevation of a particular area or region.
These maps are commonly used in outdoor recreation, such as hiking and camping, to help users navigate and understand the natural environment. Hikers can use contour lines to identify steep slopes, valleys, ridges, and other features that may impact their route.
In geology, physical maps are used to study the earth’s surface and subsurface features, such as fault lines and geological formations. They are also used in cartography to create topographic maps, which show the land’s elevation and shape in a two-dimensional format.
Overall, the purpose of a physical map is to provide a visual representation of the terrain’s features, allowing users to better understand and navigate the natural environment, as well as to study and analyze geological and topographical data.
What feature would most likely appear on a physical map? The most likely feature to appear on a physical map is the terrain, including mountains, valleys, plateaus, rivers, and lakes, as well as man-made features such as roads, buildings, and infrastructure. The primary purpose of a physical map is to provide a clear and detailed representation of the natural features of a particular region, allowing users to better navigate and understand the terrain.
What can you learn from a physical map? A physical map can provide a wealth of information about a particular region’s physical features. Here are some of the things you can learn from a physical map:
- Elevation: Sometimes the physical map will show the elevation of the land. By looking at the contour lines, you can determine the height and shape of the terrain, including the location of mountains, valleys, and plateaus.
- Slope: The spacing and direction of the contour lines can also give you an idea of the slope of the land. The closer together the contour lines, the steeper the slope.
- Waterways: A physical map can also show the location of rivers, lakes, and other bodies of water. This information can be useful for planning fishing trips, boating excursions, or simply exploring the local scenery.
- Navigation: A physical map can be used for navigation, whether you’re hiking, biking, or driving. By studying the map, you can plan your route and avoid difficult terrain or obstacles.
- Climate: The elevation and shape of the land can also give you an idea of the local climate. Higher elevations tend to be cooler, while lower elevations are warmer. Valleys and other low-lying areas can be prone to fog and moisture.
Overall, a physical map is an excellent tool for understanding and exploring the physical features of a particular region. Whether you’re a hiker, a geographer, or simply someone who loves to explore the great outdoors, a physical map can provide valuable information and insights.
Do you have a question we didn’t answer? Don’t hesitate to contact us at 1-385-206-8700 or [email protected].
Worldwide Delivery
WhiteClouds has delivered maps around the world.
History of Physical Maps
The history of physical maps is a fascinating story of innovation, exploration, and technological advancement. From the earliest maps created by ancient civilizations to the modern digital maps of today, physical maps have been an essential tool for understanding and navigating the natural world.
The history of physical maps can be traced back to ancient civilizations such as the Greeks, Romans, and Chinese. These cultures created maps that depicted the contours of the land, often using techniques such as shading, hatching, and perspective. These maps were primarily used for navigation, trade, and military purposes.
During the Middle Ages, European cartographers began to develop more sophisticated techniques for creating physical maps. They used contour lines and shading to create more detailed and accurate representations of the land. One of the most famous examples of a physical map from this period is the Mappa Mundi, a circular map of the world created in the 13th century.
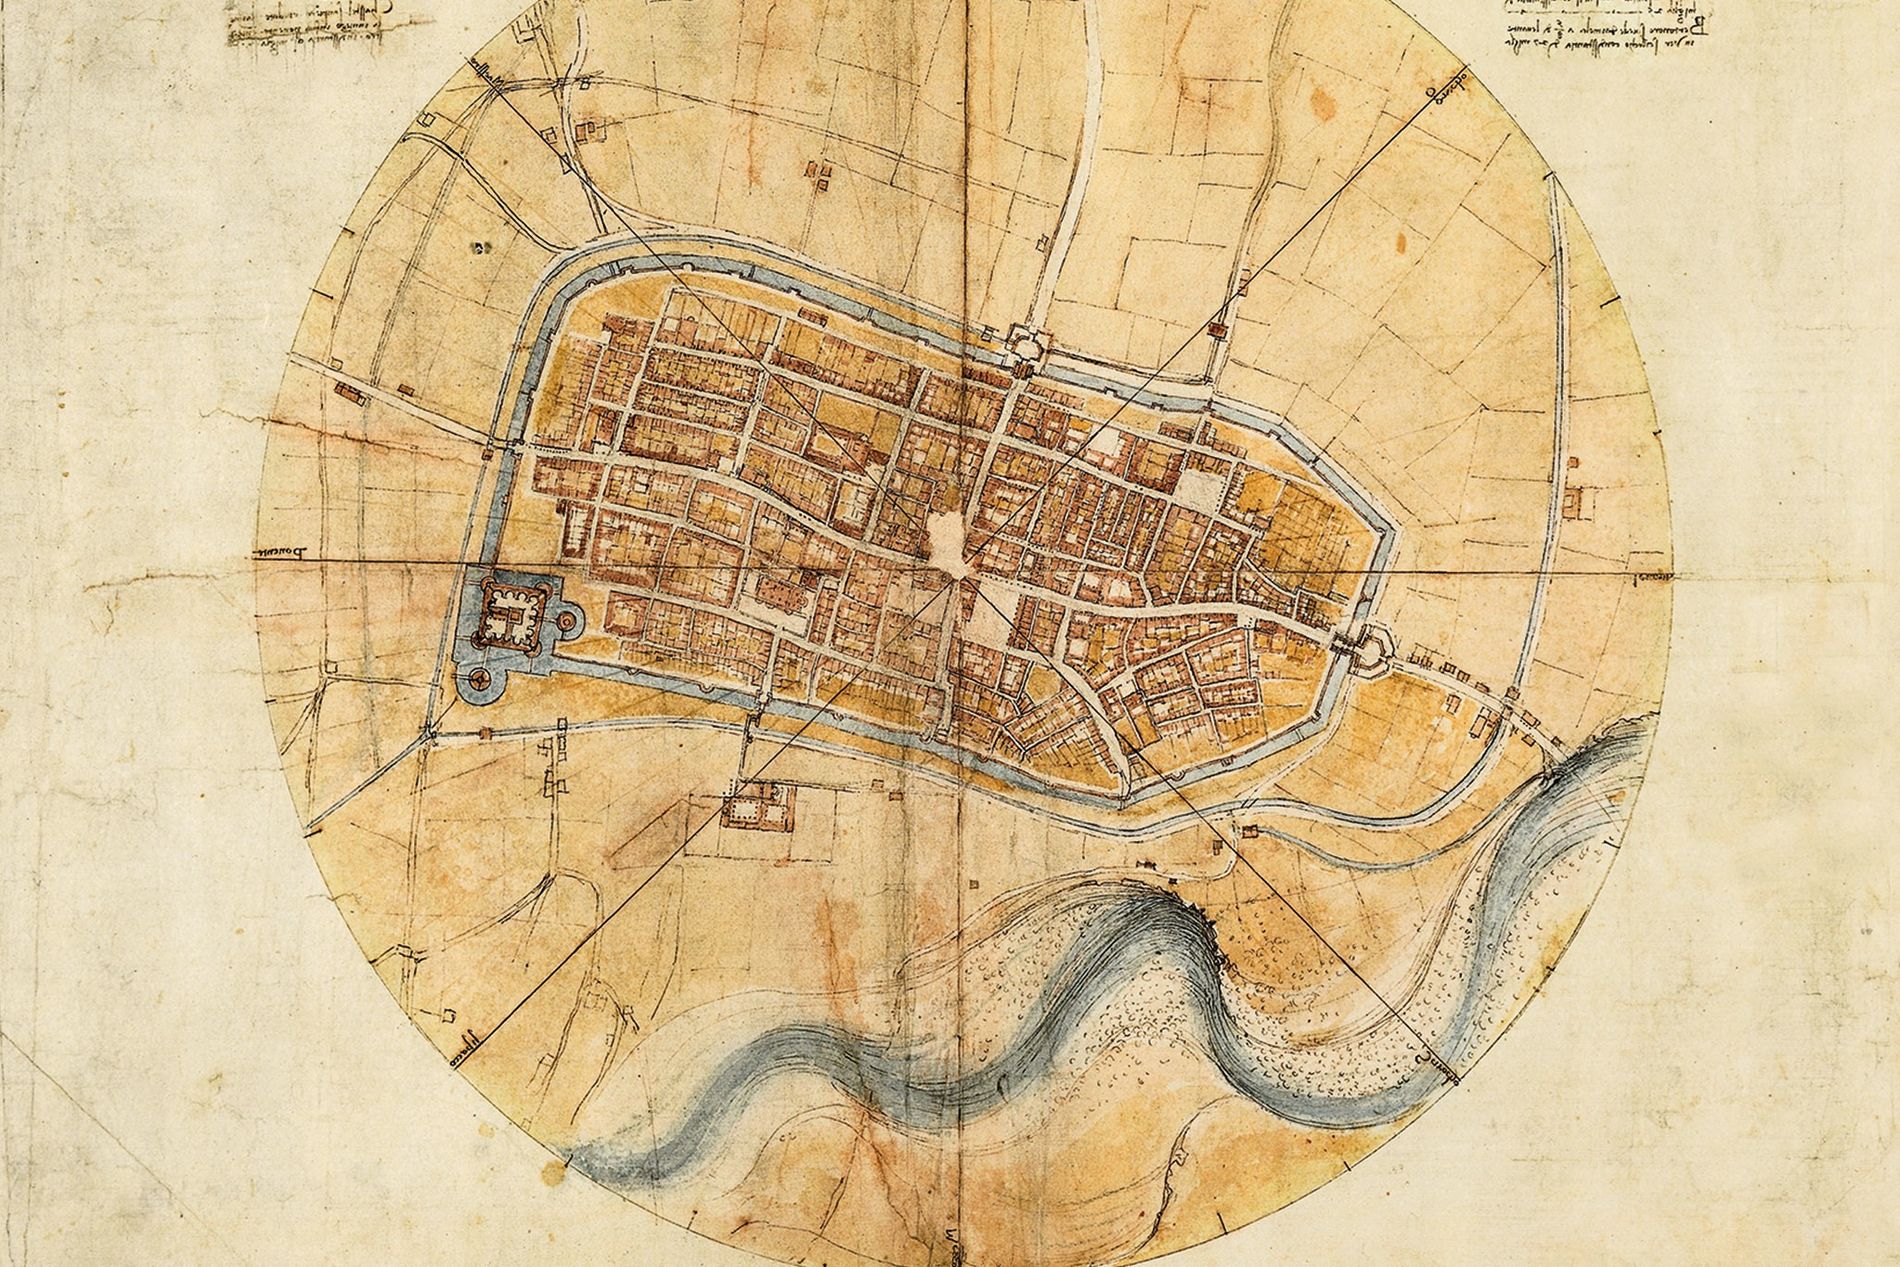
During the Renaissance, advances in science and technology led to even more significant developments in the field of physical maps. The development of perspective drawing allowed cartographers to create more accurate and realistic maps of the land. Artists such as Leonardo da Vinci and Albrecht Dürer created maps that were not only functional but also works of art.
The Age of Exploration in the 15th and 16th centuries saw a significant increase in the creation of physical maps. Explorers such as Christopher Columbus and Vasco da Gama used maps to navigate the oceans and chart new territories. These maps were often created by hand, and the artists who created them were highly skilled.
The 19th and 20th centuries saw the rise of modern cartography and the development of new technologies for creating physical maps. In the late 19th century, contour lines were introduced as a standard technique for representing physical on maps. This allowed cartographers to create more accurate and detailed maps of the land.
The advent of aerial photography in the early 20th century revolutionized the field of physical mapping. Aerial photographs provided a new perspective on the land, allowing cartographers to create even more detailed and accurate maps. The development of digital technology in the latter half of the 20th century allowed for the creation of highly detailed and interactive physical maps.
The history of physical maps is a rich and varied one. From the earliest maps created by ancient civilizations to the modern digital maps of today, physical maps have been an essential tool for understanding and navigating the natural world. The development of new technologies and techniques over time has led to increasingly accurate and detailed maps, allowing us to better understand and appreciate the world around us. As we continue to explore and discover new territories, the importance of physical maps will only continue to grow.