
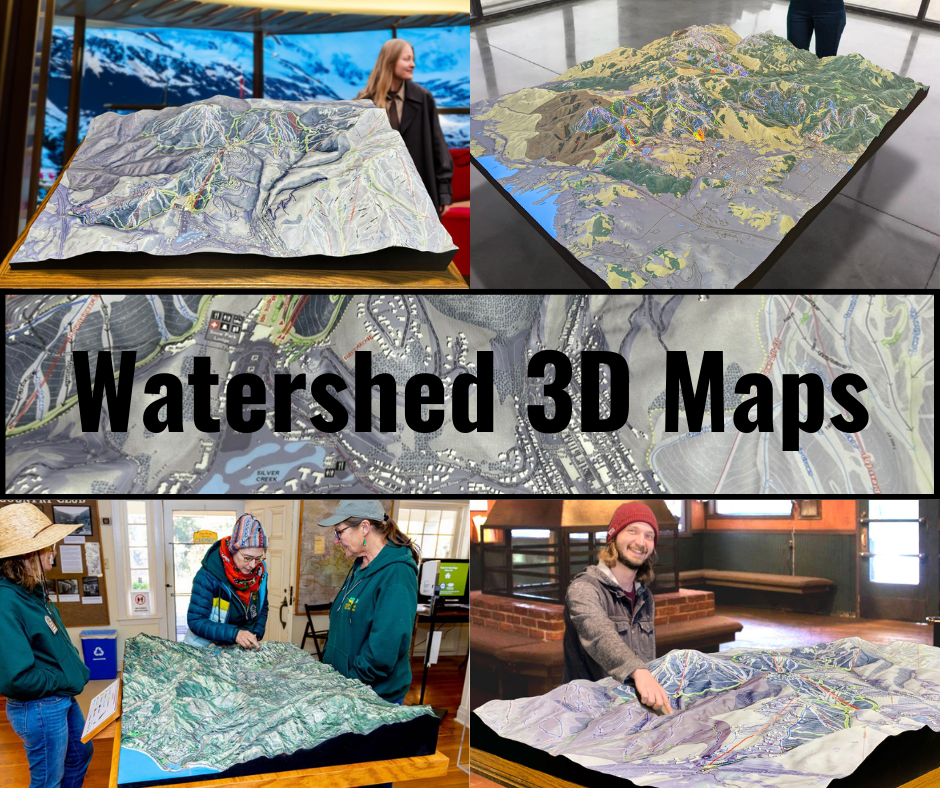
The San Joaquin River Watershed Map: Unveiling California’s Lifeline
The San Joaquin River Watershed is a crucial component of California’s hydrology, weaving its way through one of the state’s most agriculturally productive and ecologically diverse regions. Spanning approximately 15,880 square miles, the watershed encompasses rivers, tributaries, wetlands, and reservoirs that support wildlife, communities, and economies. The San Joaquin River Watershed Map provides an essential tool for understanding this intricate system, showcasing how its various elements interconnect to shape the Central Valley and beyond.
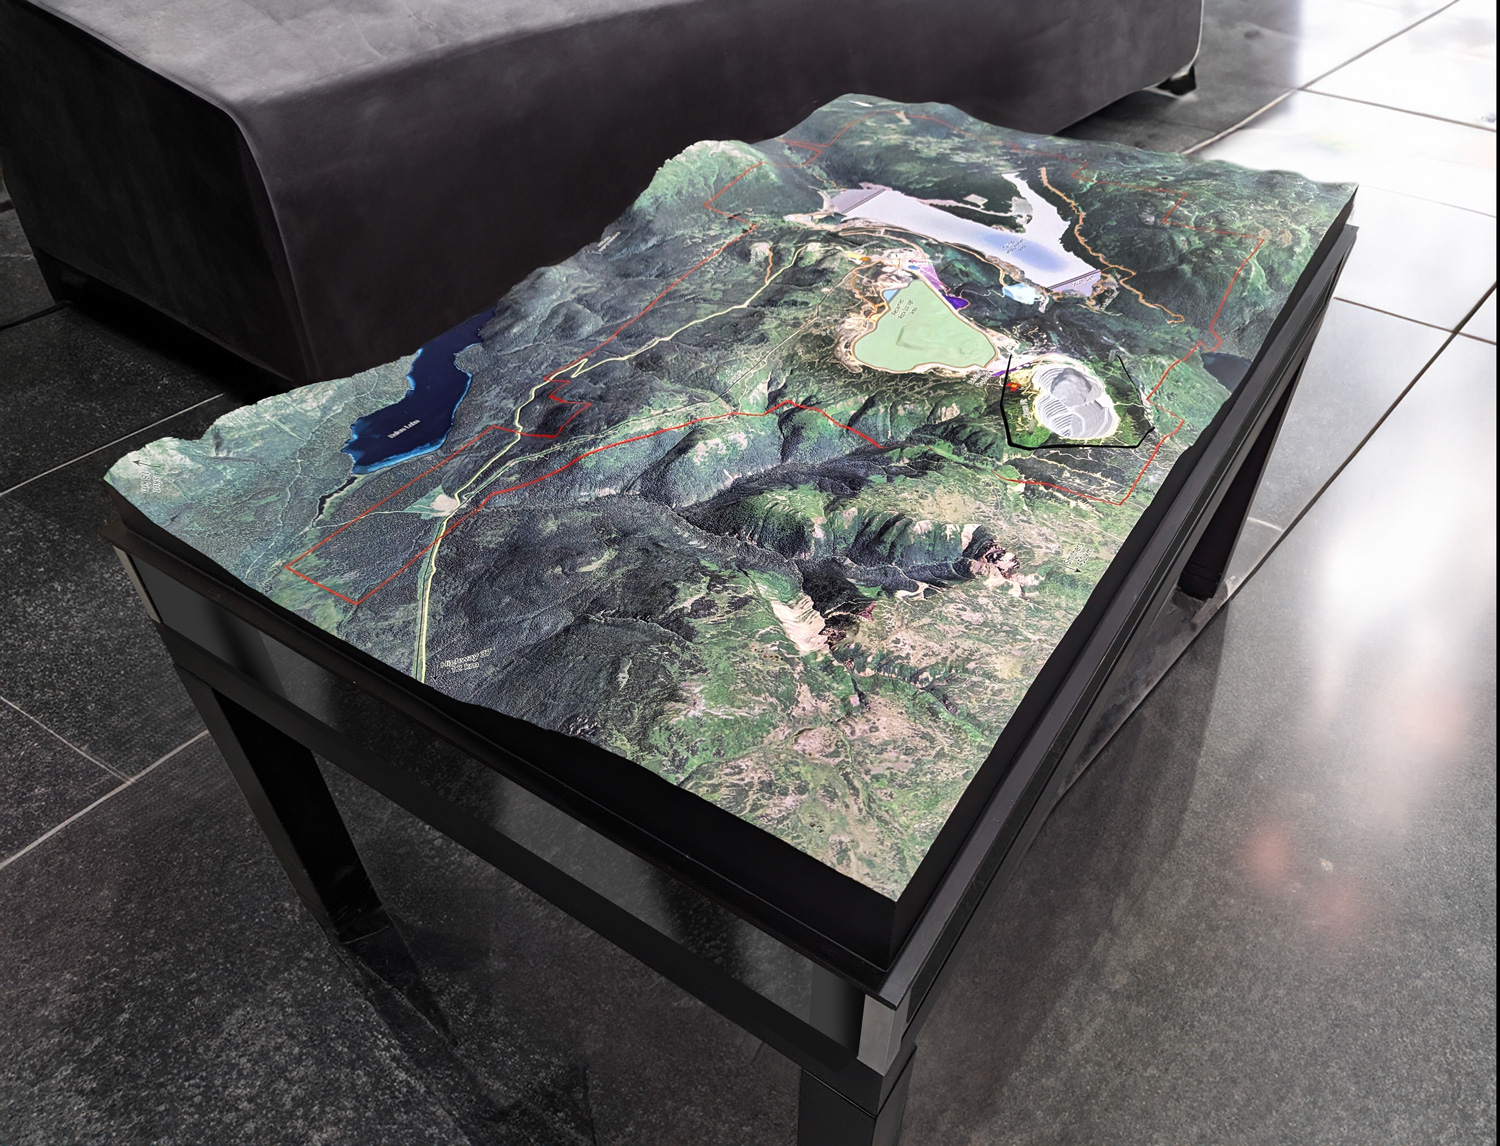
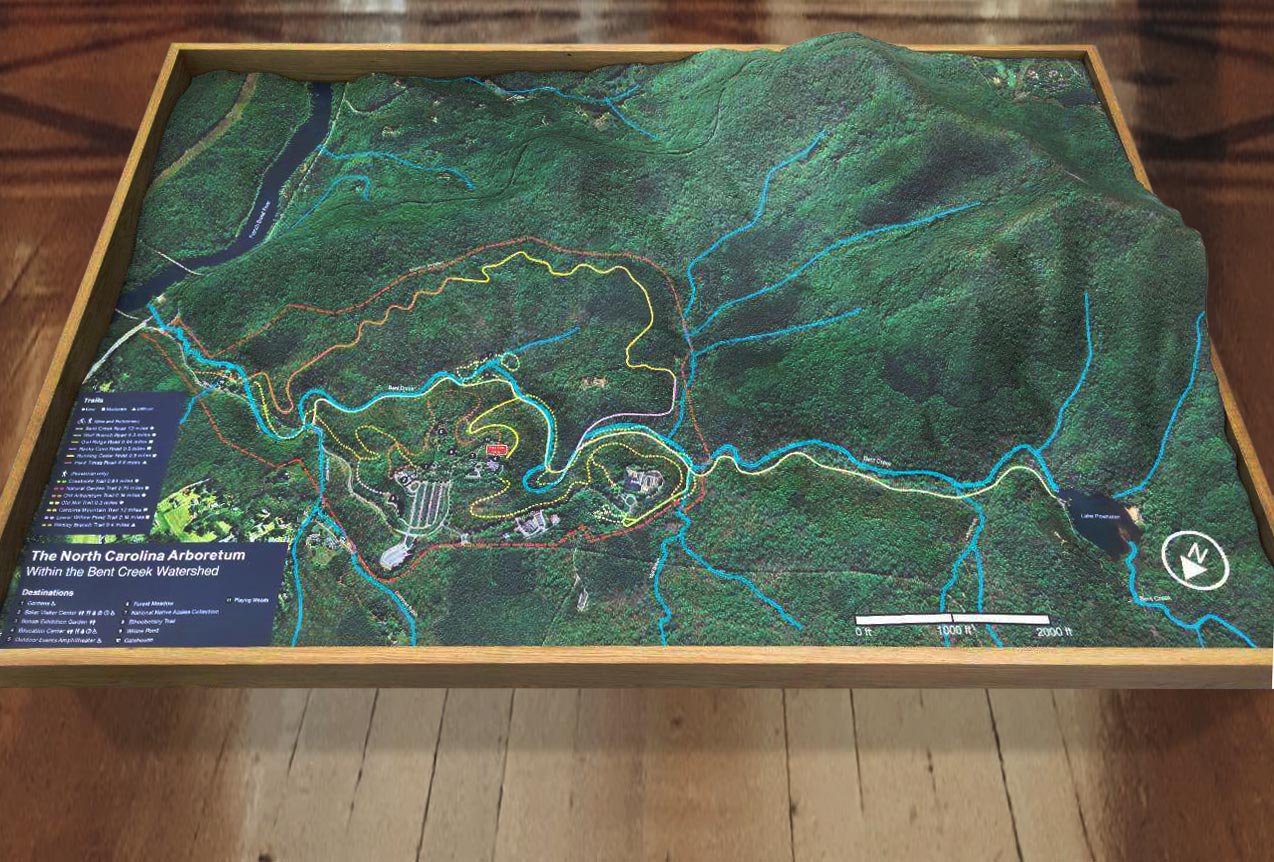
Diving into the San Joaquin River Watershed Map reveals the river’s dynamic flow from its headwaters in the Sierra Nevada to its confluence with the Sacramento River. Along the way, it irrigates the agricultural powerhouse of the Central Valley and supports wetlands critical for biodiversity. Through advancements in mapping technologies, including 3D models such as those created for the Green River Watershed, we can better comprehend the San Joaquin’s challenges and opportunities in an era of increasing environmental pressures.
Tracing the San Joaquin River: Geography and Hydrology of the Watershed
The San Joaquin River originates high in the Sierra Nevada, fed by snowmelt from peaks such as Mount Lyell and Mount Ritter. From there, the river descends into the San Joaquin Valley, carving a path through one of the world’s most productive agricultural regions before joining the Sacramento River in the Sacramento-San Joaquin Delta. The San Joaquin River Watershed Map highlights this journey, detailing the river’s major tributaries, including the Tuolumne, Merced, Stanislaus, and Mokelumne Rivers.
The map captures the watershed’s hydrological complexity, illustrating how snowmelt, rainfall, and groundwater recharge work together to sustain its flow. The Sierra Nevada snowpack acts as a natural reservoir, storing water during the winter and releasing it slowly throughout the spring and summer. This gradual flow is essential for agriculture, ecosystems, and urban water supplies.
Reservoirs such as Millerton Lake and Don Pedro Reservoir play a critical role in regulating the river’s flow. The map shows how these reservoirs collect and release water to balance competing demands for irrigation, hydropower, and flood control. It also highlights the network of canals and aqueducts, including the Friant-Kern Canal, that distribute water across the valley.
Ecosystems and Biodiversity in the San Joaquin River Watershed
The San Joaquin River Watershed is a mosaic of habitats, from alpine meadows in the Sierra Nevada to wetlands in the Central Valley and estuarine ecosystems in the Delta. These diverse environments support a wide array of plant and animal species, many of which are unique to California. The San Joaquin River Watershed Map provides an invaluable perspective on these ecosystems, helping to visualize their distribution and interconnectedness.
The upper watershed is characterized by alpine forests and meadows that support species such as black bears, mule deer, and golden eagles. The map highlights these areas, illustrating how they serve as headwaters for the river and its tributaries. Moving downstream, riparian habitats along the riverbanks provide critical corridors for migratory birds and other wildlife. These habitats are especially important in the Central Valley, where they act as green oases in an otherwise intensively cultivated landscape.
Wetlands within the watershed, such as those in the Grasslands Ecological Area, are among the most significant habitats for waterfowl in North America. The map emphasizes these wetlands, showcasing their role as vital stopovers along the Pacific Flyway. These areas support millions of migratory birds each year, including sandhill cranes, pintails, and snow geese.
The Delta, where the San Joaquin River meets the Sacramento River, is a unique estuarine ecosystem that provides habitat for fish such as Chinook salmon, Delta smelt, and steelhead trout. The map reveals how the river’s flow influences this critical habitat, underscoring the importance of maintaining water quality and flow consistency for the Delta’s health.
Human Influence and Water Management Challenges
The San Joaquin River Watershed has long been shaped by human activity, from Indigenous stewardship to modern agriculture and urban development. These activities have brought both benefits and challenges, altering the watershed’s natural dynamics and raising questions about sustainability. The San Joaquin River Watershed Map provides a detailed view of these influences, helping stakeholders address pressing management issues.
Agriculture is the dominant land use in the Central Valley, with the region producing a significant portion of the nation’s fruits, nuts, and vegetables. The map identifies agricultural zones and their proximity to rivers, wetlands, and reservoirs, offering insights into how land use practices affect water quality and ecosystem health. Fertilizer runoff, pesticide use, and groundwater pumping are among the key issues highlighted.
Urban areas such as Fresno, Stockton, and Modesto add further complexity to the watershed. The map shows these cities and their associated infrastructure, such as stormwater systems and wastewater treatment plants. Understanding the interplay between urban development and the watershed’s hydrology is critical for sustainable planning and pollution control.
Water management in the San Joaquin River Watershed is also heavily influenced by legal and political frameworks, including the Central Valley Project and California’s Sustainable Groundwater Management Act. The map serves as a visual tool for navigating these complexities, helping to balance the needs of agriculture, cities, and ecosystems.