
Exploring the Fly River Watershed: A Vital Resource in Papua New Guinea
The Fly River, the longest river in Papua New Guinea, is one of the most important waterways in the Oceania region. Flowing across a vast expanse of the island, the Fly River spans approximately 1,050 kilometers before emptying into the Gulf of Papua. The Fly River Watershed, which encompasses a substantial area of nearly 86,000 square kilometers, is integral to the region’s ecological, economic, and social systems. The river supports numerous local communities, provides water for agriculture and fishing, and sustains a wide range of biodiversity in the surrounding ecosystems.
One of the remarkable features of the Fly River is its complexity, with its many tributaries, wetlands, and estuaries contributing to a rich and diverse landscape. The Fly River Basin is a vital source of freshwater, but it is also a region that faces increasing challenges due to deforestation, pollution, and over-exploitation of resources. The effects of climate change, particularly altered rainfall patterns and more frequent floods, are further exacerbating the situation. In this blog, we will delve into the geography, hydrology, and ecological significance of the Fly River Watershed, and explore how advanced 3D mapping technologies are being used to understand and preserve this vital water system.
Geography and Hydrology of the Fly River Watershed
The Fly River begins in the central highlands of Papua New Guinea, emerging from the mountainous regions before flowing across the lowland plains toward the Gulf of Papua. The river is fed by numerous tributaries, including the Strickland and Ok Tedi rivers, which drain water from the surrounding mountains and highlands. These rivers converge to form the main stem of the Fly River, which meanders across the basin, providing water to both remote villages and larger towns along the way.
The geography of the Fly River Watershed is diverse, ranging from the rugged, forested mountains in the river’s upper reaches to the wide floodplains and wetlands in the lower parts of the watershed. The basin includes a variety of ecosystems, from dense rainforests to savannas, swamps, and wetlands. As the Fly River flows toward the coast, it passes through a series of mangrove forests and tidal estuaries that are crucial for the region’s marine life.
The hydrology of the Fly River is primarily driven by seasonal rainfall patterns, which cause the river to swell during the wet season (November to March). During this time, the river can experience substantial flooding, affecting the surrounding floodplains and wetlands. The dry season, from May to October, sees a reduction in water flow, as rainfall decreases and the river’s flow stabilizes.
The flow of the Fly River is also influenced by the numerous dams, logging operations, and mining activities in the region. Notably, the Ok Tedi mine, located near the headwaters of the river, has significantly impacted the river’s water quality, leading to contamination from heavy metals and other pollutants. The construction of dams and diversion of water for mining and agriculture have further altered the natural flow patterns of the river, exacerbating water quality issues.
Ecological Significance of the Fly River Watershed
The Fly River Watershed is one of the most biodiverse regions in Papua New Guinea, providing critical habitat for a wide variety of plants, animals, and marine species. The river itself supports numerous species of fish, including the native Fly River catfish, and provides a vital water source for the surrounding communities, many of whom rely on fishing for sustenance. The river is also home to a number of endangered species, such as the freshwater crocodile and various species of turtles.
The wetlands and floodplains along the Fly River are incredibly important for maintaining biodiversity. These areas provide breeding grounds for aquatic species and migratory birds, and they also support a range of terrestrial animals, including mammals like wild pigs and marsupials. The floodplains are particularly important during the wet season, as they allow the river to overflow and deposit nutrients across the landscape, enriching the soil and supporting agricultural activities.
Mangrove forests, which line the river’s estuaries and the coastline, also provide important ecosystem services. These forests act as nurseries for marine species, filter pollutants from the water, and provide protection from coastal erosion. The Fly River Basin’s diverse ecosystems also help regulate the local climate, acting as carbon sinks and stabilizing the region’s water cycle.
However, these ecosystems are increasingly at risk. Deforestation, industrial pollution, and climate change are all contributing to the degradation of the watershed’s biodiversity. The impacts of mining, logging, and agriculture on the river’s water quality are particularly concerning, as these activities threaten both aquatic species and the health of local communities that depend on the river for drinking water and agriculture.
The Role of 3D Mapping in Understanding the Fly River Watershed
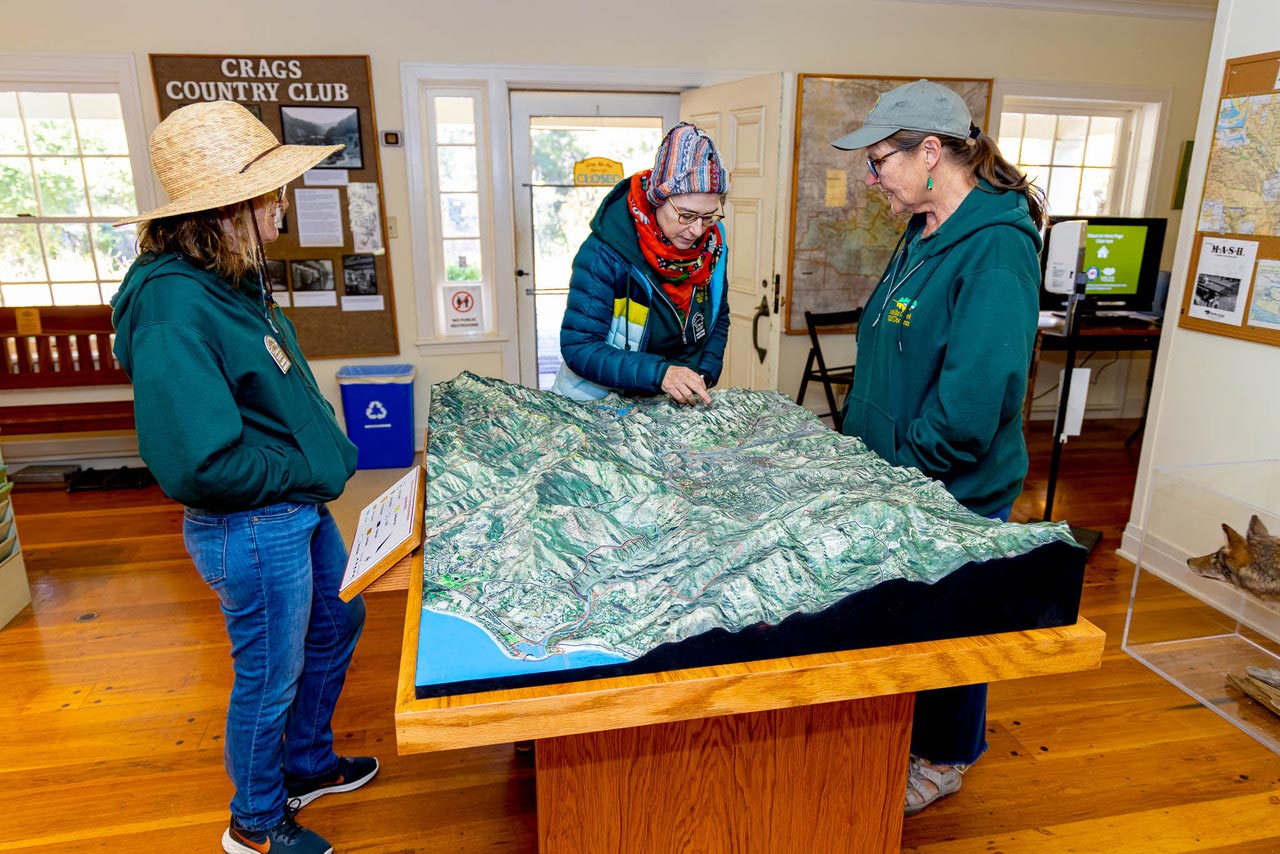
Mapping the Fly River Watershed is essential for understanding its complex hydrology, land use, and ecology. By creating detailed maps, scientists and environmental organizations can gain a better understanding of how the river’s water flow interacts with surrounding ecosystems, track changes in water quality, and identify vulnerable areas that require conservation efforts.
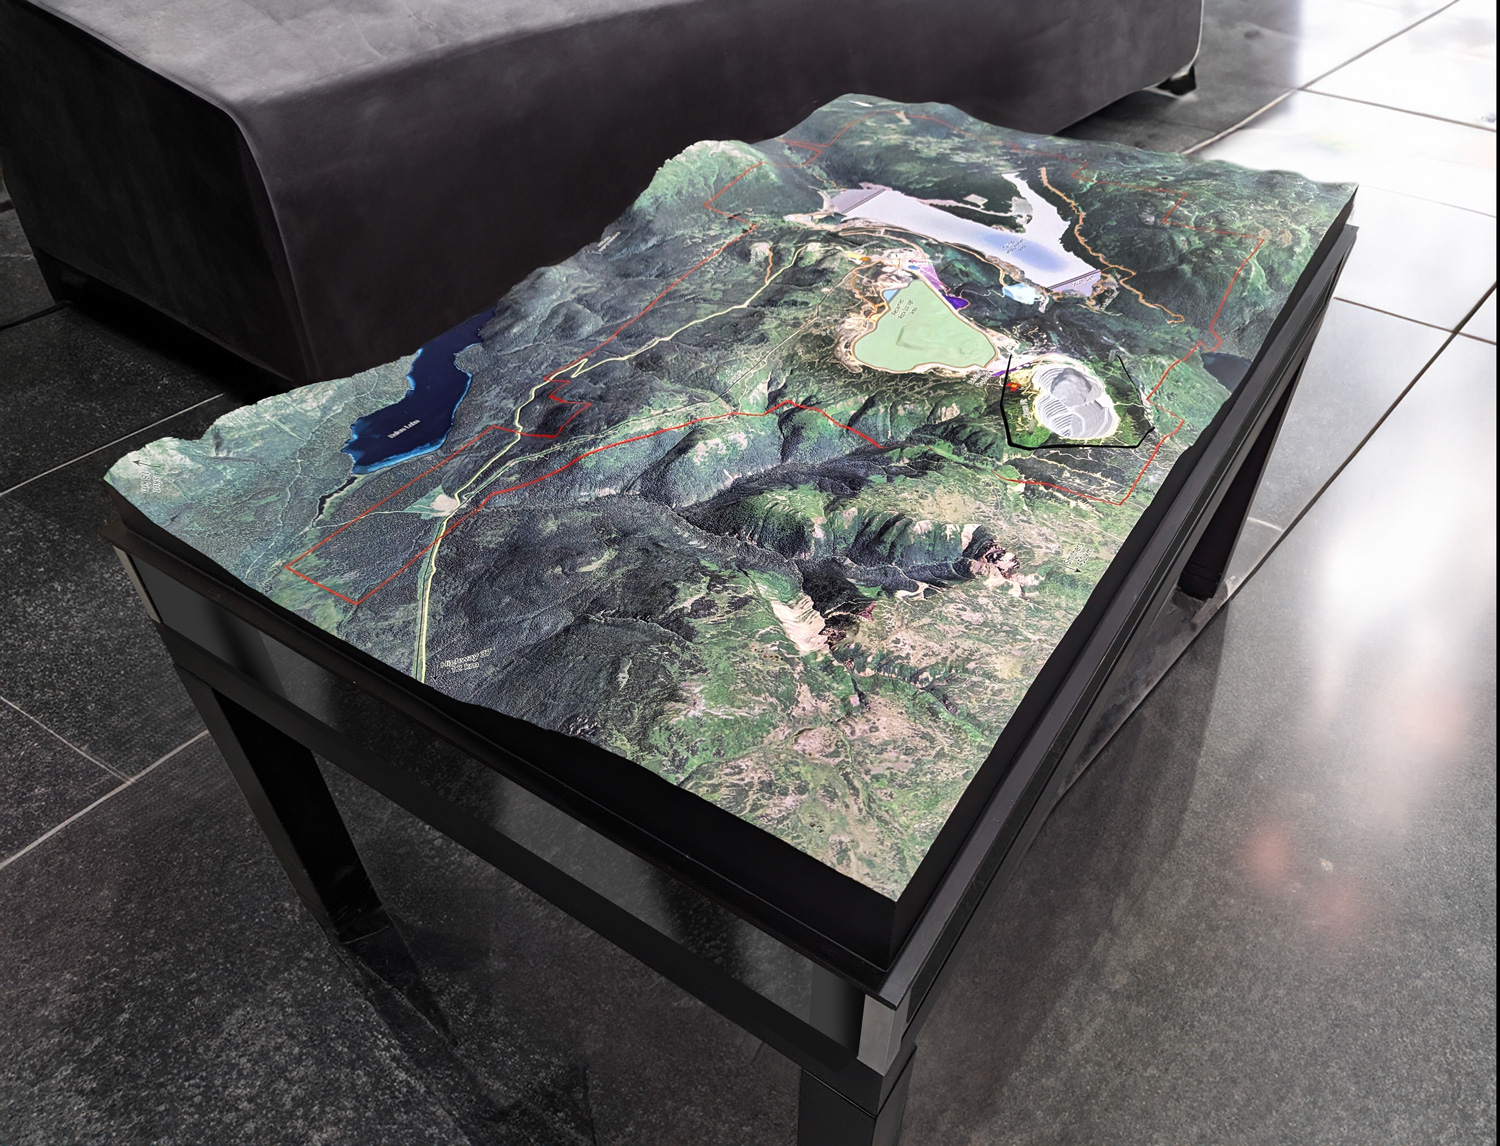
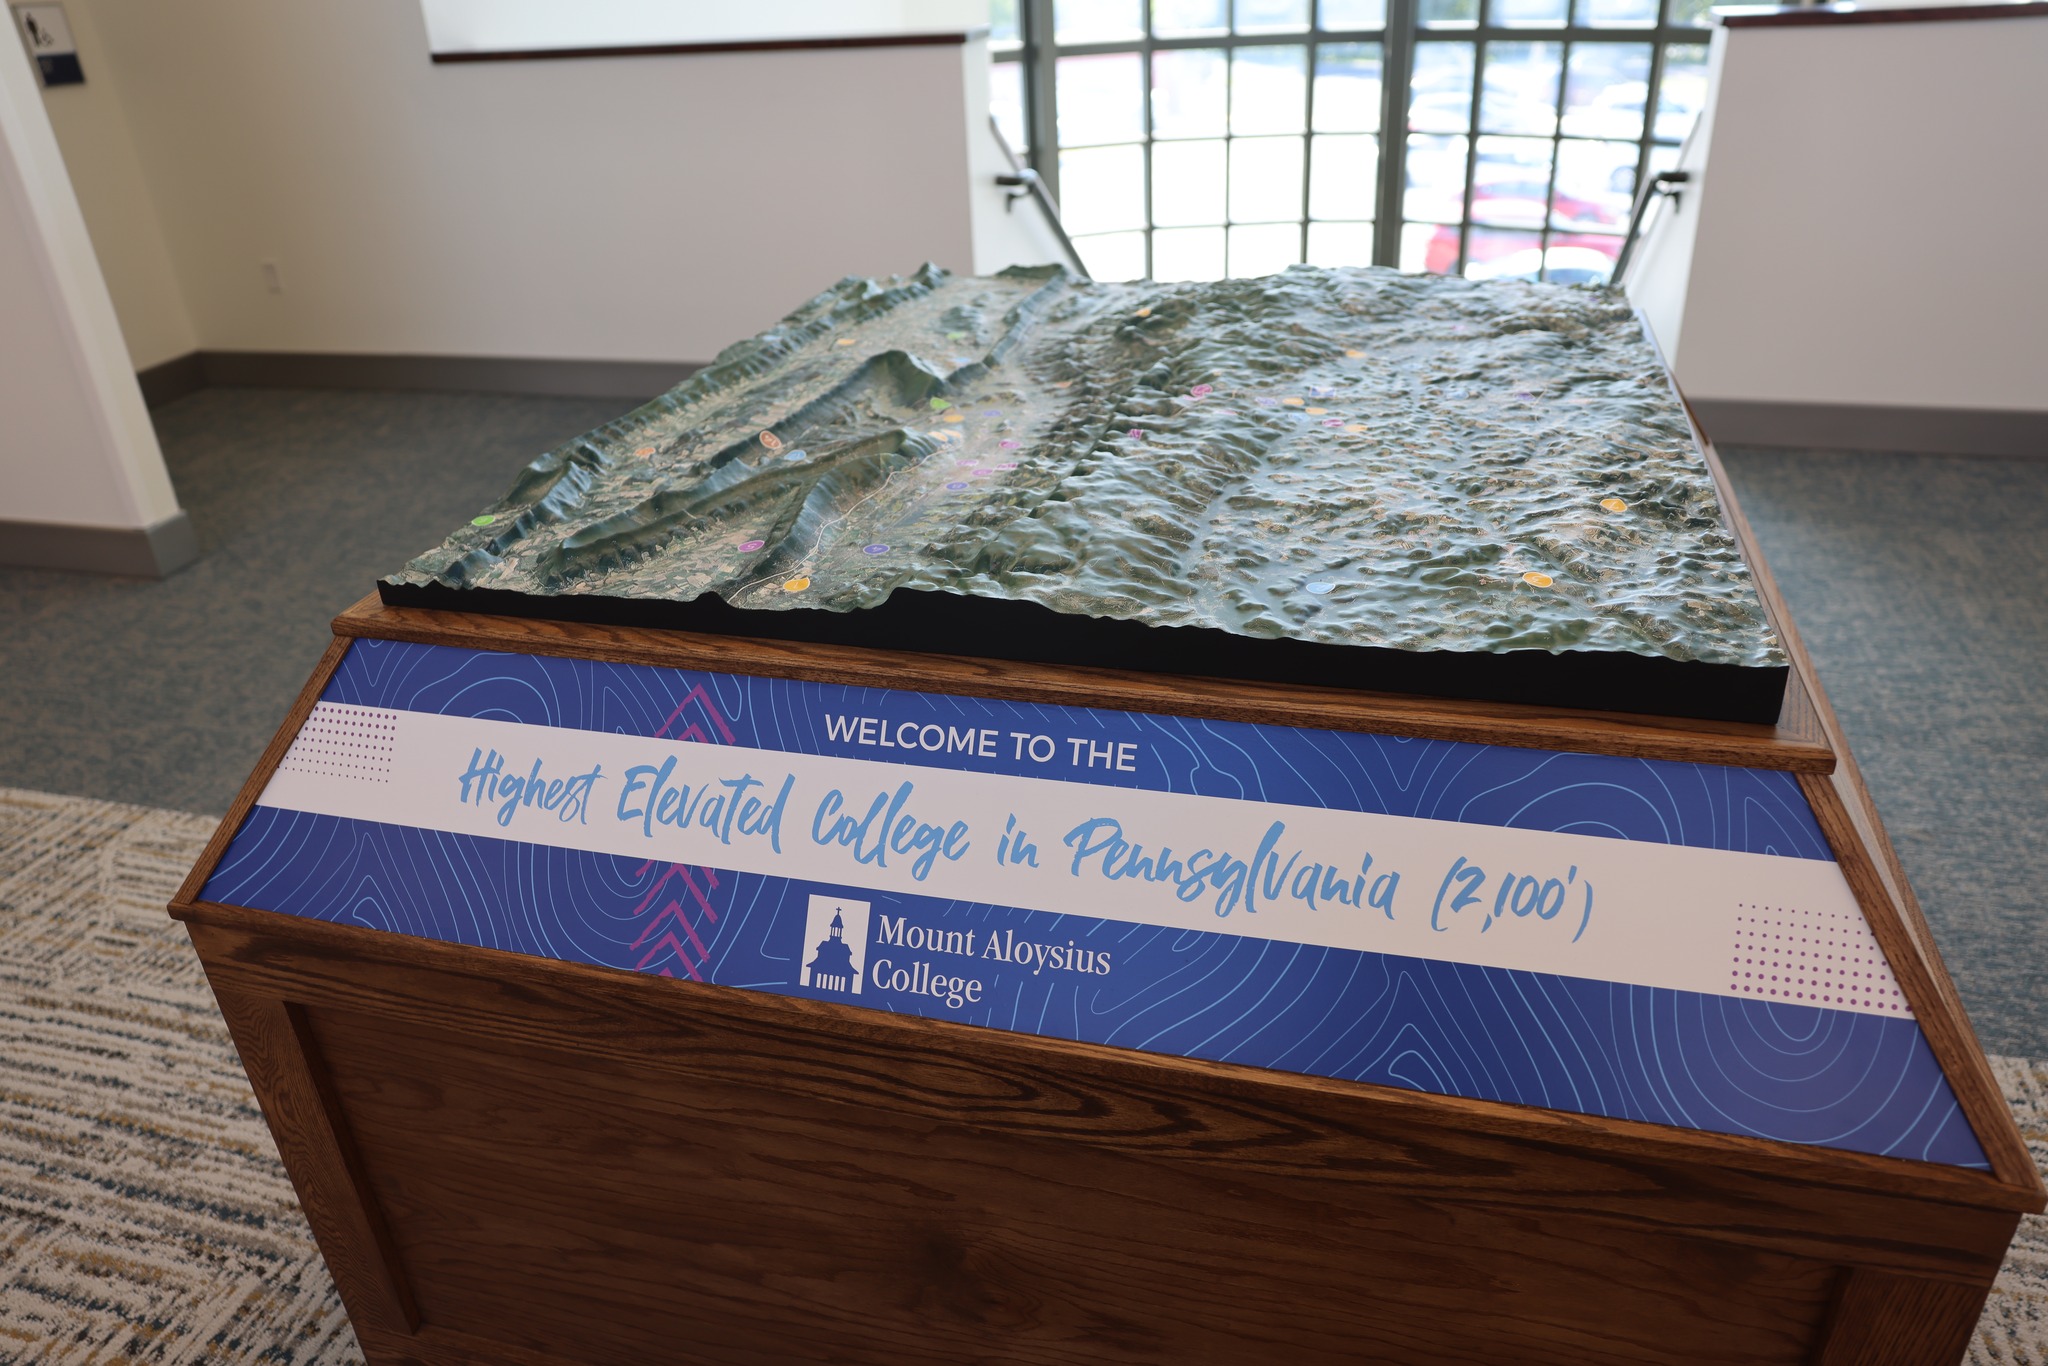
One of the most powerful tools for studying the Fly River Watershed is 3D mapping technology. Using satellite imagery, geographic information systems (GIS), and remote sensing data, experts can create highly detailed digital models of the watershed. These 3D maps allow users to visualize the river’s topography, water systems, and land cover in great detail, enabling better decision-making and resource management.
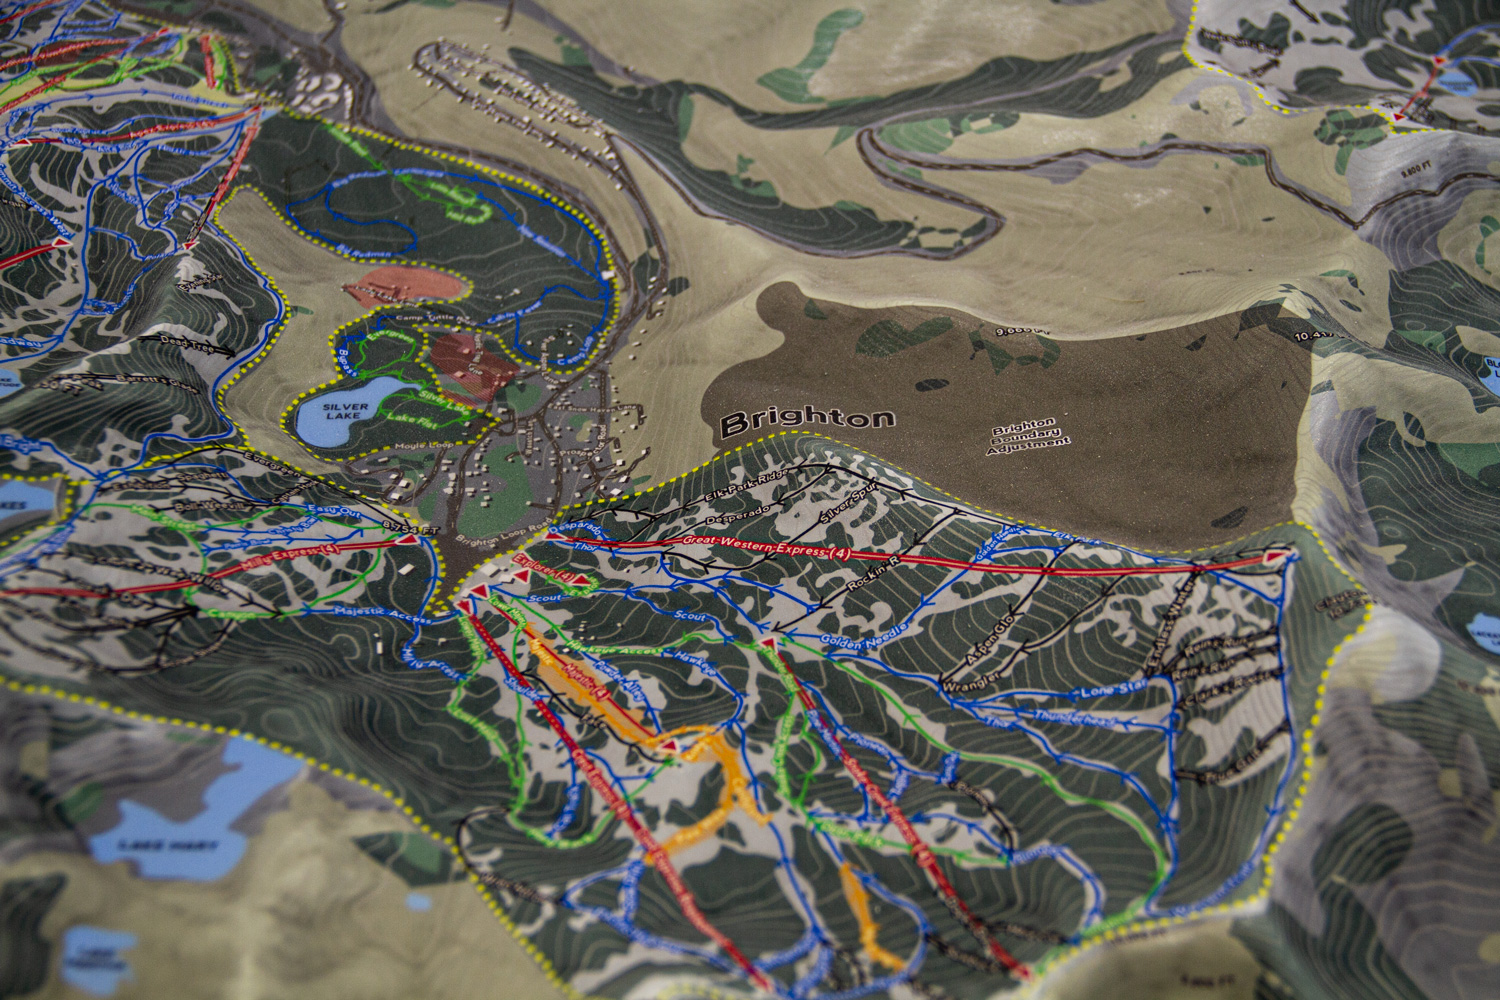
The use of 3D maps allows stakeholders to simulate different scenarios, such as changes in land use, climate patterns, or water extraction. These simulations help predict how the river and its ecosystems will respond to these changes, guiding conservation efforts and land-use policies. For example, a 3D map can help predict the effects of deforestation, sedimentation, or changes in rainfall on water quality and biodiversity.
3D mapping is also crucial for monitoring water quality. By integrating real-time data on pollutants, sediment levels, and nutrient concentrations, 3D maps provide insights into the sources of contamination and the areas most at risk. These maps can be used to track the success of water quality improvement initiatives and guide efforts to restore damaged ecosystems.