Nautical Maps

What is a Nautical Map?

We build 2D and 3D Nautical Maps

Table of Contents

Nautical Maps

For centuries, nautical maps have been a vital tool for sailors and navigators seeking to traverse the Earth’s vast and treacherous oceans.  With their intricate details, accurate depictions of coastlines and seafloor topography, and comprehensive information on currents and weather patterns, these maps have allowed seafarers to safely navigate the world’s waterways and discover new lands.

The history of nautical maps can be traced back to ancient civilizations such as the Phoenicians, who used simple maps and charts to navigate the Mediterranean Sea.  Over time, these early maps evolved to become more detailed and accurate, incorporating new information on coastal features, ports, and navigation hazards.

In the 16th and 17th centuries, nautical mapmaking reached new heights of sophistication and accuracy, thanks in large part to advances in maritime technology such as the invention of the chronometer, which allowed sailors to accurately determine their longitude at sea.  With the advent of these new tools and techniques, nautical maps became even more precise and comprehensive, providing sailors with the information they needed to navigate the world’s oceans with greater confidence and accuracy.

Nautical Maps-Sailing Chart-Straits of Florida 

Today, nautical maps remain an essential resource for sailors and navigators around the world.  With their ability to provide real-time data on weather patterns, currents, and other critical information, these maps are an indispensable tool for safe and effective navigation on the open sea.  Whether used by commercial shipping vessels, military fleets, or recreational boaters, nautical maps continue to play a crucial role in our understanding of the Earth’s vast and complex oceans.  Here are more of those uses:

  • Navigation:  One of the most important uses of nautical maps is for navigation.  By providing accurate and up-to-date information on currents, tides, water depths, and navigation hazards such as rocks and shoals, nautical maps allow sailors to safely navigate their vessels through even the most treacherous waters.  Whether used by commercial shipping vessels, military fleets, or recreational boaters, these maps are a vital tool for ensuring safe and efficient navigation on the open sea.
  • Scientific Research:  In addition to their use in navigation, nautical maps are also a valuable resource for scientific research.  By providing detailed information on ocean currents, bathymetry, and other critical data, these maps have allowed scientists to better understand the complex interactions of the Earth’s oceans and climate systems.  From tracking ocean temperatures and salinity levels to studying marine life and ecosystems, nautical maps have played a crucial role in advancing our understanding of the natural world.

Nautical Maps-Closeup Showing Fathoms 

  • Coastal Management:  Nautical maps are also an important tool for coastal management and resource planning.  By providing detailed information on coastal features such as beaches, wetlands, and estuaries, these maps can help communities and policymakers make informed decisions about land use, conservation, and development.  Whether used to plan for coastal infrastructure, protect sensitive ecosystems, or manage fisheries and other resources, nautical maps are a vital resource for ensuring the sustainable use of our planet’s natural resources.
  • Exploration:  Finally, nautical maps have also played a critical role in exploration and discovery throughout history.  From the early voyages of exploration by Christopher Columbus and Ferdinand Magellan to modern-day expeditions to the furthest reaches of the Arctic and Antarctic, nautical maps have been a vital tool for discovering new lands and expanding our understanding of the world’s oceans.

Nautical maps, also known as charts or hydrographic charts, come in a variety of types to suit different purposes and needs.  Each type of nautical map provides specific information on different aspects of the marine environment, from the coastline and water depths to currents and navigation hazards.

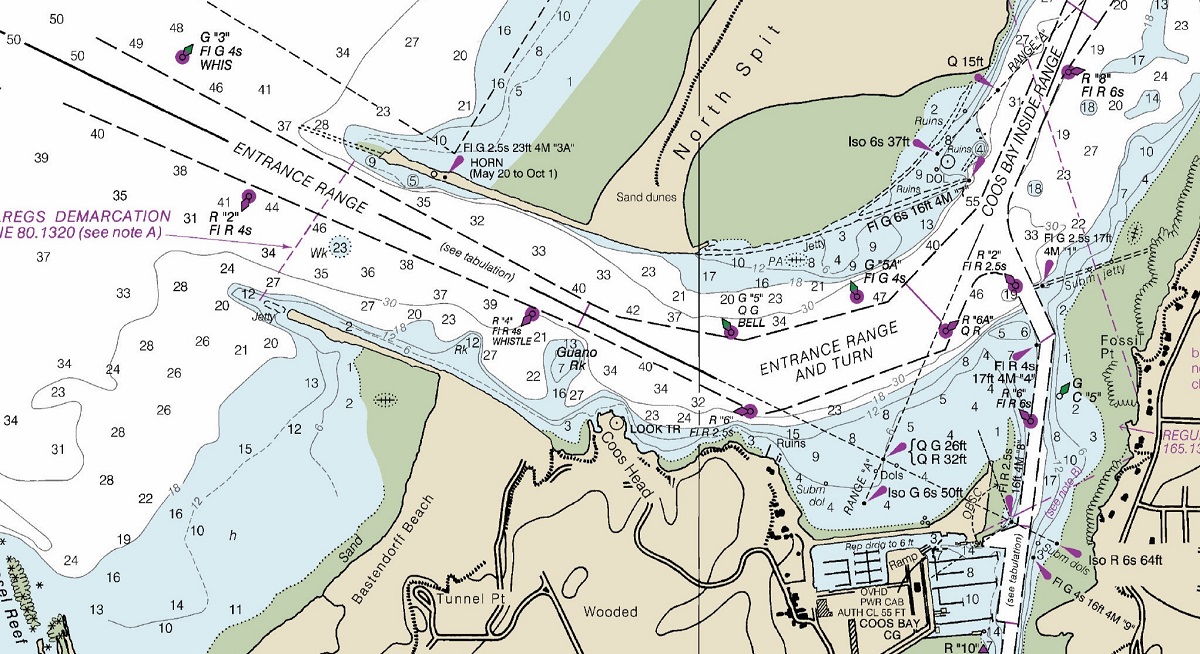
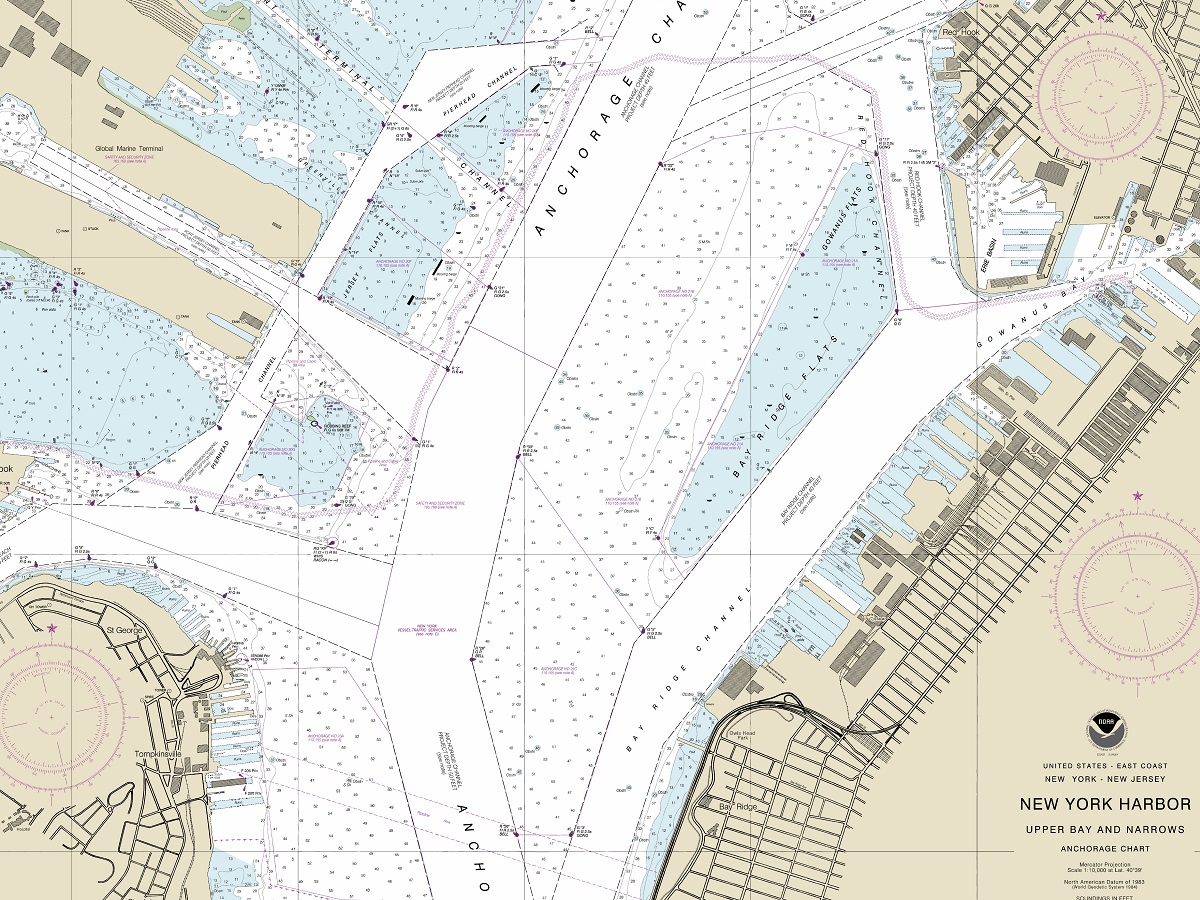
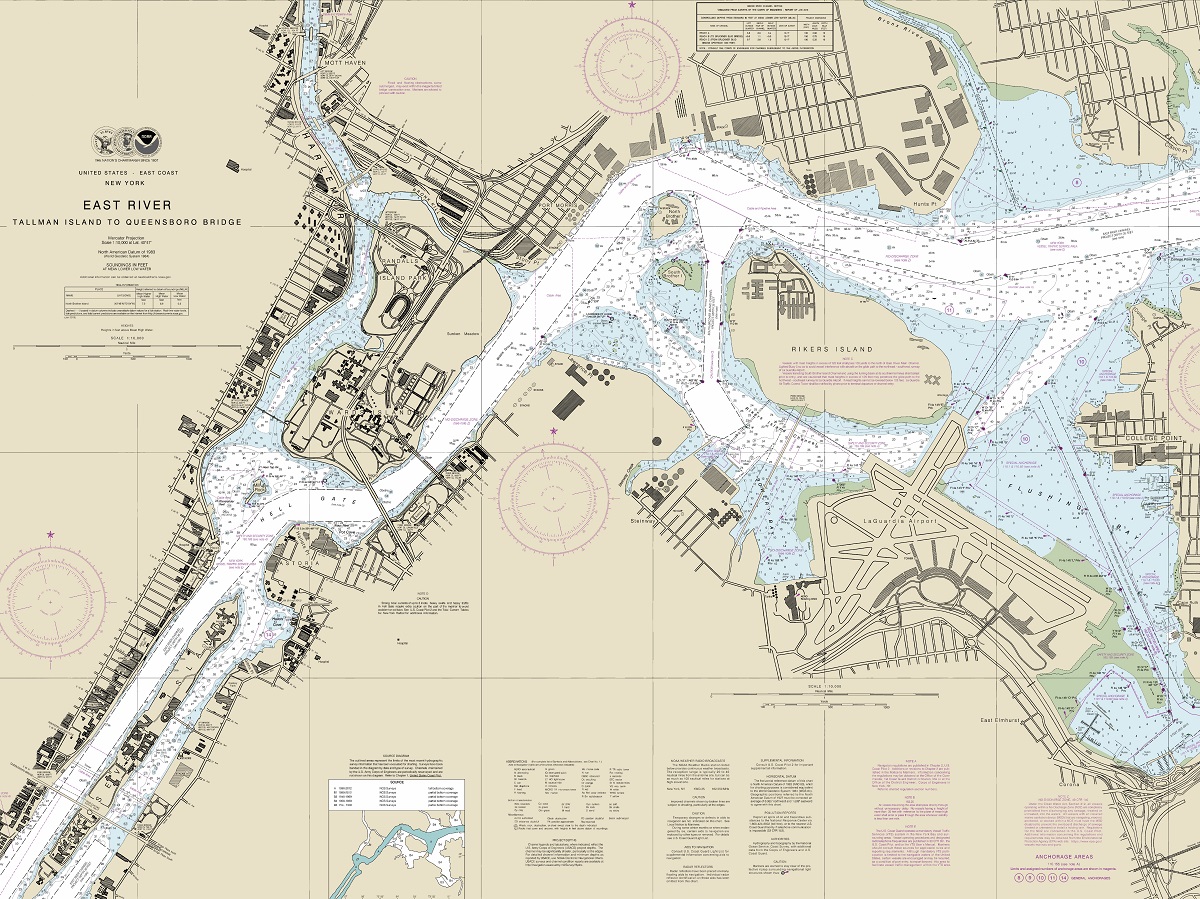
Harbor Charts:  Harbor charts are smaller-scale maps that provide detailed information on a specific harbor or port.  These maps typically show the location of docks, piers, and other structures, as well as the water depths and navigation hazards in the area.

Nautical Maps-Harbor Chart-New York Harbor 

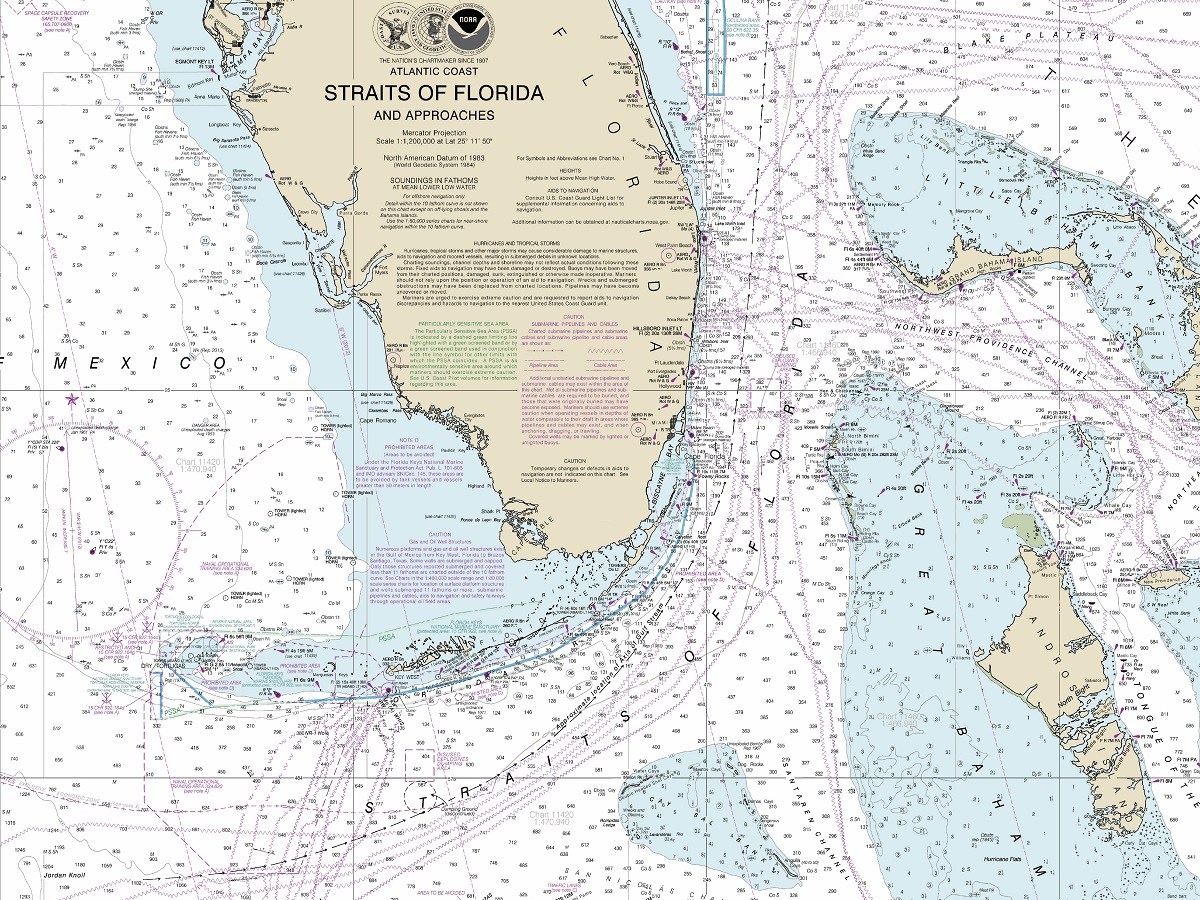
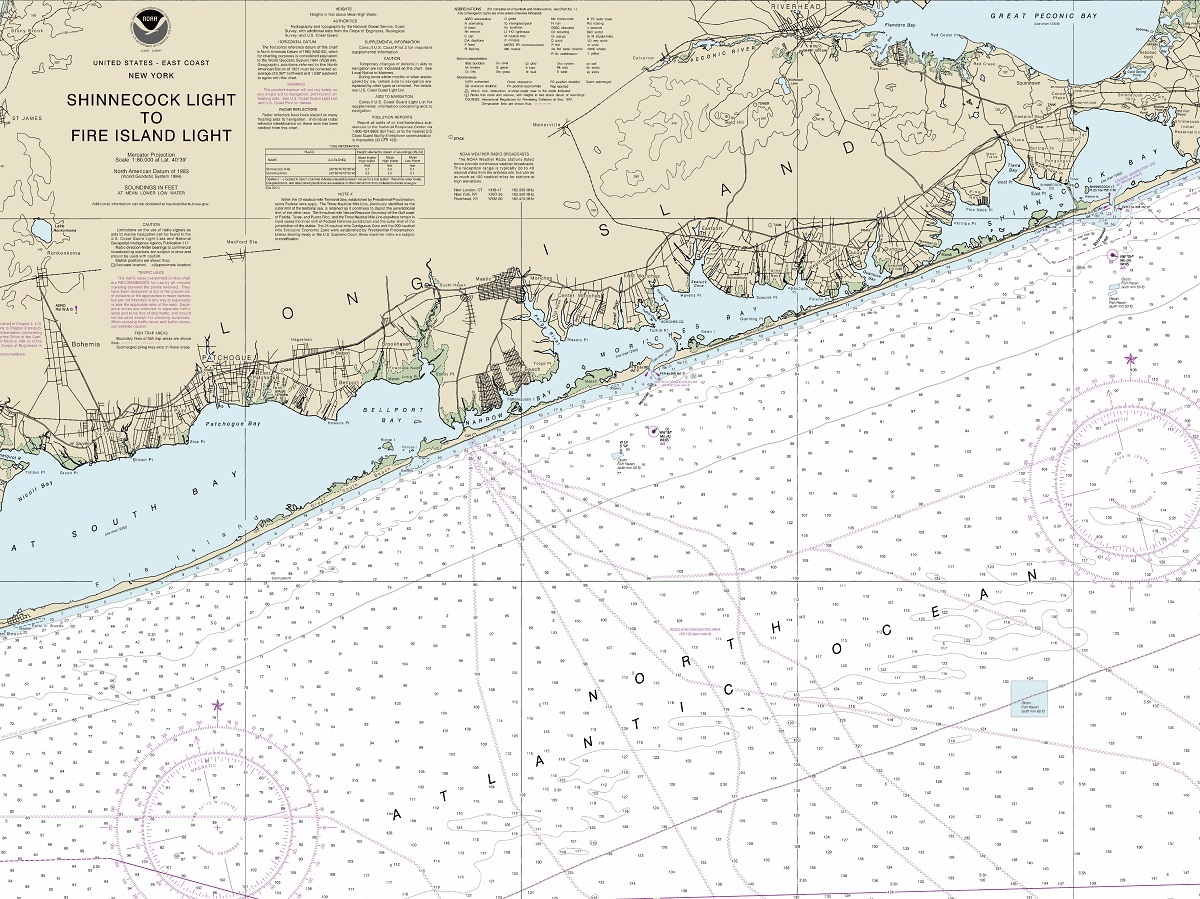
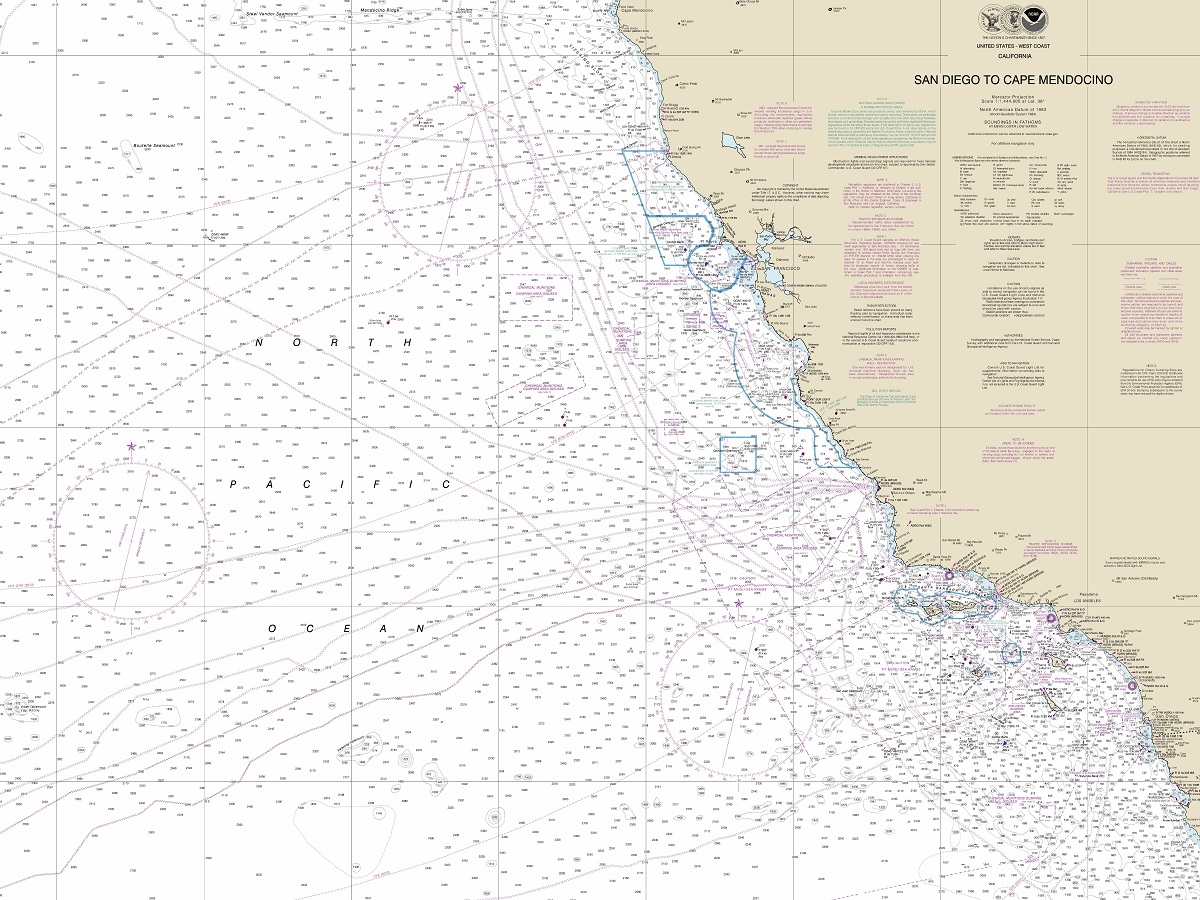
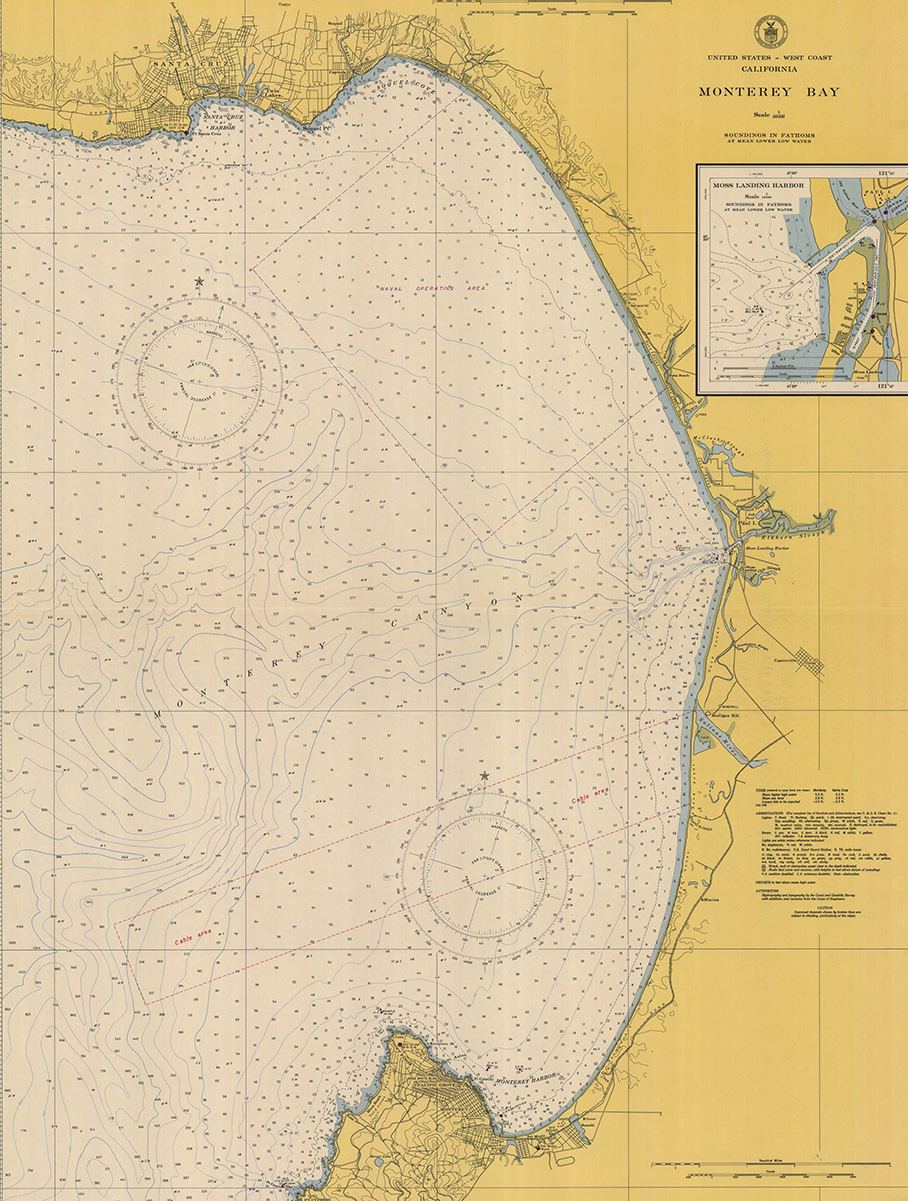
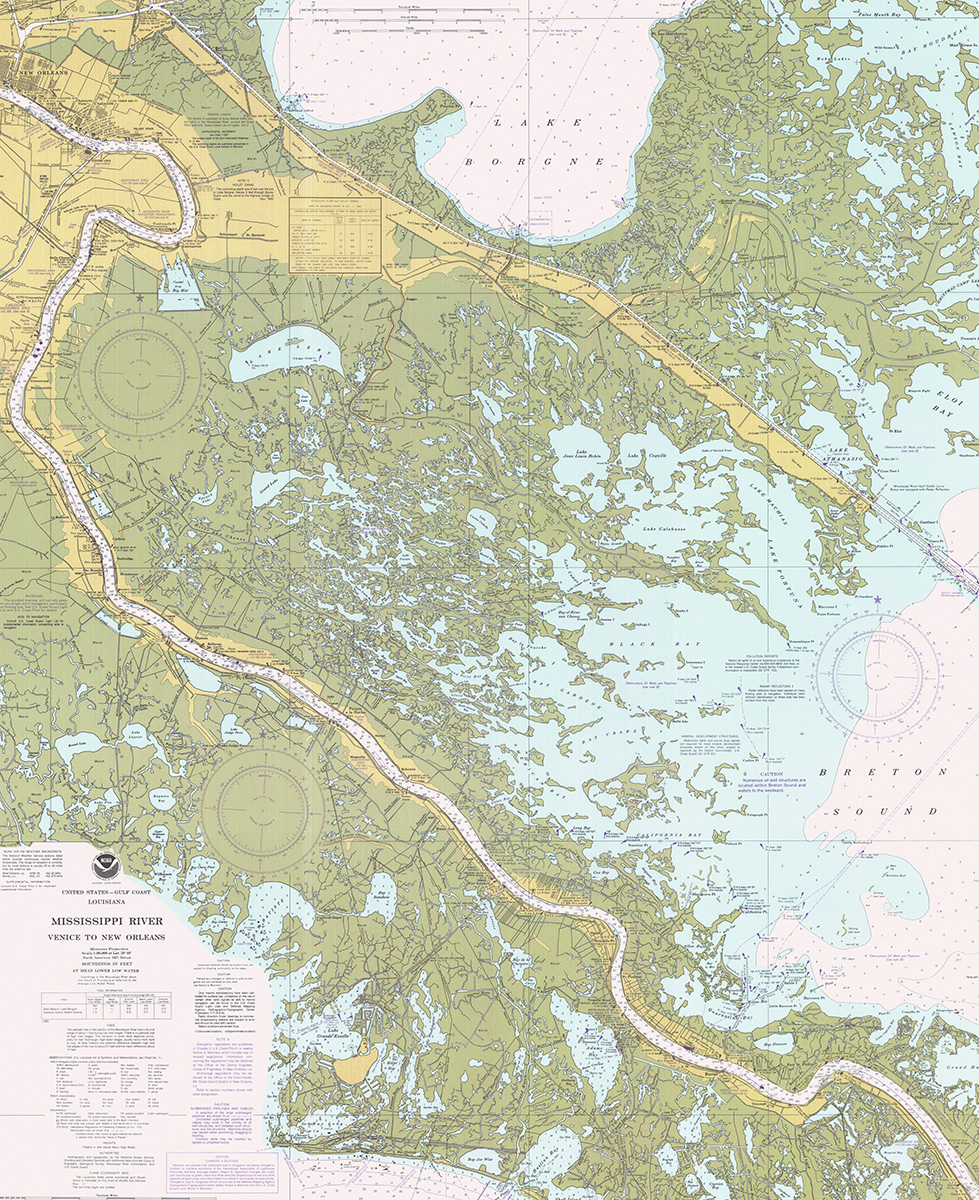
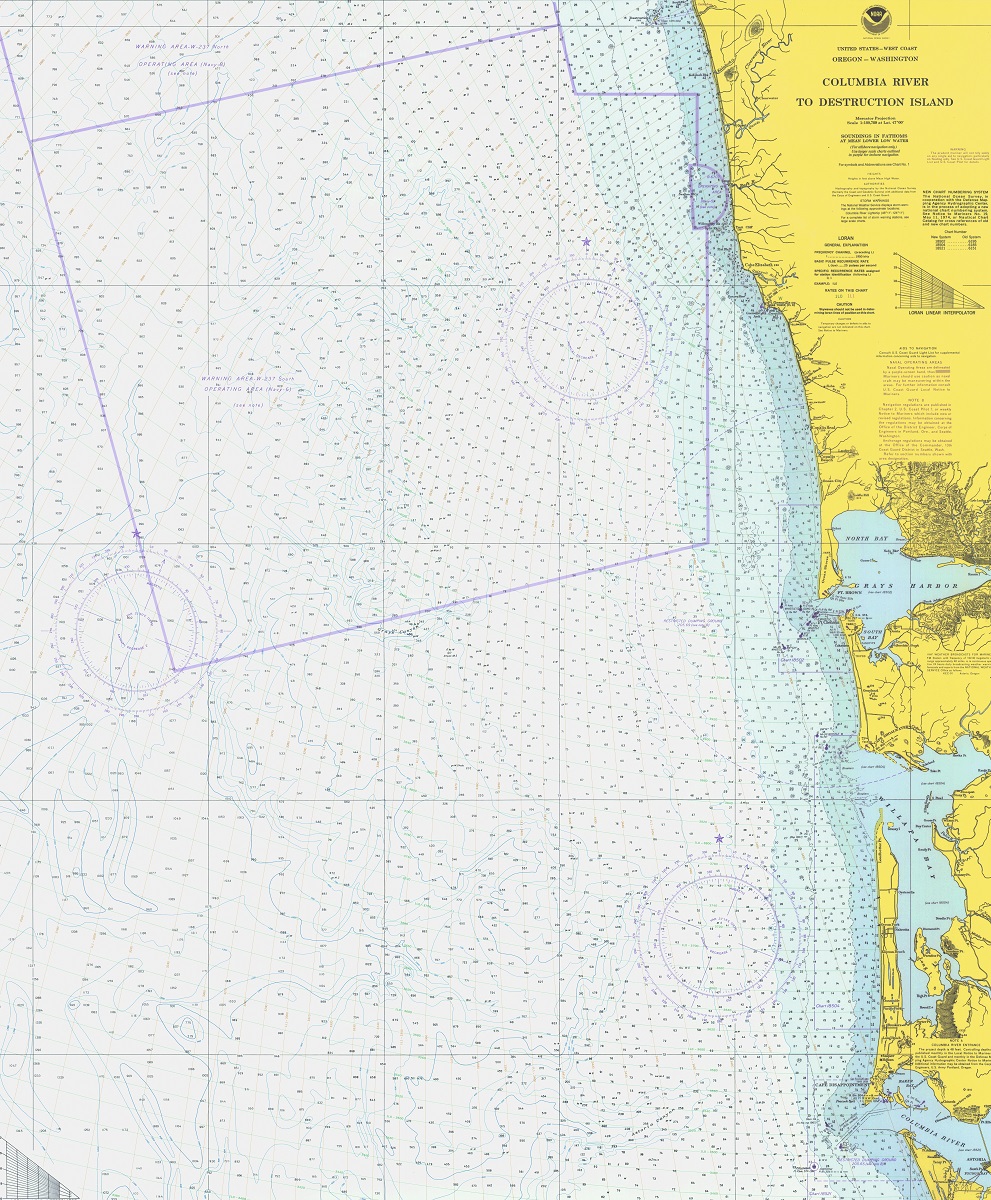
Coastal Charts:  Coastal charts are medium-scale maps that provide detailed information on a specific stretch of coastline.  These maps typically show the location of rocks, shoals, and other navigation hazards, as well as the water depths and the location of ports, harbors, and other coastal features.

Nautical Maps-Coastal Chart-Long Island 

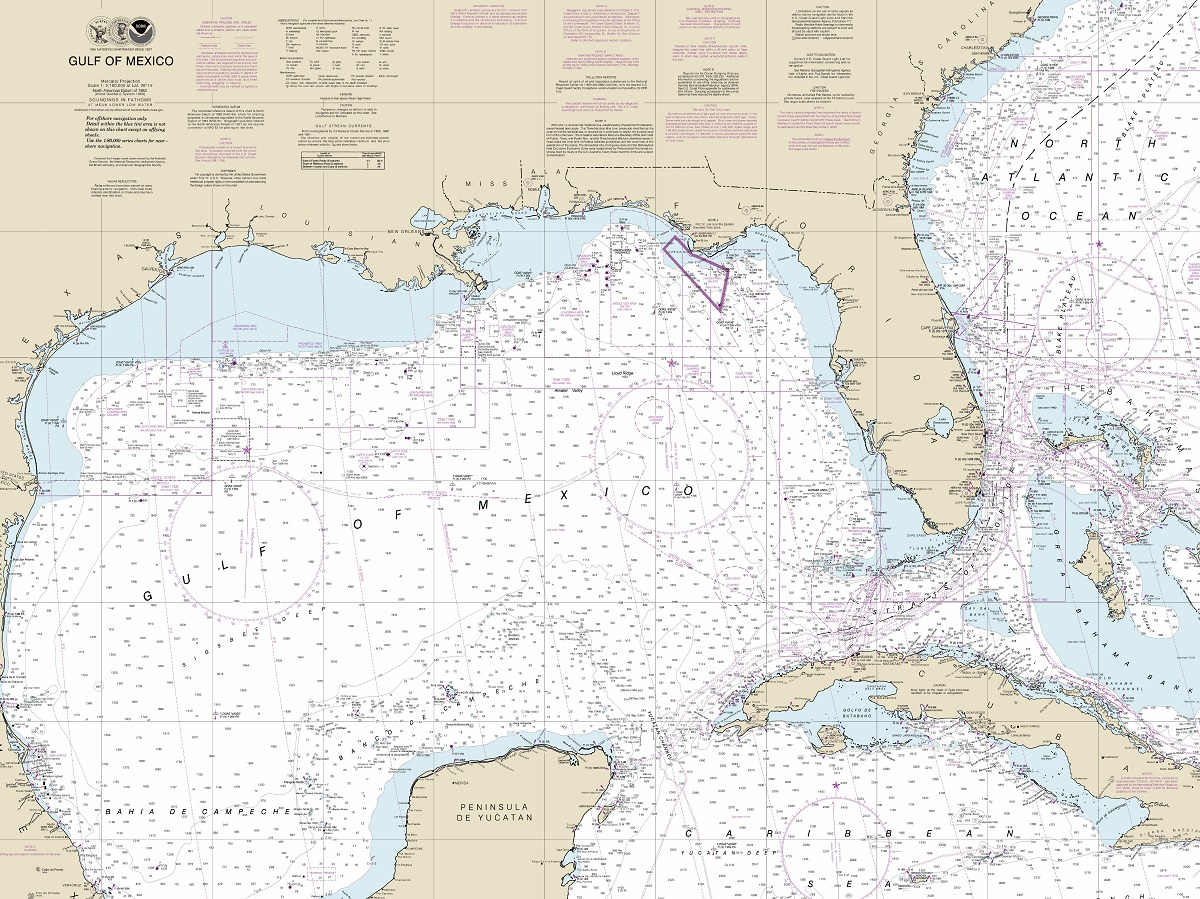
General Charts:  General charts are large-scale maps that provide a broad overview of a given area’s coastline and surrounding waters.  These maps are typically used for navigation and provide information on water depths, navigation hazards, and the location of ports, harbors, and other coastal features.

Nautical Maps-General Chart-Mississippi River to Galveston 

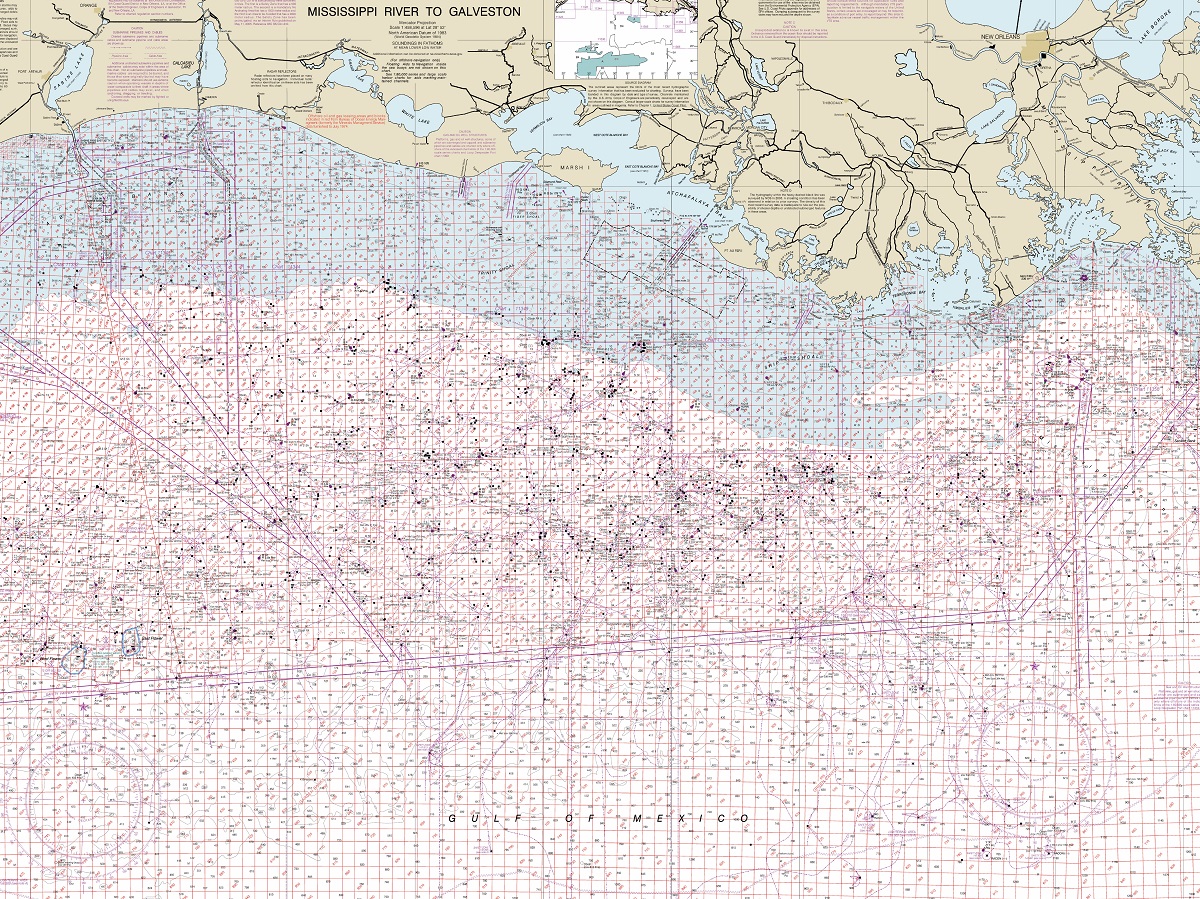
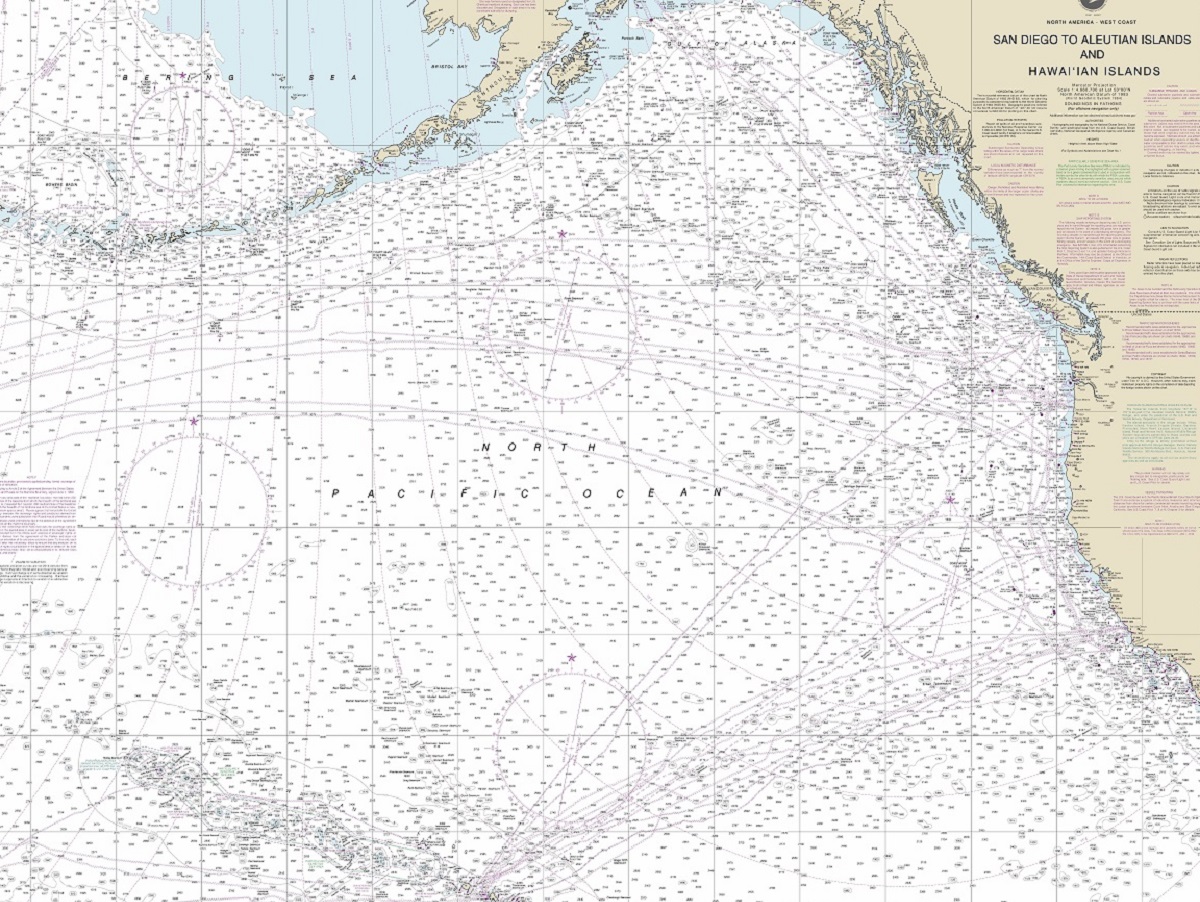
Sailing Charts:  Sailing charts are large-scale maps that provide detailed information on a specific area of open ocean.  These maps are typically used by commercial shipping vessels and provide information on water depths, navigation hazards, and the location of oil rigs, fishing grounds, and other offshore features.

Nautical Maps-Sailing Chart-San Diego to Hawaii

Electronic Charts:  Electronic charts, also known as digital charts, are digital versions of nautical maps that can be viewed on a computer or mobile device.  These charts provide real-time information on water depths, currents, and other critical data, making them an essential tool for modern navigation.

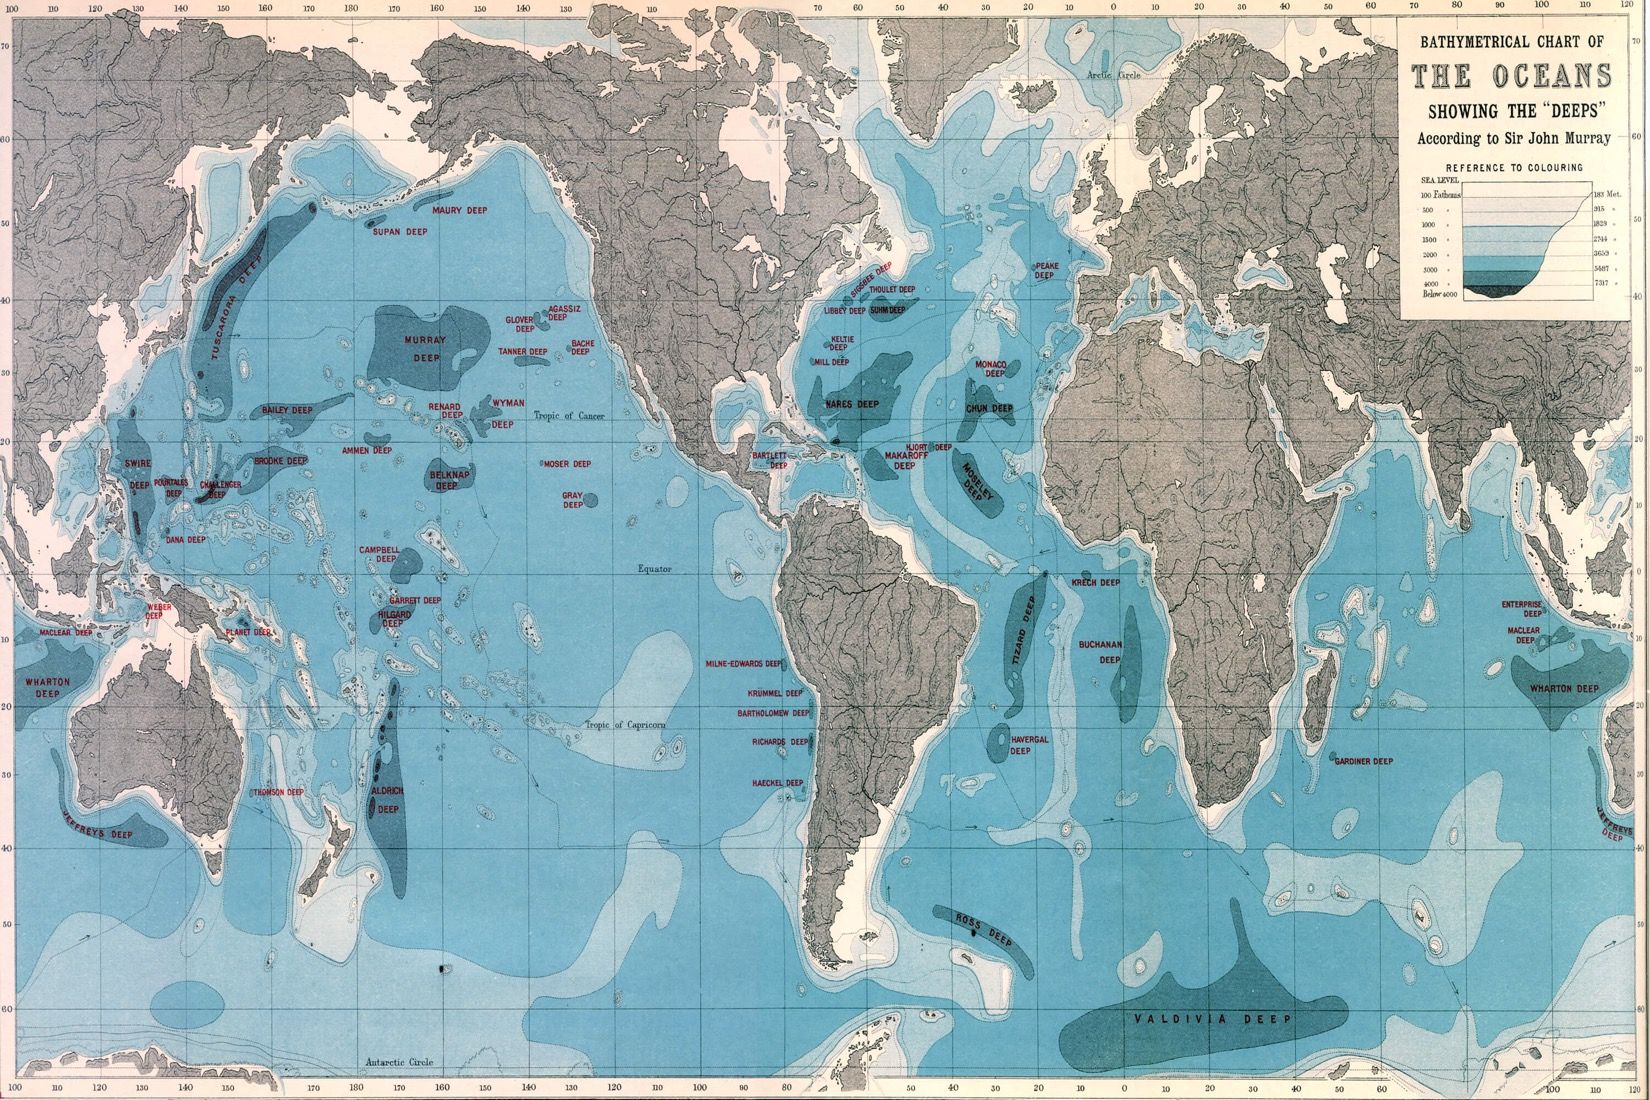
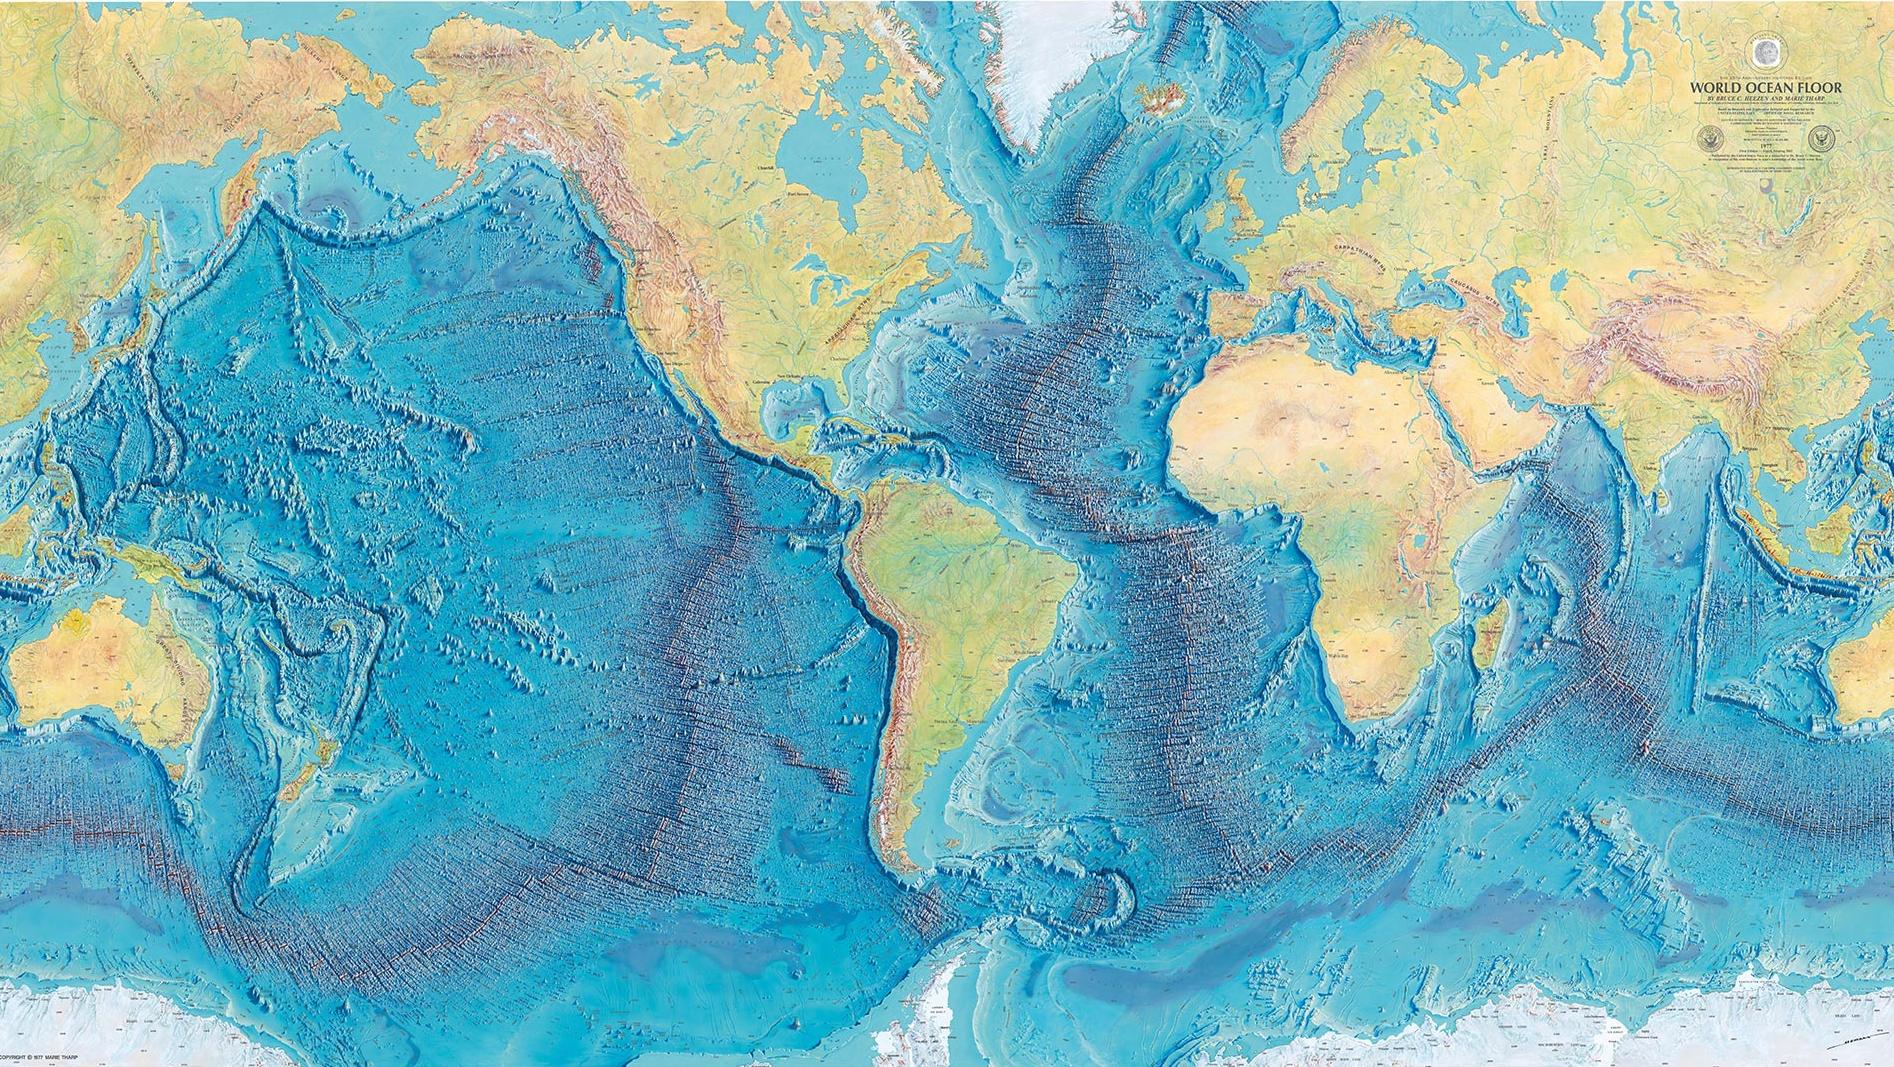
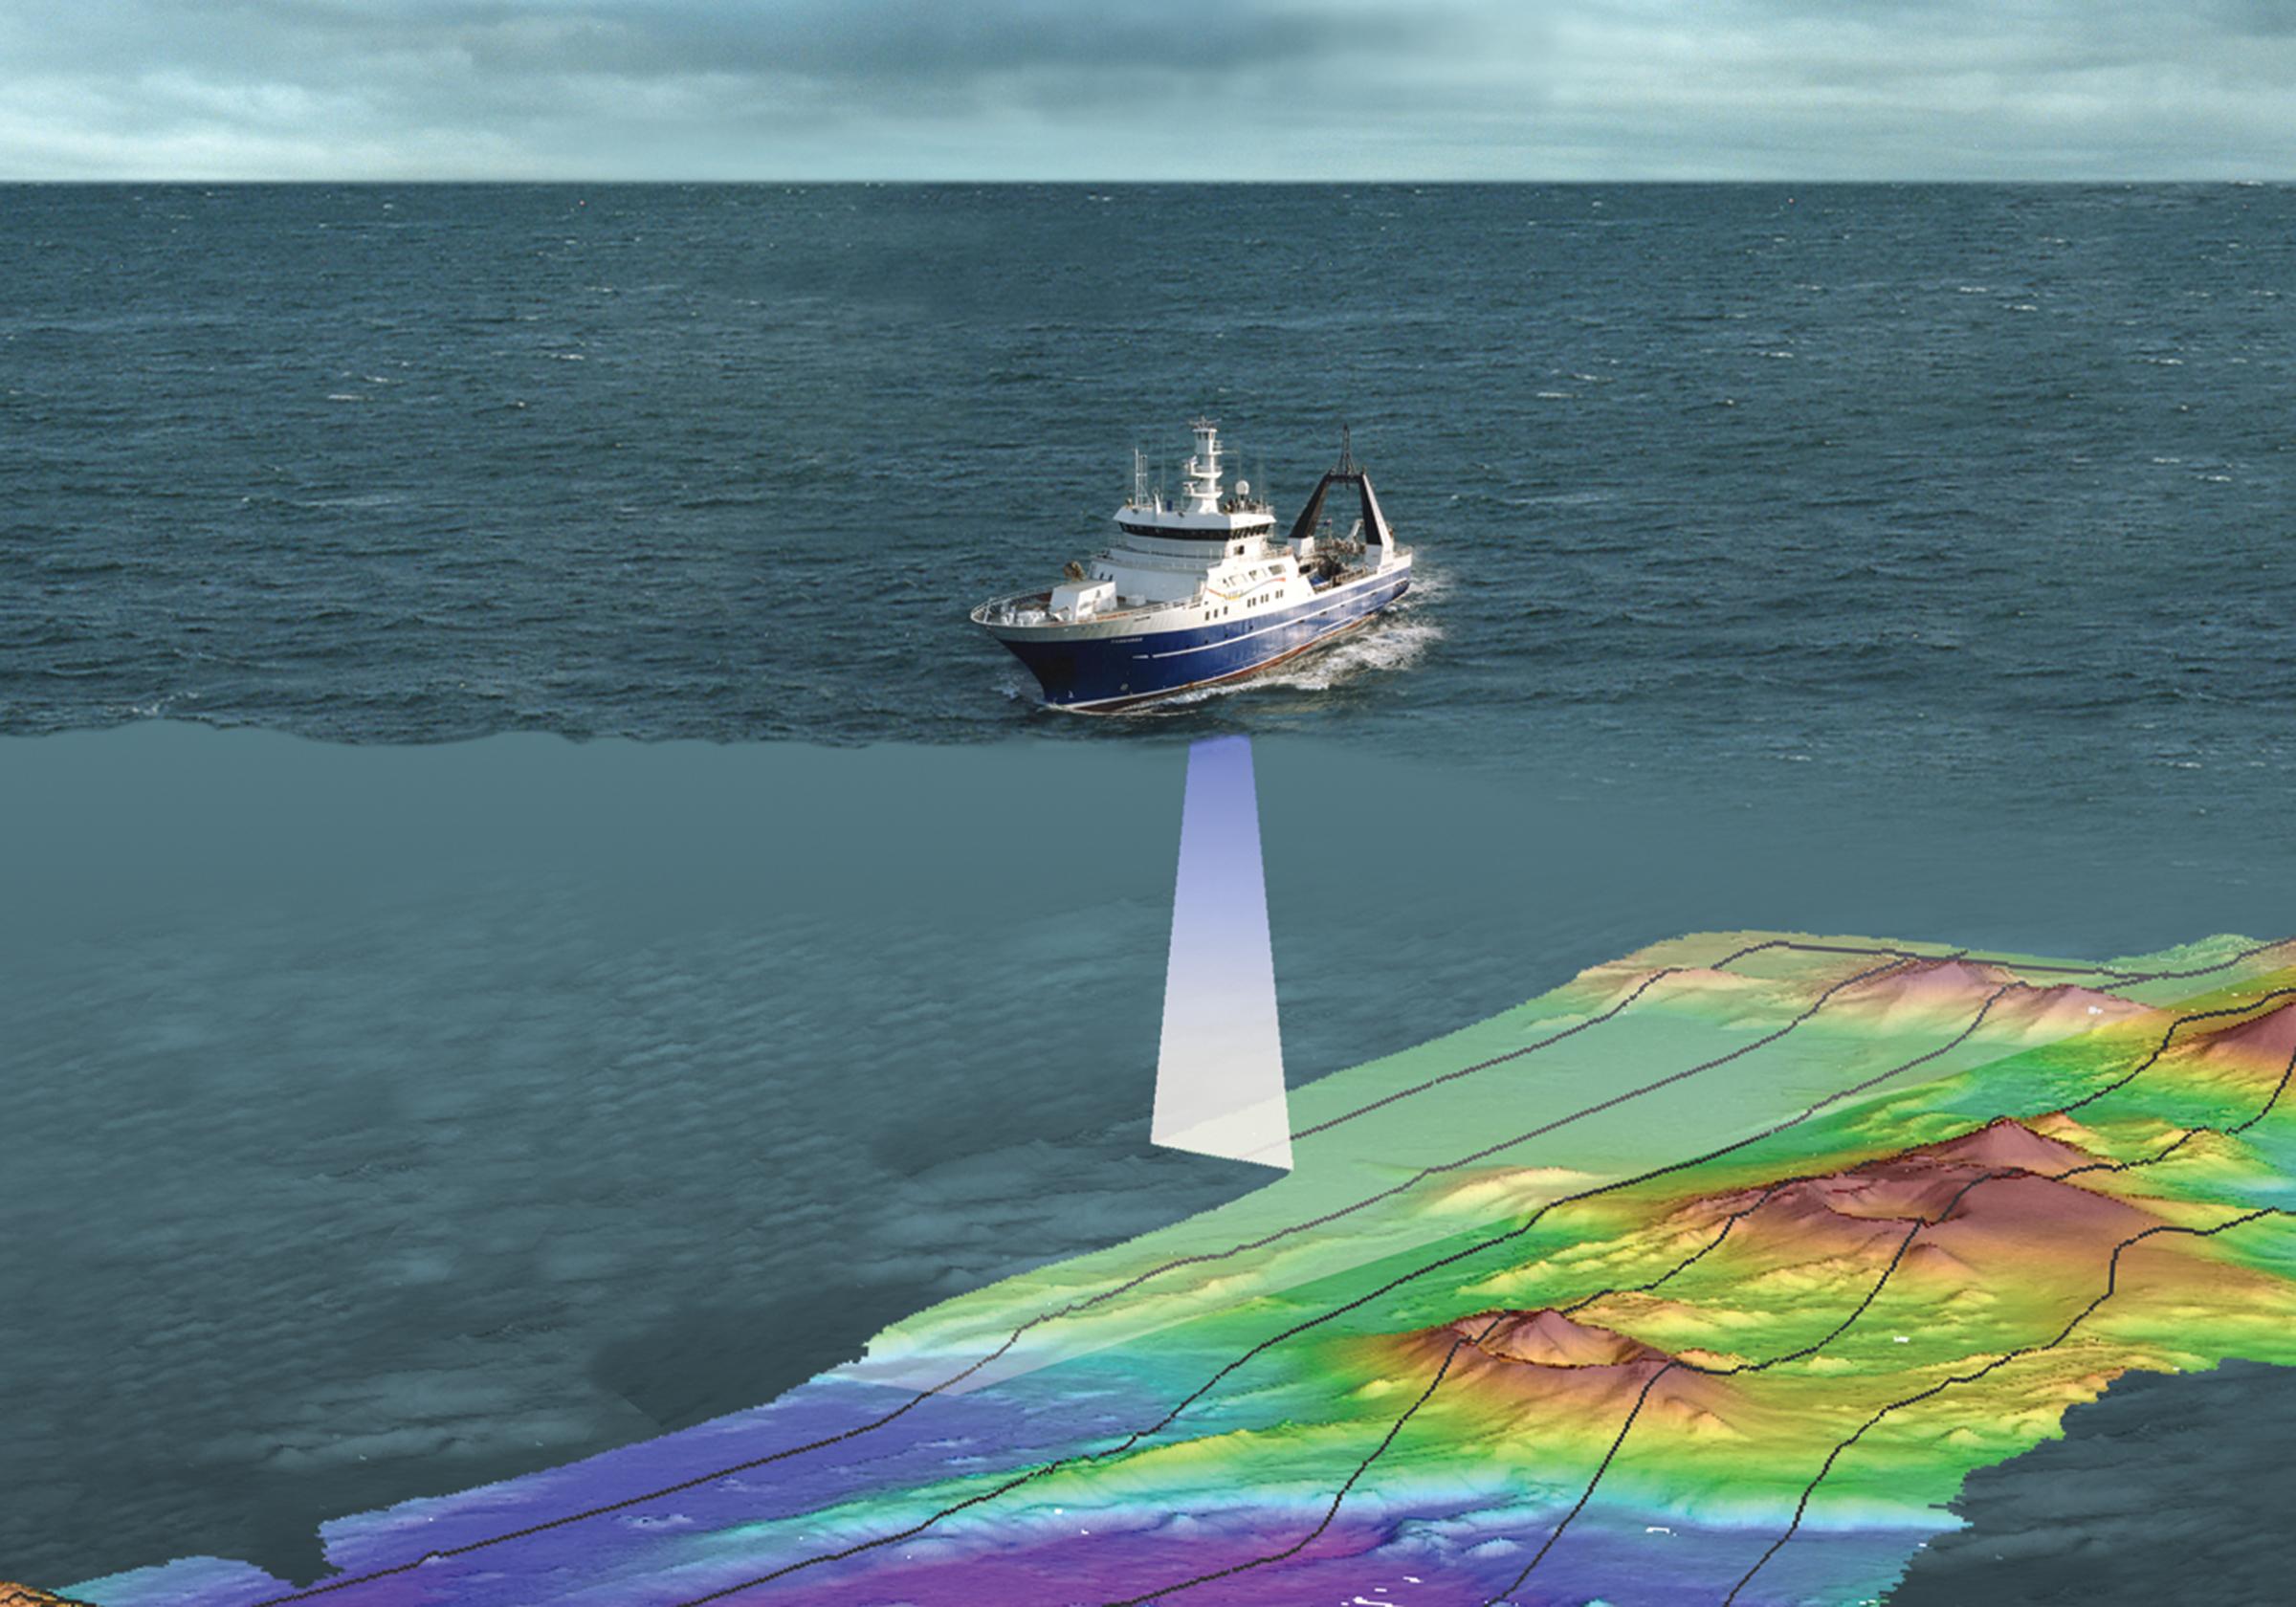
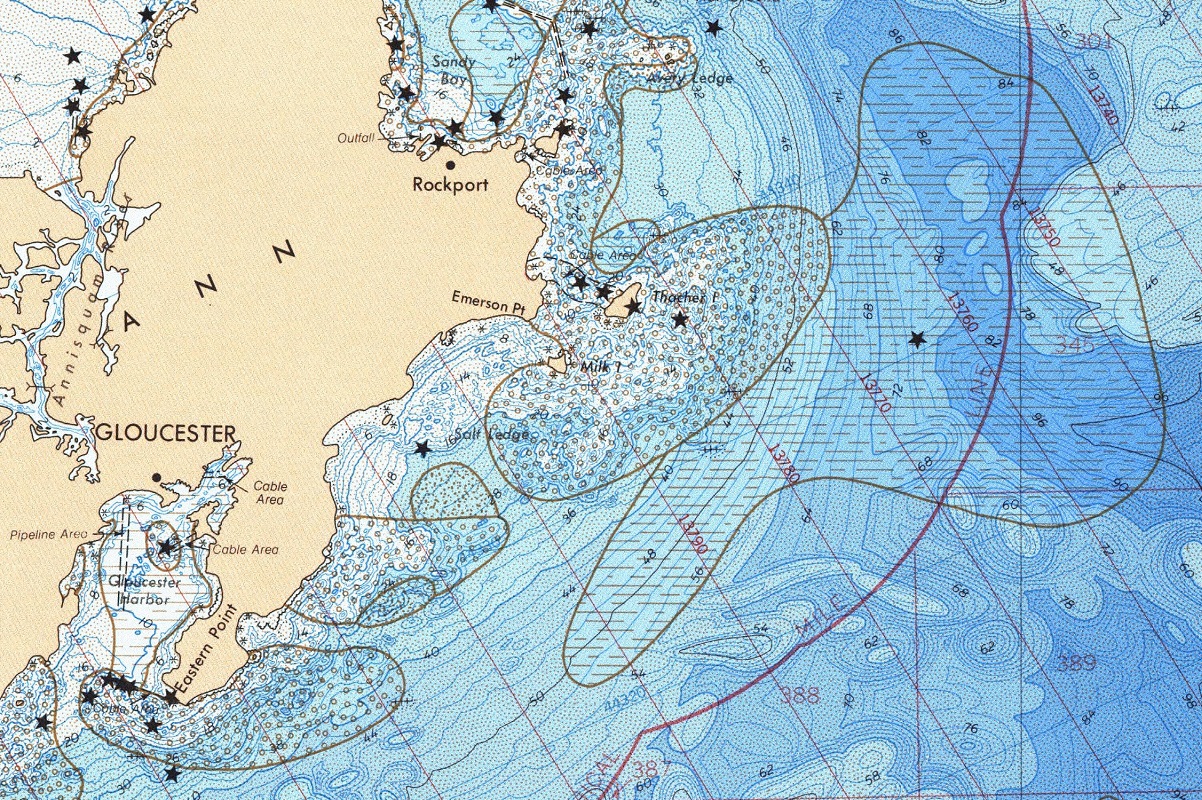
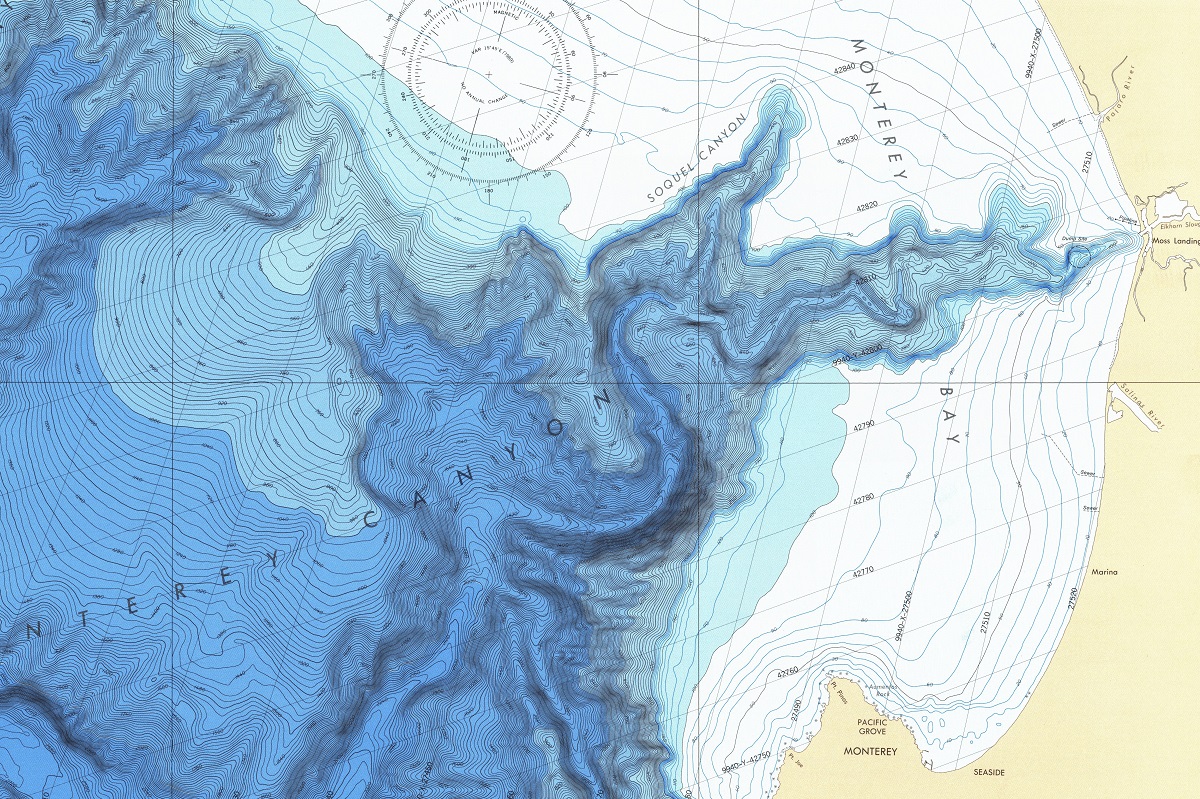
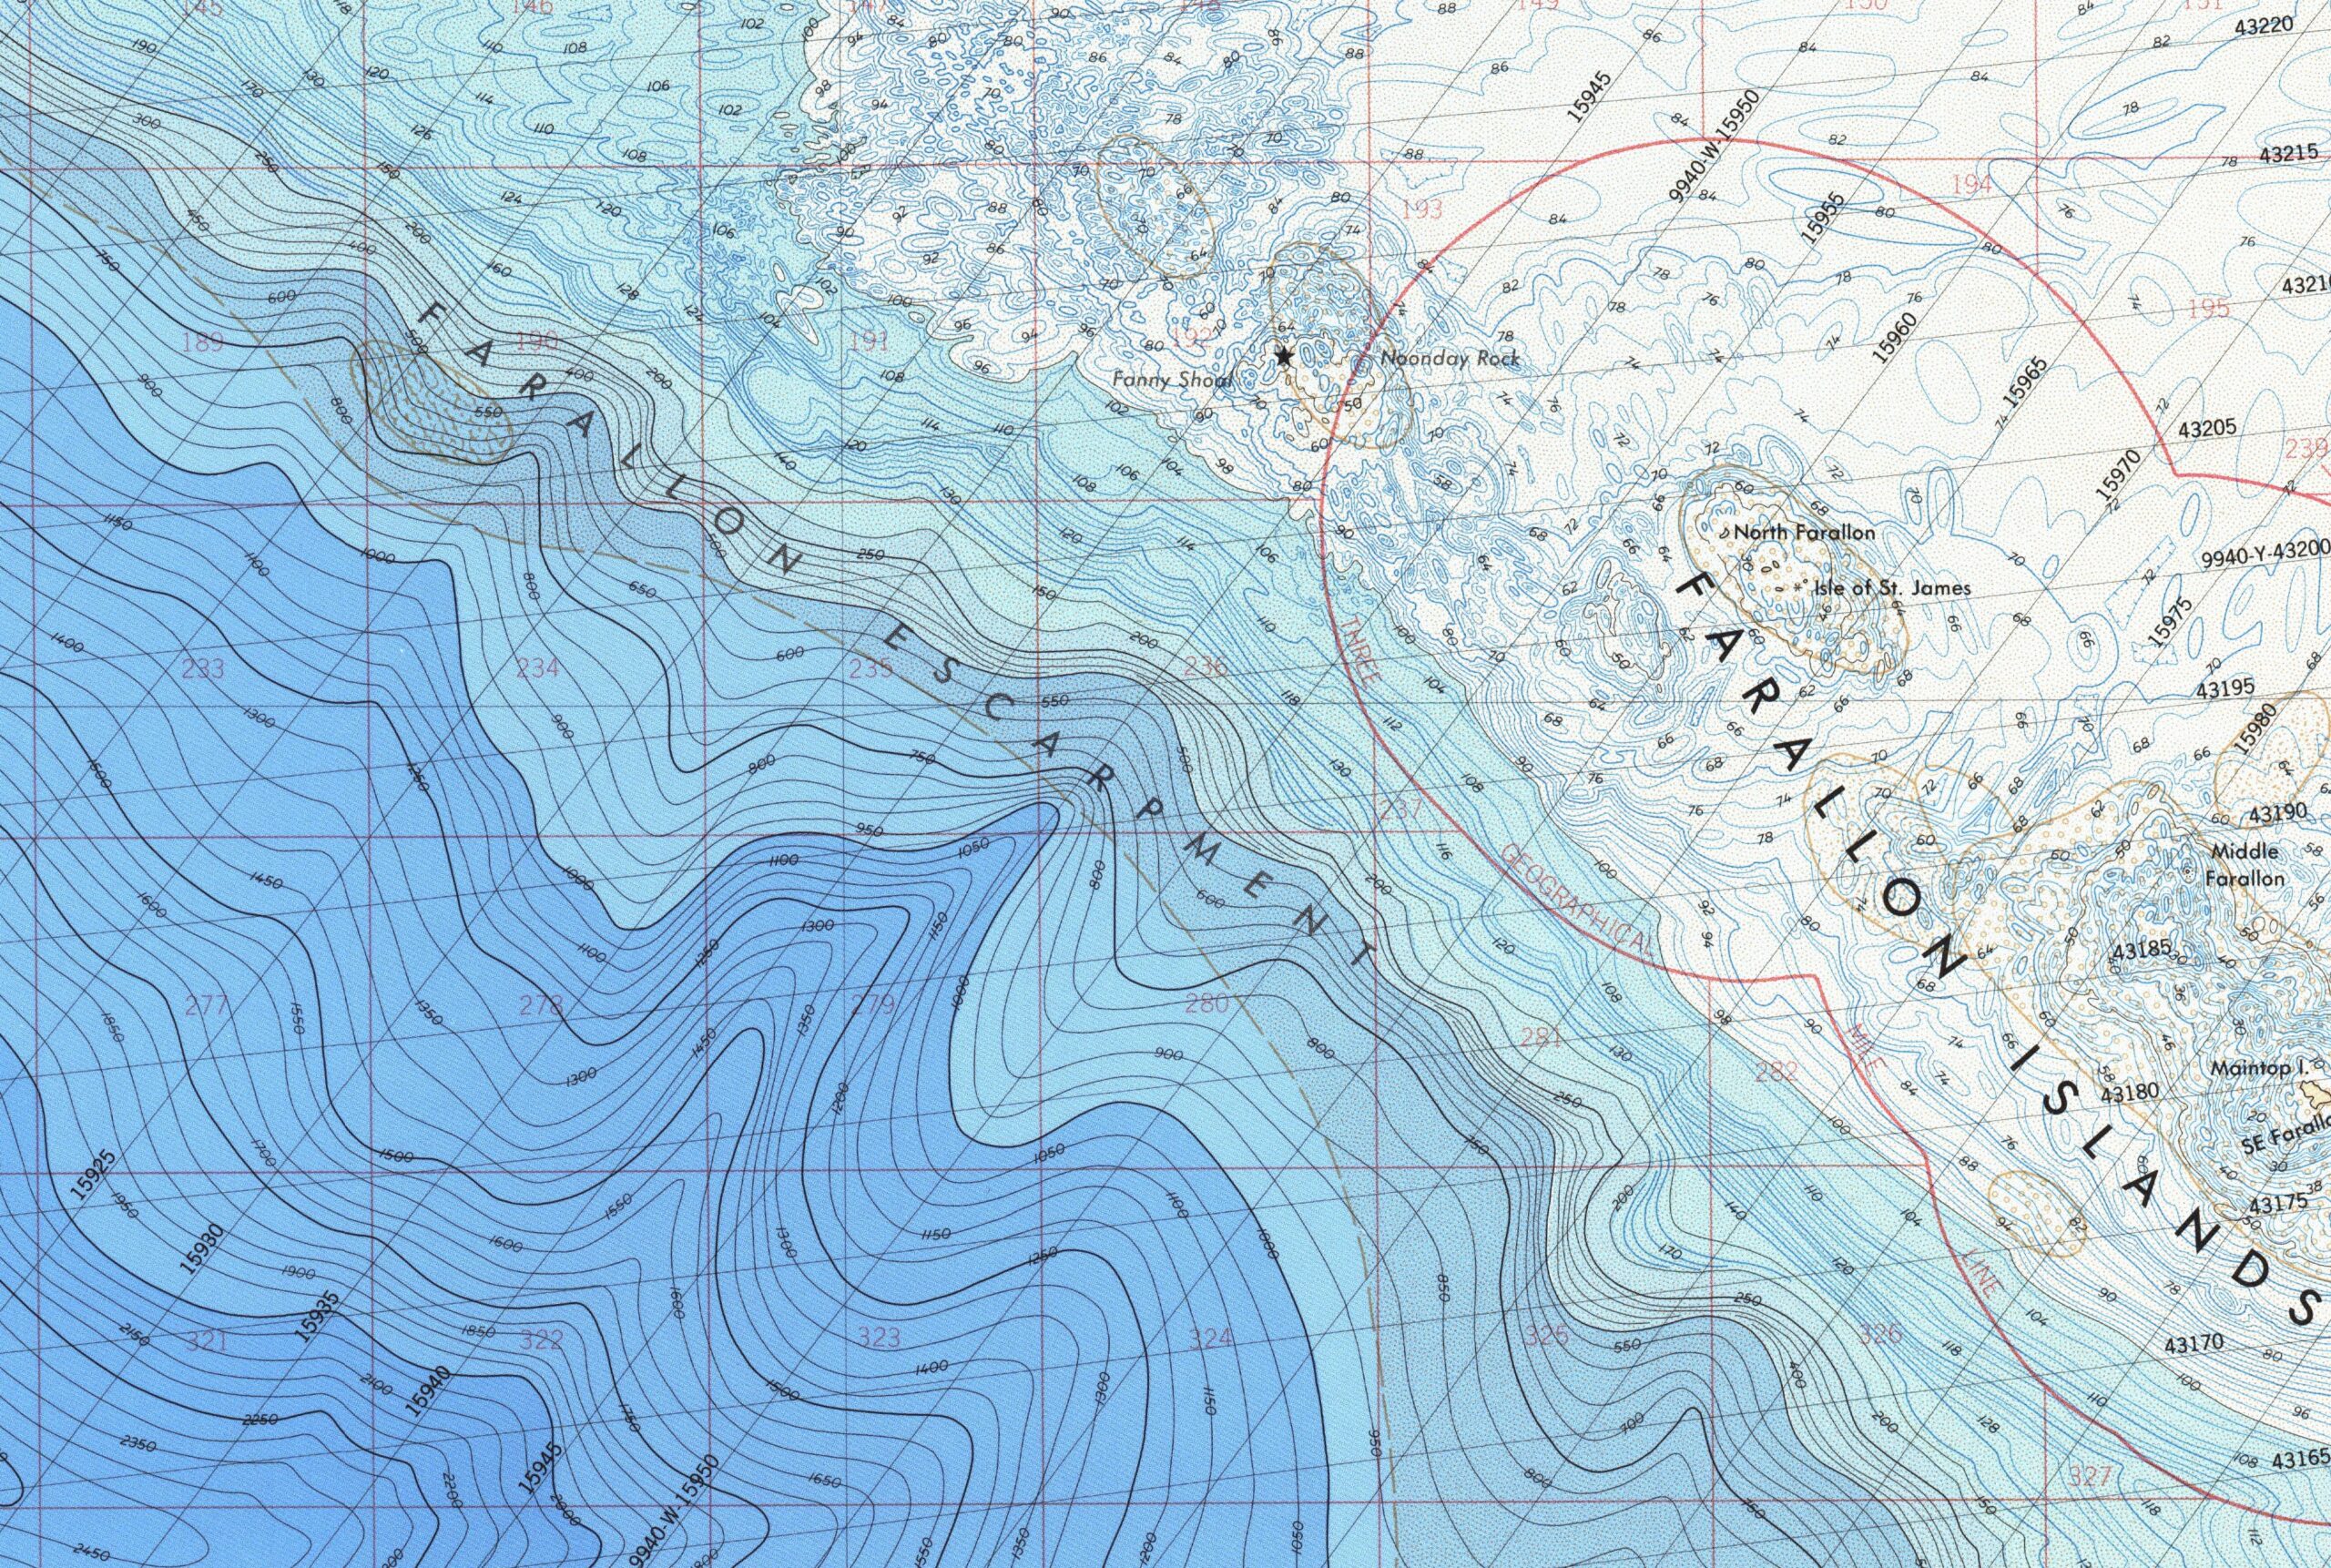
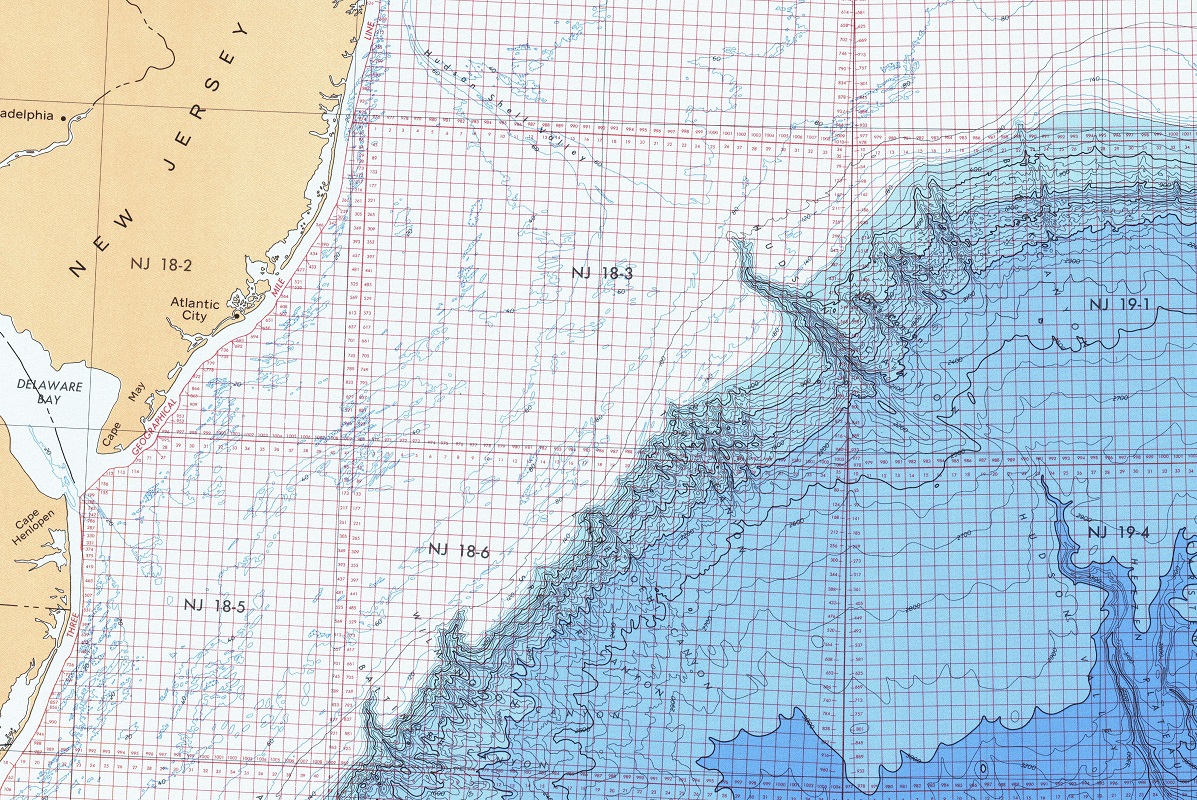
Bathymetric Charts:  Bathymetric charts are specialized nautical maps that provide detailed information on the seafloor topography.  These charts use soundings and other techniques to measure the water depths and create a detailed map of the seafloor.  Bathymetric maps are used for scientific research, oil and gas exploration, and other specialized applications.

Bathymetric Maps-Gloucester

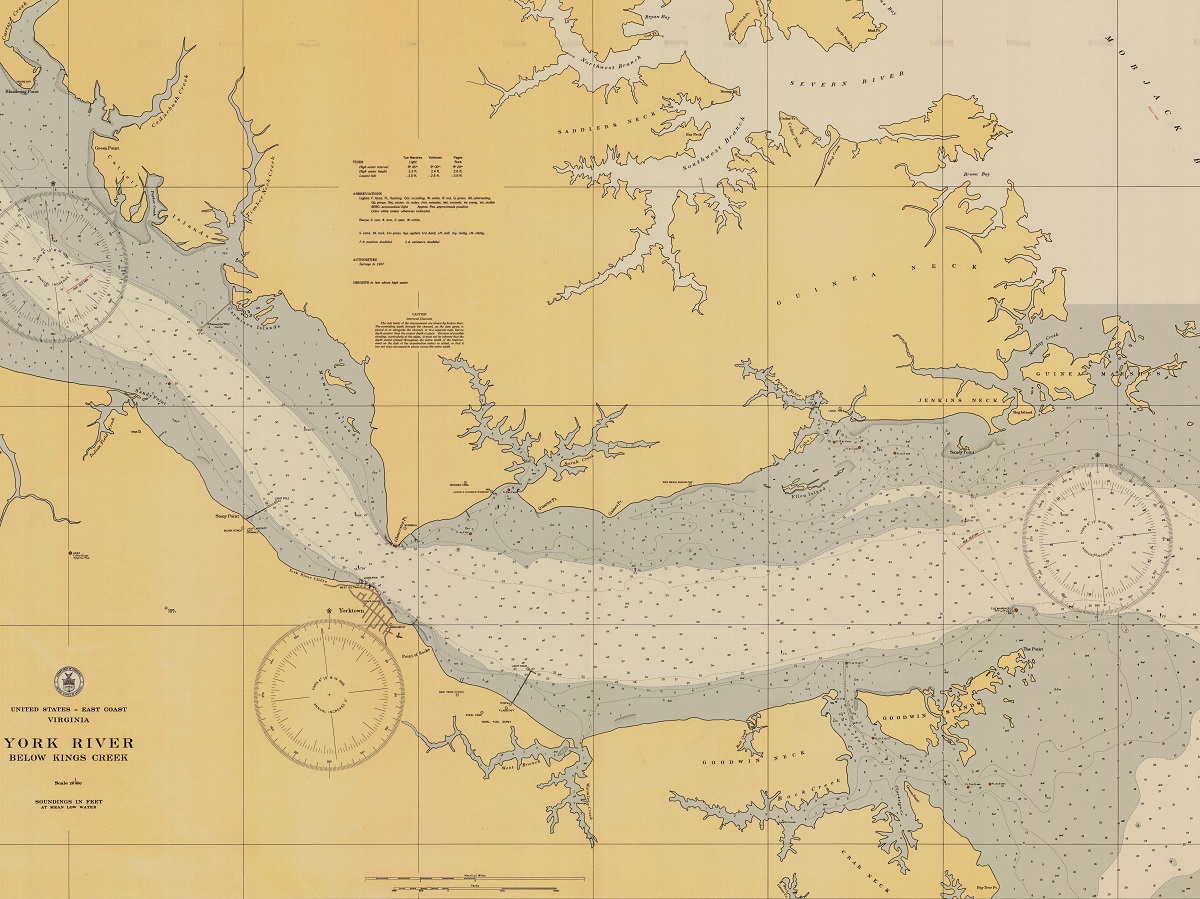
Historical Nautical Charts:  Historical nautical charts have been essential tools for sailors, navigators, and explorers to navigate the open seas for centuries.  Expert cartographers created these charts with detailed information about coastlines, water depths, tides, currents, and other vital data.  These maps helped mariners to avoid dangers, choose the best routes, and find their way across vast distances.  Today, historical nautical charts are valuable resources for maritime historians, researchers, and enthusiasts who study the history of seafaring and its impact on the world.  These charts provide a fascinating insight into the development of cartography and navigation, as well as the challenges and opportunities that sailors faced in the past.

Nautical Maps-Historical-York River 1938 

Nautical maps provide critical information on the marine environment, including water depths, navigation hazards, and the location of ports, harbors, and other coastal features:

  • Scales:  Nautical maps come in various scales, which indicate the level of detail and the area covered by the map.  The scale is expressed as a ratio, such as 1:50,000, which means that one unit on the map represents 50,000 units in real life.  The larger the scale, the more detailed the map, but the smaller the area it covers.
  • Depth Contours:  Nautical maps include depth contours, which are lines that connect points of equal water depth.  These contours are typically labeled with the depth in meters or feet, providing critical information on the water depths in the area.  Depth contours are especially important for avoiding navigation hazards such as rocks, shoals, and sandbars.
  • Navigation Aids:  Nautical maps include symbols and labels for navigation aids such as buoys, beacons, and lighthouses.  These aids provide critical information on the location of navigation hazards and can help mariners navigate safely through unfamiliar waters.
  • Shoreline Features:  Nautical maps include symbols and labels for shoreline features such as beaches, cliffs, and coves.  These features provide critical information on the location of safe anchorages, landing sites, and other important coastal features.
  • Water Temperature and Currents:  Some nautical maps include information on water temperature and currents.  These features are essential for commercial fishing and ocean research and can help mariners navigate more efficiently and safely.
  • Tidal Information: Nautical maps include information on tides, such as the height of high and low tides and the time of the next tide change.  This information is critical for planning navigation, especially in areas with strong tidal currents.
  • Magnetic Information:  Nautical maps include magnetic information, such as the variation between true north and magnetic north. This information is critical for accurate navigation using magnetic compasses.

Gallery of Nautical Maps

Here are three online viewers available for selection of maps: (or WhiteClouds can help you with this process). These nautical map viewers are provided by NOAA (Office of Coast Survey).

Paper ChartsHistorical MapsBathymetric Maps

Examples nautical maps are shown below.  

2D Nautical Maps - Sample Harbor Charts

2D Nautical Maps - Sample Coastal Charts

2D Nautical Maps - Sample General Charts

2D Nautical Maps - Sample Sailing Charts

2D Nautical Maps - Sample Bathymetric Charts

2D Nautical Maps - Sample Historical Nautical Charts

There are many benefits with Nautical Maps:

  • Safe Navigation:  One of the most important benefits of nautical maps is that they help ensure safe navigation.  Navigating through unfamiliar waters can be challenging and even dangerous without accurate and up-to-date information on water depths, navigation hazards, and other critical features.  Nautical maps provide mariners with the information they need to navigate safely and avoid hazards such as rocks, shoals, and sandbars.
  • Efficient Navigation:  Nautical maps can also help mariners navigate more efficiently.  By providing information on water depths, navigation hazards, and other features, mariners can choose the most efficient route through the water.  This can save time and fuel, and also help reduce the risk of accidents.
  • Marine Research:  Nautical maps are also essential for marine research.  Scientists and researchers use these maps to study the marine environment, including water depths, currents, and temperature.  This information is critical for understanding the behavior of marine life, tracking the movement of pollutants and waste, and assessing the impact of climate change on the oceans.
  • Marine Resource Management:  Nautical maps are also used in marine resource management.  Fisheries managers, for example, use these maps to identify important fishing grounds, track the movement of fish populations, and monitor the impact of fishing on the marine environment.  This information is essential for ensuring sustainable fishing practices and protecting marine ecosystems.
  • Tourism and Recreation:  Nautical maps are also used in tourism and recreation.  Boaters, anglers, and other water enthusiasts use these maps to plan their trips and navigate safely through unfamiliar waters. Tourists also use nautical maps to explore coastal areas and learn about the history and culture of the region.
  • Historical Preservation:  Nautical maps also have historical value.  These maps provide a glimpse into the history of marine exploration and navigation, and can help preserve and protect important maritime heritage sites and traditions.

Nautical maps are an essential tool for safe and efficient marine navigation, marine research, marine resource management, tourism and recreation, and historical preservation.  They provide critical information on water depths, navigation hazards, and other important features, and have been used for centuries to explore and understand the marine environment.  As technology continues to evolve and our understanding of the oceans deepens, nautical maps will continue to play a vital role in ensuring safe and sustainable marine navigation and exploration.

We meld top-of-the-line technologies with professional cartography resources to create stunning bathymetric maps and models.  Our expertise in 3D printing enables us to allow more markets to benefit from purchasing durable, portable, and affordable models. 


Gallery of Custom 3D Map Projects

How 3D Nautical Maps are Made

There are several techniques used to create 3D nautical maps, and the process can vary depending on the scale and complexity of the map.  However, the basic steps involved in making a nautical map are as follows:

  1. Create a base map. The first step in making a nautical map is to create a base map of the area. This can be done using imagery from a standard two-dimensional map, aerial photographs, satellite images, or WhiteClouds can do it for you.
  2. Determine the design style of the map. There are over 40 styles to choose from.  Popular ones include satellite, terrain, topography, raised relief, and satellite hybrid.
  3. Add any special design features not included in the source map, such as special features, landmarks, legends, roads, cities, symbols, etc.
  4. Add elevation data. The next step is to add elevation data to the map. This can be done using a variety of techniques, such as contour lines, shading, or digital elevation models (DEMs).
  5. Print the Map Overlay.  Latex vinyl materials are used for the map details and colors.  
  6. Create the 3D physical map. Once the elevation data has been added to the map, a physical 3D structure is created that replicates the topography of the area. This can be done using 3D printed plastic or thermoformed molding/casting.  Either approach is combined with the Vinyl overlay.
  7. Finish the map.  This is where any excess materials are cutaway.  Any special sealers, matte finishes, hardeners, or UV protection is applied.  Wood, metal or plastic bases are built and border flocking may be applied.


Features & Benefits of Nautical Maps

  • Remarkably Strong:  You can drive a 1-ton truck over our nautical maps.
  • Precision:  We print our physical maps to scale as accurately as are the original files and images.
  • Excitement:  It is much easier to get excited about 3D views of your topography than flat printed maps.
  • Stain and Water Resistance:  Spills are easy to wipe up.
  • Communication:  Nautical maps are simple to understand with a quick glance.
  • Affordability:  Our 3D technologies allow you to order custom 3D maps for a reasonable price.
  • Testability:  3D technologies are affordable enough to test designs, such as several versions of planned work.
  • Consistency:  Using modern print and casting technologies, you can easily recreate identical 3D maps.
  • Portability:  We use lighter materials than what was available in the past, making our nautical maps easy to transport.

Videos of 3D Maps

Map Design Styles of Nautical Maps

Many design styles, or base maps, serve as a starting point for your nautical map. We source and create our base maps using the same digital tools that expert cartographers use to create maps. Once you have selected your base map, everything else is fully customizable. We can layer informational text (such as landmarks or other points of interest) and even change the colors to suit your preferences.

Complex layers can be added such as streams and lakes, terrain, roads, and even more detail like political boundaries, religious, and other population-based demographics.  Multiple layers can also be added to the same nautical map.  Take a look at the map style categories below for inspiration.

Technology and Materials Used in Nautical Maps

  • With 3D printing technology, you are not limited to straight lines and boxes. The curves and cliffs are captured accurately and beautifully in astonishing detail.
  • Your vision of the final 3D map determines which materials we will choose to produce the best results. We help you to determine the materials that best suit your project.
  • We use fabrication technologies such as 3D printing, CNC cutting, and molding/casting.
  • Nautical maps show incredible detail.
  • Our maps are printed in full color (with over 17 million variations of color) for awe-inspiring presentations and displays. No painting required!
  • Typically, we use a special process for finishing the sides of the raised relief maps in a suede-like material, similar to the finish of a jewelry box.
  • Our in-house paint booth gives us flexibility in different types and grades of paint and finishing capabilities; we can provide UV-resistant coatings to protect the coloration of your 3M map for many years.
  • We also offer customized additions to our 3D maps and models. Our in-house carpentry shop will build elegant bases, tables, or cabinetry to display any map you choose. Worried about dust? We can customize a case to protect your display as well. Our skilled artisans can hand-paint details to make your map a true work of art. 

WhiteClouds Marscapes: A Captivating Collection of 3D Raised Landscape Art for Home or Office Decor

Pricing of Custom Nautical Maps

The price of 3D maps and models are generally based on your size requirements, specific design needs, and the amount of work it will take to produce. Each map is custom-built and charged for accordingly. The best way to determine cost is to email us, call us at 385-206-8700, or fill out the form below and let us bid on your project.

Get a Free Price Estimate for a Custom Nautical Map

Custom Fabrication Workflow

Common Questions & Answers

  • What is the largest map you can fabricate?  There is no limit to the size of a map we can build.  There are practical limits that will impact shipping and installation, but we work closely with our customers on these special requirements.
  • What type of 3D maps can you fabricate?  All types.  Satellite Maps, Terrain MapsTopographical MapsRaised Relief MapsUSGS MapsContour Maps, and many more.
  • Can you fabricate with different technologies and materials? Yes.  Our most common fabrication technology is 3D Printing, but we can also build 3D Maps with CNC Cutting, 3D Foam, Molding/Casting, Thermoforming, and Sculpting.
  • What materials can you 3D print in?  We match the correct material and fabrication process to your requirements in terms of presentation, size, and transportability.  We can 3D print in PLA, FDM, Full-Color Sandstone, UV-cured resin, plastic, rubber-like, acrylic, and nylon – as well as combining multiple technologies.
  • Can you sign a Non-disclosure Agreement that you supply?  Yes.
  • How long will it take to create my map?  That depends on the design and size of the map.  A more complex or detailed map will take longer than a simple map, we can’t really say exactly how long it will take until we have the chance to understand what type of map you want fabricated.  Generally, smaller standard maps can be a couple of weeks and large museum exhibition maps can be 6 months.
  • What do you need from me to start the map fabrication?  Boundaries are a good place to start.  Determining map styles, sizes, height (may be exaggerated), and cabinetry needs are all part of the process.  Special design features can also be added.
  • What is a nautical map?  A nautical map, also known as a nautical chart or sea chart, is a specialized type of map used for navigation on water.  Nautical maps are designed to provide mariners with important information about the features of the sea floor, the location of navigational hazards, and other details that are crucial for safe navigation.

    Nautical maps are typically produced by national hydrographic offices or other organizations responsible for maintaining navigation aids and information for mariners.  They are based on hydrographic surveys, which use sonar technology to measure the depth and shape of the sea floor.

    Nautical maps include a variety of symbols and labels to help mariners navigate safely.  These can include:

    • Soundings:  measurements of the depth of the water at various points
    • Contour lines:  lines connecting points of equal depth, which help to show the shape of the sea floor
    • Navigational hazards:  symbols indicating the location of rocks, shoals, wrecks, and other obstacles to navigation
    • Aids to navigation:  symbols indicating the location of lighthouses, buoys, beacons, and other markers used for navigation
    • Shoreline features:  symbols indicating the location of beaches, cliffs, and other features near the shoreline

    Nautical maps also include information about tides, currents, and other factors that can affect navigation. They are an essential tool for mariners of all kinds, from recreational boaters to commercial shipping vessels, and are used to plan safe routes, avoid hazards, and ensure the safety of those on board.

  • What do nautical maps show?  Nautical maps, also known as nautical charts or sea charts, show a range of important information for safe navigation on water.  Some of the key features that nautical maps show include:
    1. Water depth:  Nautical maps provide information on the depth of the water in various areas, which is crucial for safe navigation and avoiding grounding.

    2. Shoreline details:  Nautical maps provide information on the shoreline, including the location of harbors, bays, inlets, and beaches.

    3. Underwater features:  Nautical maps show the location of underwater features such as rocks, shoals, and shipwrecks that can pose a hazard to navigation.

    4. Navigation aids:  Nautical maps show the location of navigation aids such as buoys, lighthouses, beacons, and markers that help mariners navigate safely.

    5. Weather and environmental features:  Nautical maps may also show weather and environmental features that can impact navigation, such as tides, currents, and wind patterns.

    6. Maritime boundaries:  Nautical maps may show maritime boundaries between countries, including territorial waters, exclusive economic zones, and international waters.

  • What is a nautical mile map?  There is no such thing as a “nautical mile map.”  A nautical mile is a unit of measurement used in navigation to measure distances at sea, and is equivalent to 1.852 kilometers or approximately 1.151 miles.

    Nautical maps, also known as nautical charts or sea charts, do use the nautical mile as a unit of measurement to indicate distances between points on the map.  However, a nautical chart is not specifically a “nautical mile map” but a map that uses nautical miles as a unit of measurement.

    Nautical charts are specialized maps used for navigation on water, and provide a range of information to mariners including water depths, navigational hazards, aids to navigation, and other important details for safe navigation.

  • How do you measure distance on a nautical map?  To measure distance on a nautical map, you can use a compass or a pair of dividers.

    First, place one point of the compass or dividers at the starting point of the distance you want to measure on the map.  Then, keeping the other point fixed, rotate the compass or dividers until the point is aligned with the endpoint of the distance you want to measure.  Finally, read the distance on the compass or dividers, which will give you the distance between the two points in nautical miles.

    It’s important to note that nautical miles are different from regular miles, so you should make sure you’re using the correct units when measuring distance on a nautical map.  Additionally, nautical maps often have a scale bar that can help you convert the distance on the map to the actual distance on the water.

  • How are nautical maps made?  Nautical maps, also known as nautical charts, are specialized maps that are designed for use by mariners and sailors. These maps show navigational information such as water depths, shoreline features, and navigational hazards, and are used to help sailors navigate safely on the water.

    Nautical maps are created using a variety of techniques, including:

    1. Hydrographic Surveys:  This involves using specialized equipment such as sonar and radar to measure water depths and map the seafloor.  The data collected is then used to create detailed depth charts that show the contours of the ocean floor.

    2. Aerial Photography:  High-resolution aerial photographs can be used to create maps of shorelines and coastal areas.  These photographs are then overlaid with other data, such as depth charts, to create a complete nautical map.

    3. Satellite Imagery:  Satellite imagery can be used to create maps of large bodies of water, such as oceans and seas.  This technique is particularly useful for creating maps of remote areas that are difficult to survey using traditional methods.

    Once the data has been collected, it is processed and compiled into a nautical chart.  The chart typically includes information on water depths, shoreline features, navigational hazards, and other information that is relevant to mariners.  The chart is then updated regularly to ensure that it remains accurate and up-to-date.

  • How do scientists collect data for nautical maps?  Scientists collect data for nautical maps through a process called hydrographic surveying.  This involves using specialized equipment and techniques to measure the depth and shape of the ocean floor, as well as the location and nature of any underwater hazards that may pose a risk to navigation.

    There are several methods that scientists use to collect data for nautical maps, including:

    1. Multibeam Sonar:  This involves using a specialized sonar system to send out multiple beams of sound waves, which bounce off the ocean floor and return to the ship.  By measuring the time it takes for the sound waves to travel to the ocean floor and back, scientists can create detailed 3D maps of the seafloor.

    2. Single Beam Sonar:  This involves using a single beam of sound waves to measure the depth of the ocean floor. While less accurate than multibeam sonar, this method is often used in shallower waters or areas where multibeam sonar is not practical.

    3. LIDAR:  This involves using laser pulses to measure the depth of the ocean floor.  This method is often used in shallow waters or areas where traditional sonar systems may not be effective.

    4. Gravimetry:  This involves measuring small variations in the Earth’s gravitational field to map the seafloor.  This method is particularly useful for mapping large, deep-sea features such as trenches and ridges.

    Once the data has been collected, it is processed and analyzed to create detailed nautical maps that can be used by mariners to navigate safely on the water.  These maps are regularly updated to ensure that they remain accurate and up-to-date.

  • Who uses nautical maps?  Nautical maps, also known as nautical charts, are primarily used by mariners and sailors to navigate safely on the water.  This includes:
    1. Commercial Shipping:  Nautical charts are essential for commercial shipping companies, which rely on accurate and up-to-date maps to navigate their vessels safely and efficiently.

    2. Recreational Boaters:  Recreational boaters, such as those who enjoy fishing, sailing, or cruising, also use nautical charts to navigate safely on the water and avoid hazards.

    3. Military and Government Agencies:  Nautical charts are used by military and government agencies for a variety of purposes, including naval operations, search and rescue missions, and environmental monitoring.

    4. Scientists and Researchers:  Scientists and researchers who study the ocean and its ecosystems also use nautical charts to plan and conduct research expeditions.

  • How do I read a nautical map?  Reading a nautical map, also known as a nautical chart, can seem intimidating at first, but with a little practice, it can become quite straightforward.  Here are the basic steps to reading a nautical chart:
    1. Understand the Scale:  The scale of a nautical chart tells you how much the map has been reduced in size from the actual area it represents.  It is typically located in the margin of the chart and is expressed as a ratio (e.g. 1:50,000). This means that one unit of measurement on the chart represents 50,000 units of measurement on the actual surface of the earth.

    2. Identify the Symbols and Abbreviations:  Nautical charts use a variety of symbols and abbreviations to represent different features and landmarks on the water.  These can include navigational aids, underwater hazards, shoreline features, and more.  A key or legend is usually provided on the chart to help you understand these symbols.

    3. Find the Depth Soundings:  The depth soundings, which are shown as lines or numbers on the chart, indicate the water depth at different points.  These can help you navigate safely and avoid running aground.

    4. Pay Attention to the Compass Rose:  The compass rose, which is typically located in the center of the chart, shows the orientation of the map in relation to true north.  This can help you orient yourself and navigate in the correct direction.

    5. Look for Additional Information:  Nautical charts may also include information such as tidal currents, water temperature, and weather patterns.  Paying attention to this additional information can help you plan your route and navigate safely.

  • What is a fathom?  A fathom is a unit of measurement used to indicate depth in nautical settings.  It is equivalent to 6 feet, or approximately 1.8 meters.  The term “fathom” comes from the Old English word “faedm” meaning “outstretched arms,” and was originally based on the distance between a man’s outstretched arms.

    In nautical charts and maps, depths are often indicated in fathoms rather than in feet or meters.  This is because fathoms are a more convenient unit of measurement for depth in a marine environment, where water depths can vary greatly and quickly.  For example, a depth of 20 fathoms would indicate a depth of 120 feet (or 36.5 meters).

    Fathoms are still used today in navigation and marine activities, including commercial shipping, fishing, and recreational boating.  Understanding the concept of a fathom is essential for safely navigating in shallow waters and avoiding underwater hazards.

  • How do I draw a nautical map?   Drawing a nautical map, also known as a nautical chart, is a complex process that requires specialized knowledge and equipment.  Here are the general steps involved in creating a nautical chart:
    1. Conduct a Hydrographic Survey:  The first step in creating a nautical chart is to conduct a hydrographic survey of the area.  This involves using specialized equipment, such as sonar and depth sounders, to measure the depth of the water and map the seafloor.  The survey data is then used to create a detailed topographic map of the area.

    2. Compile Data:  In addition to the survey data, other data sources may be used to create a nautical chart.  This can include satellite imagery, aerial photographs, and information from previous surveys.

    3. Create the Chart:  The data is then compiled and entered into specialized computer software, which is used to create the nautical chart.  The chart must include accurate and detailed information on the depth of the water, navigational aids, underwater hazards, shoreline features, and more.  The chart must also meet specific standards for accuracy, readability, and usability.

    4. Print and Distribute the Chart:  Once the nautical chart has been created, it is printed and distributed to users.  This can include commercial shipping companies, recreational boaters, government agencies, and others.

Do you have a question we didn’t answer? Don’t hesitate to contact us at 1-385-206-8700 or [email protected]

Worldwide Delivery

WhiteClouds has delivered maps around the world.

History of Nautical Maps

Nautical maps, also known as nautical charts, have a long and fascinating history.  For centuries, sailors and seafarers have relied on these maps to navigate the world’s oceans and safely reach their destinations. 

The earliest known nautical maps were created by the ancient Greeks and Romans.  These maps, which were based on astronomical observations and rudimentary navigation techniques, were used to navigate the Mediterranean Sea and other nearby waterways.  However, it was not until the Age of Exploration in the 15th and 16th centuries that nautical maps really began to develop into the sophisticated tools we know today.

During the Age of Exploration, European sailors set out to explore the world’s oceans and map new territories.  As they traveled further from home, they encountered new challenges, such as unpredictable weather patterns, dangerous underwater hazards, and unfamiliar coastlines.  To navigate these treacherous waters, sailors needed more detailed and accurate maps.

In response to this need, cartographers began to create nautical maps that were specifically designed for use at sea.  These maps included detailed information on coastal features, landmarks, and navigational aids.  They also incorporated new techniques, such as the use of latitude and longitude, to help sailors navigate more accurately.

By the 17th and 18th centuries, cartography had reached a golden age. Advances in technology, such as the invention of the printing press, made it possible to produce nautical maps on a large scale.  This allowed sailors to have access to the latest and most accurate information about the areas they were navigating.

During this time, nautical maps became more standardized, with common symbols and conventions that were recognized by sailors across different countries and regions. This made it easier for sailors to navigate unfamiliar waters and communicate with each other using a common language.

Today, nautical maps are still an essential tool for sailors and seafarers. While modern technology has introduced new methods of navigation, such as GPS and electronic charting systems, nautical maps remain an important backup in case of equipment failure or other emergencies.

In recent years, nautical maps have continued to evolve, incorporating new data sources and advanced mapping techniques.  For example, some modern nautical maps include information on ocean currents, weather patterns, and other environmental factors that can affect navigation.

In conclusion, nautical maps have a rich and fascinating history that spans thousands of years. From the ancient Greeks and Romans to the modern era of electronic navigation, nautical maps have played a crucial role in the exploration and discovery of our world’s oceans.  Today, they remain an essential tool for sailors and seafarers, providing accurate and reliable information that helps ensure safe navigation on the high seas. 

Bathymetric Map-Sir John Murray
The Oceans by Sir John Murray
Bathymetric Map-Marie Tharp
First Map of the Atlantic Ocearn Floor by Marie Tharp
Bathymetric Map-Mapping the Ocean Floor
Sonar Mapping Seafloor

Get a free quote

Get a Free Quote