3D Contour Maps

3D contour maps are a type of physical map that uses contour lines to represent the shape and elevation of a particular area or feature. They are a powerful tool for visualizing and understanding the topography of a region and are widely used in a range of fields such as geography, geology, and engineering.

Overview of 3D contour maps:  

3D contour maps are created by measuring the elevation of the land or feature at different points and connecting points with the same elevation with contour lines.  The resulting map shows the shape of the land or feature in three dimensions, allowing the user to see the peaks, valleys, and slopes in great detail.

Construction of 3D contour maps:  

To create a 3D contour map, surveyors or other professionals measure the elevation of the land or feature at different points using instruments such as a theodolite or GPS.  These measurements are then used to create a contour map, which shows the contours of the land or feature at regular intervals.

The contour lines are then drawn onto a physical map, which is then 3D printed.  The resulting 3D map can be viewed from different angles to gain a better understanding of the topography of the area or feature.

Applications of 3D contour maps:  

3D contour maps have a wide range of applications in a variety of fields.  In geography, they are used to represent the topography of a region, showing the location of mountains, valleys, and other features.  In geology, 3D contour maps are used to show the shape and distribution of rock formations and geological features such as faults.

In engineering, 3D contour maps are used to plan construction projects such as roads, bridges, and buildings.  By understanding the topography of the area, engineers can design structures that are safe, stable, and efficient.

In conclusion, 3D contour maps are a powerful tool for visualizing and understanding the topography of an area or feature. They are a physical representation of the land or feature, and can be used in a range of fields to gain a better understanding of the terrain, design structures, and plan construction projects.

Examples of 3D Contour maps using 3D Printing Technology


History of 3D Contour Maps

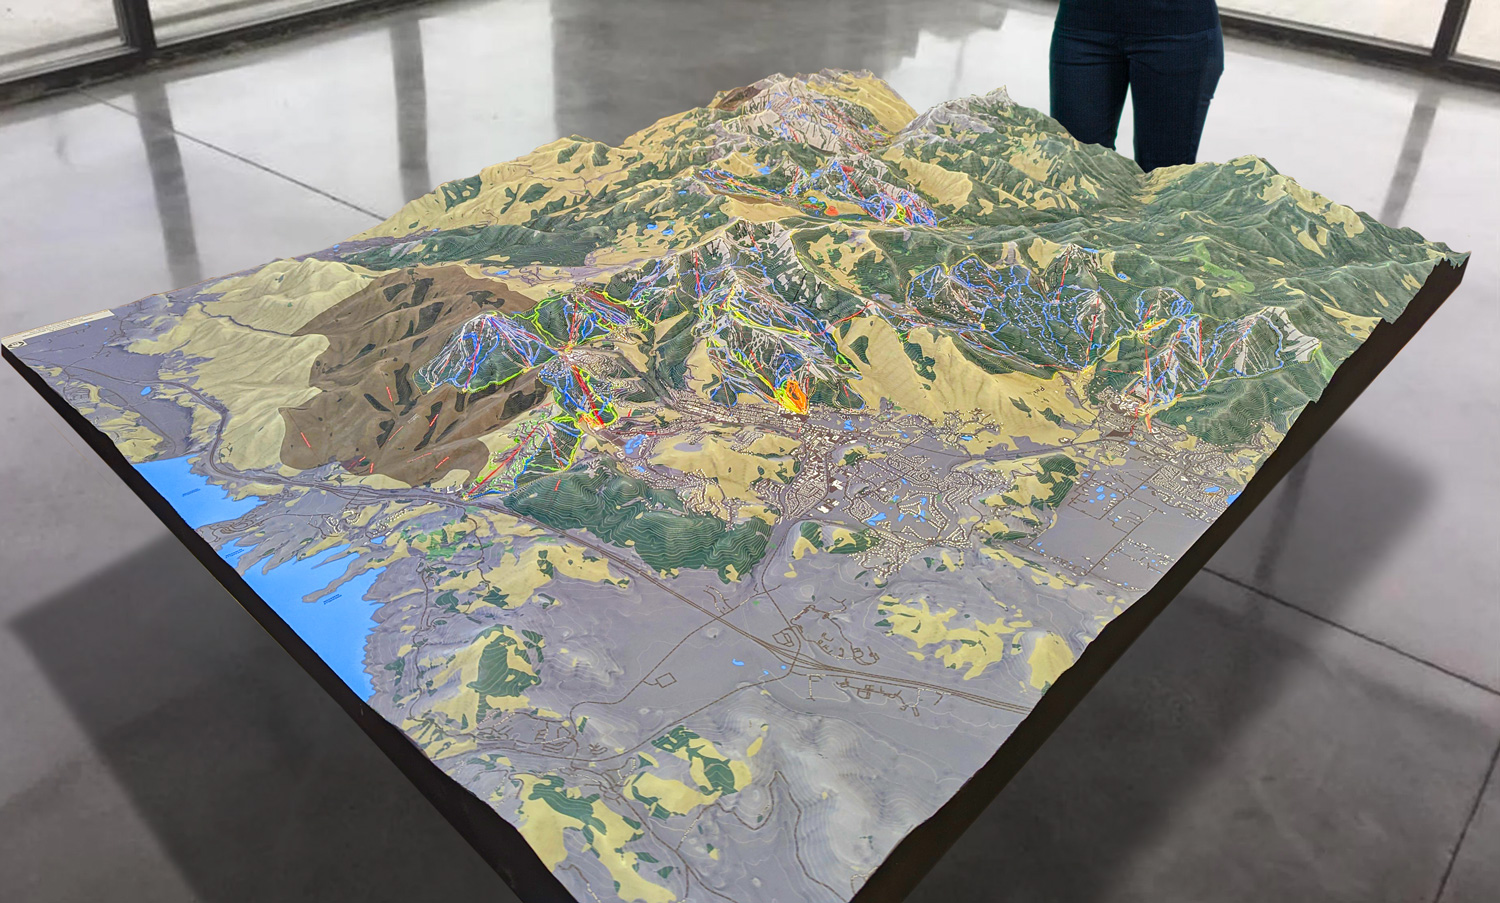
The history of physical 3D contour maps dates back to the 19th century when surveyors and cartographers began using contour lines to represent the shape and elevation of the land.  Prior to this, maps were typically drawn in a two-dimensional format, which made it difficult to accurately represent the shape and elevation of the terrain.

In 1787, the French engineer and mathematician Gaspard Monge introduced the concept of contour lines, which he used to represent the shape of terrain in his work on military fortifications.  However, it wasn’t until the 19th century that contour lines began to be used more widely in cartography.

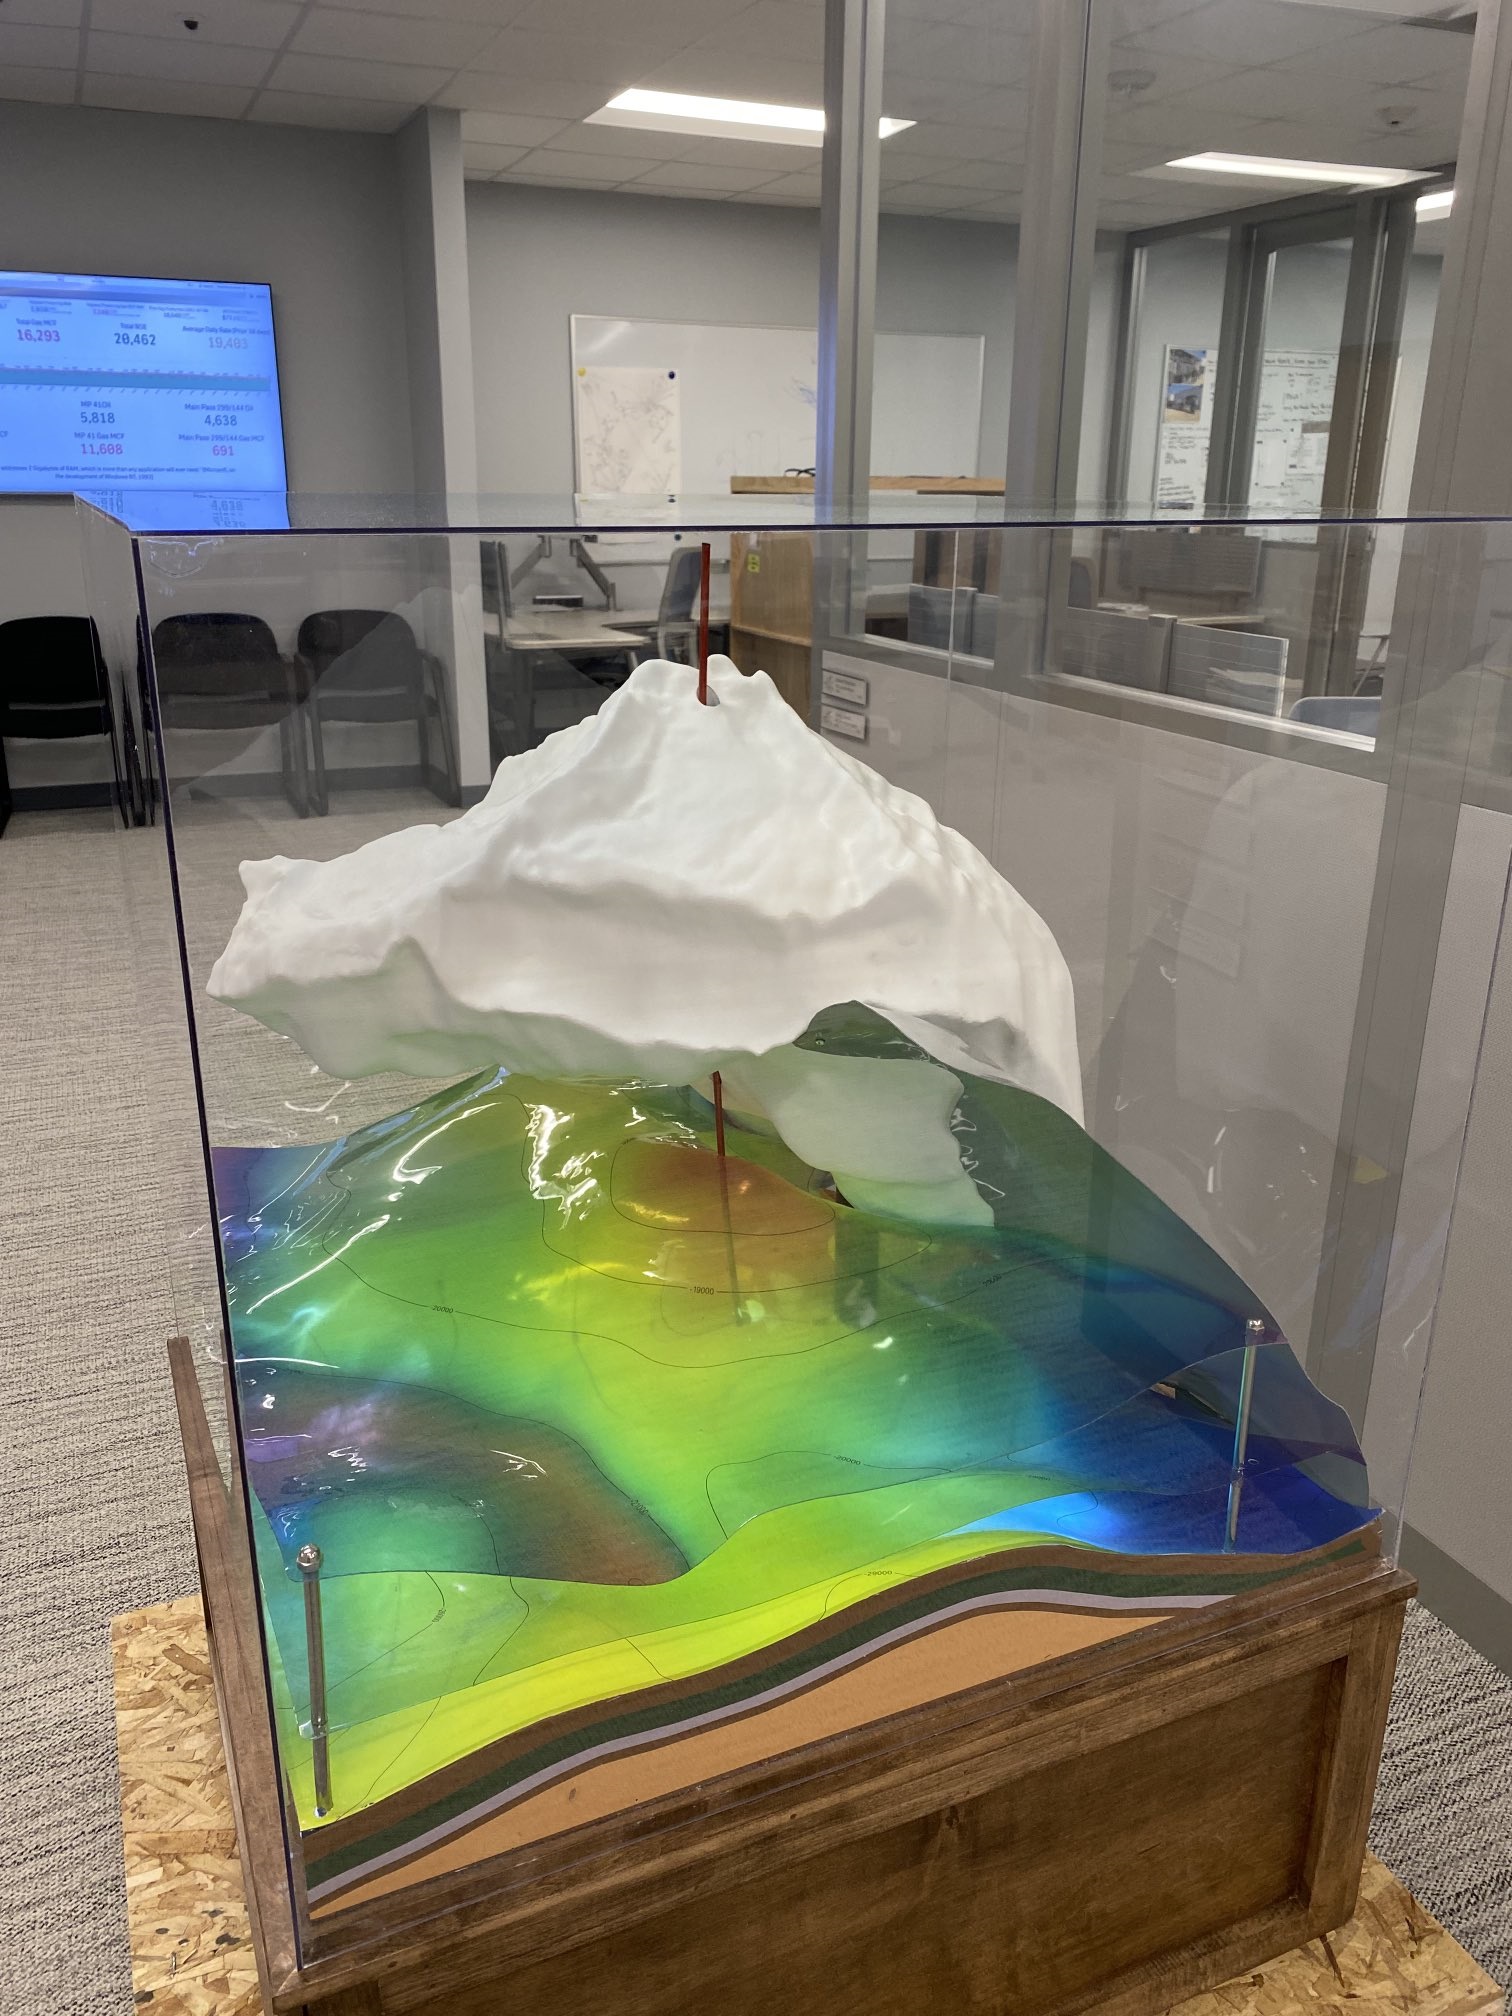
One of the early pioneers of contour mapping was the British cartographer and surveyor, William Smith. In the early 1800s, Smith created the first geological map of England and Wales, which included contour lines to represent the elevation of the land.  Smith’s map was a significant advancement in the field of cartography, as it allowed geologists and other scientists to better understand the structure and composition of the earth’s crust.

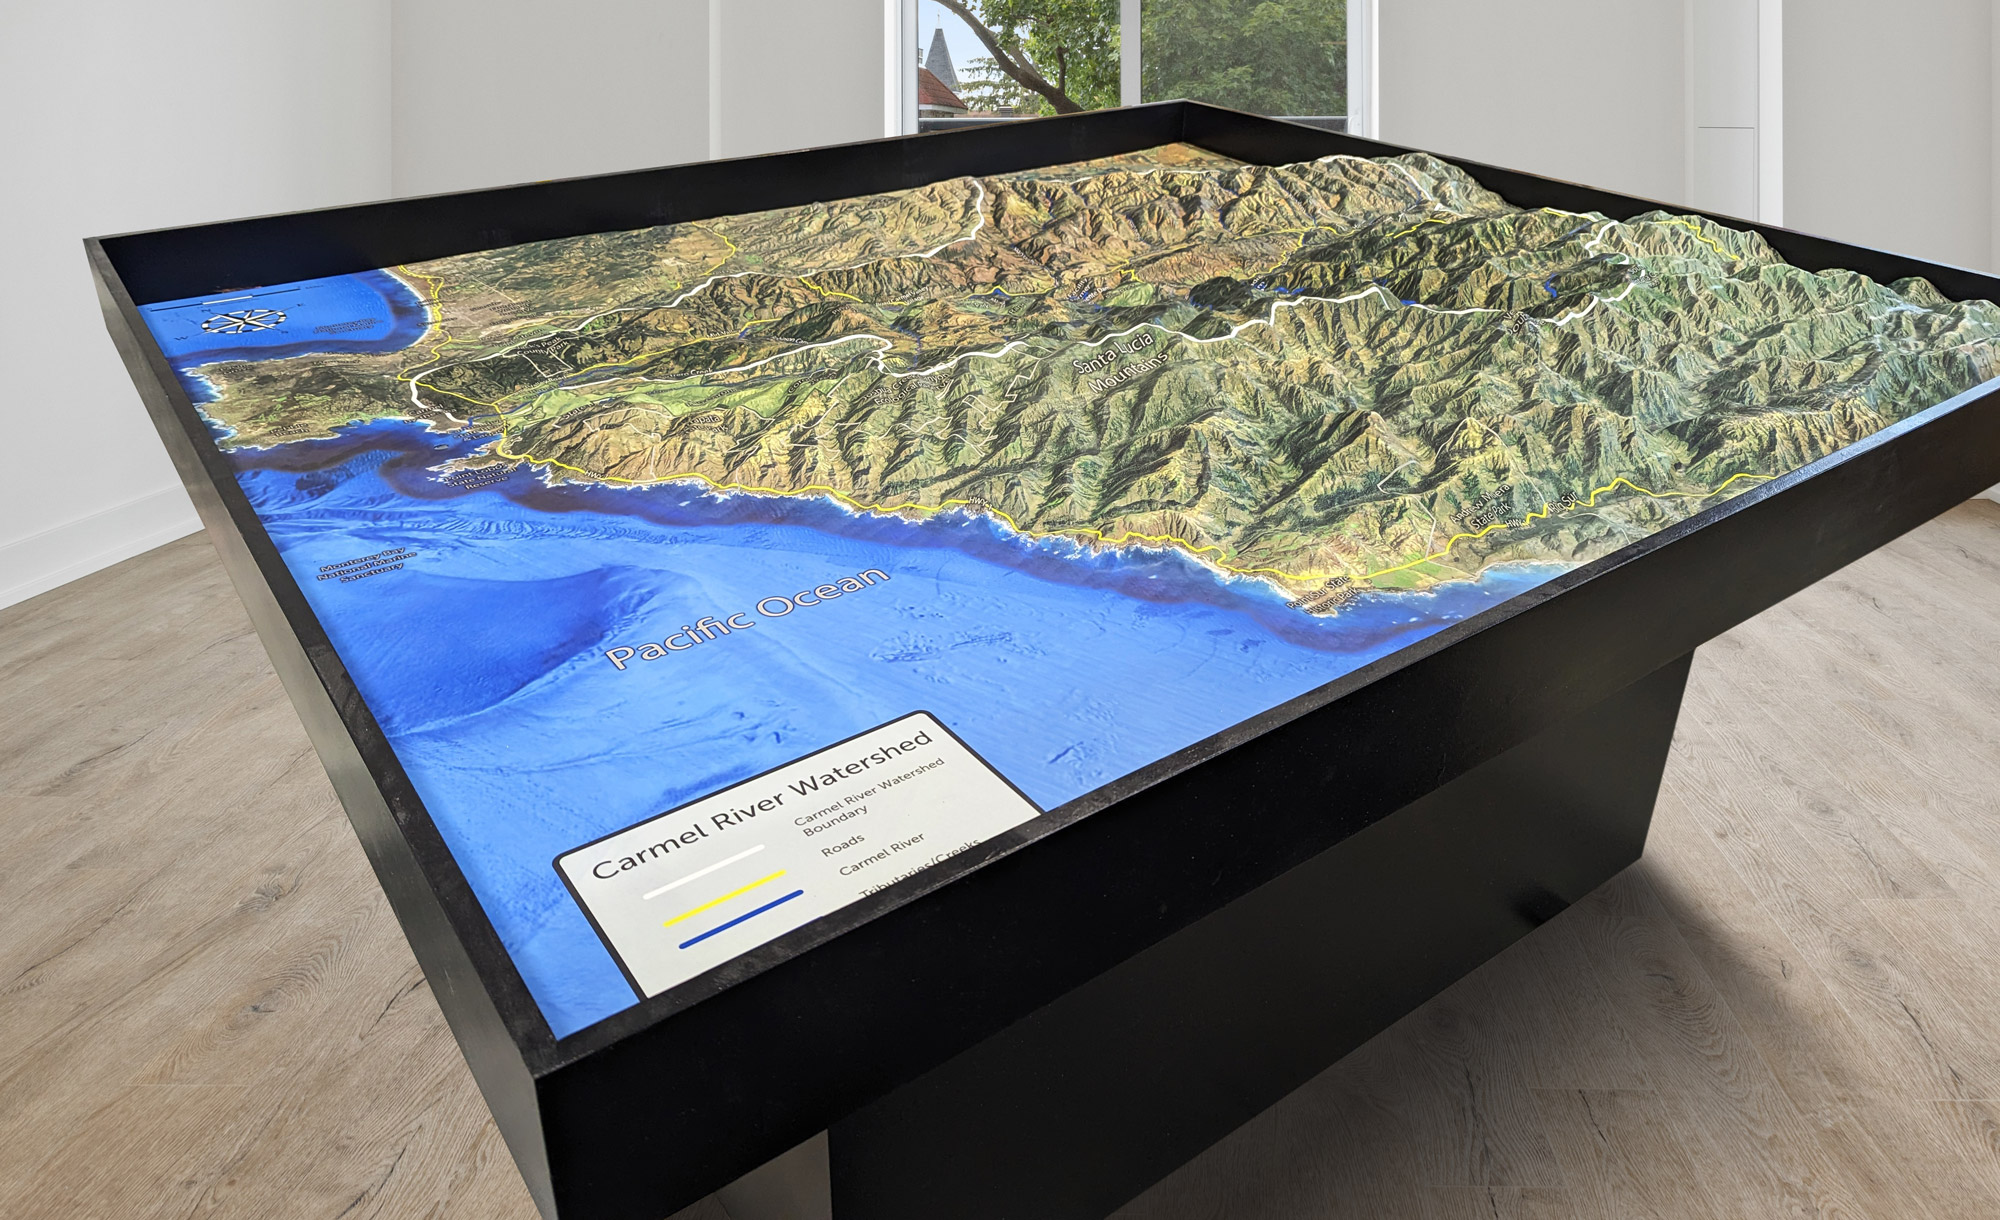
In the United States, the U.S. Geological Survey (USGS) played a key role in the development of 3D contour maps.  In the late 1800s, the USGS began producing topographic maps that included contour lines to represent the shape and elevation of the land. These maps were an important tool for surveyors, engineers, and geologists, and helped to advance the study of physical geography.

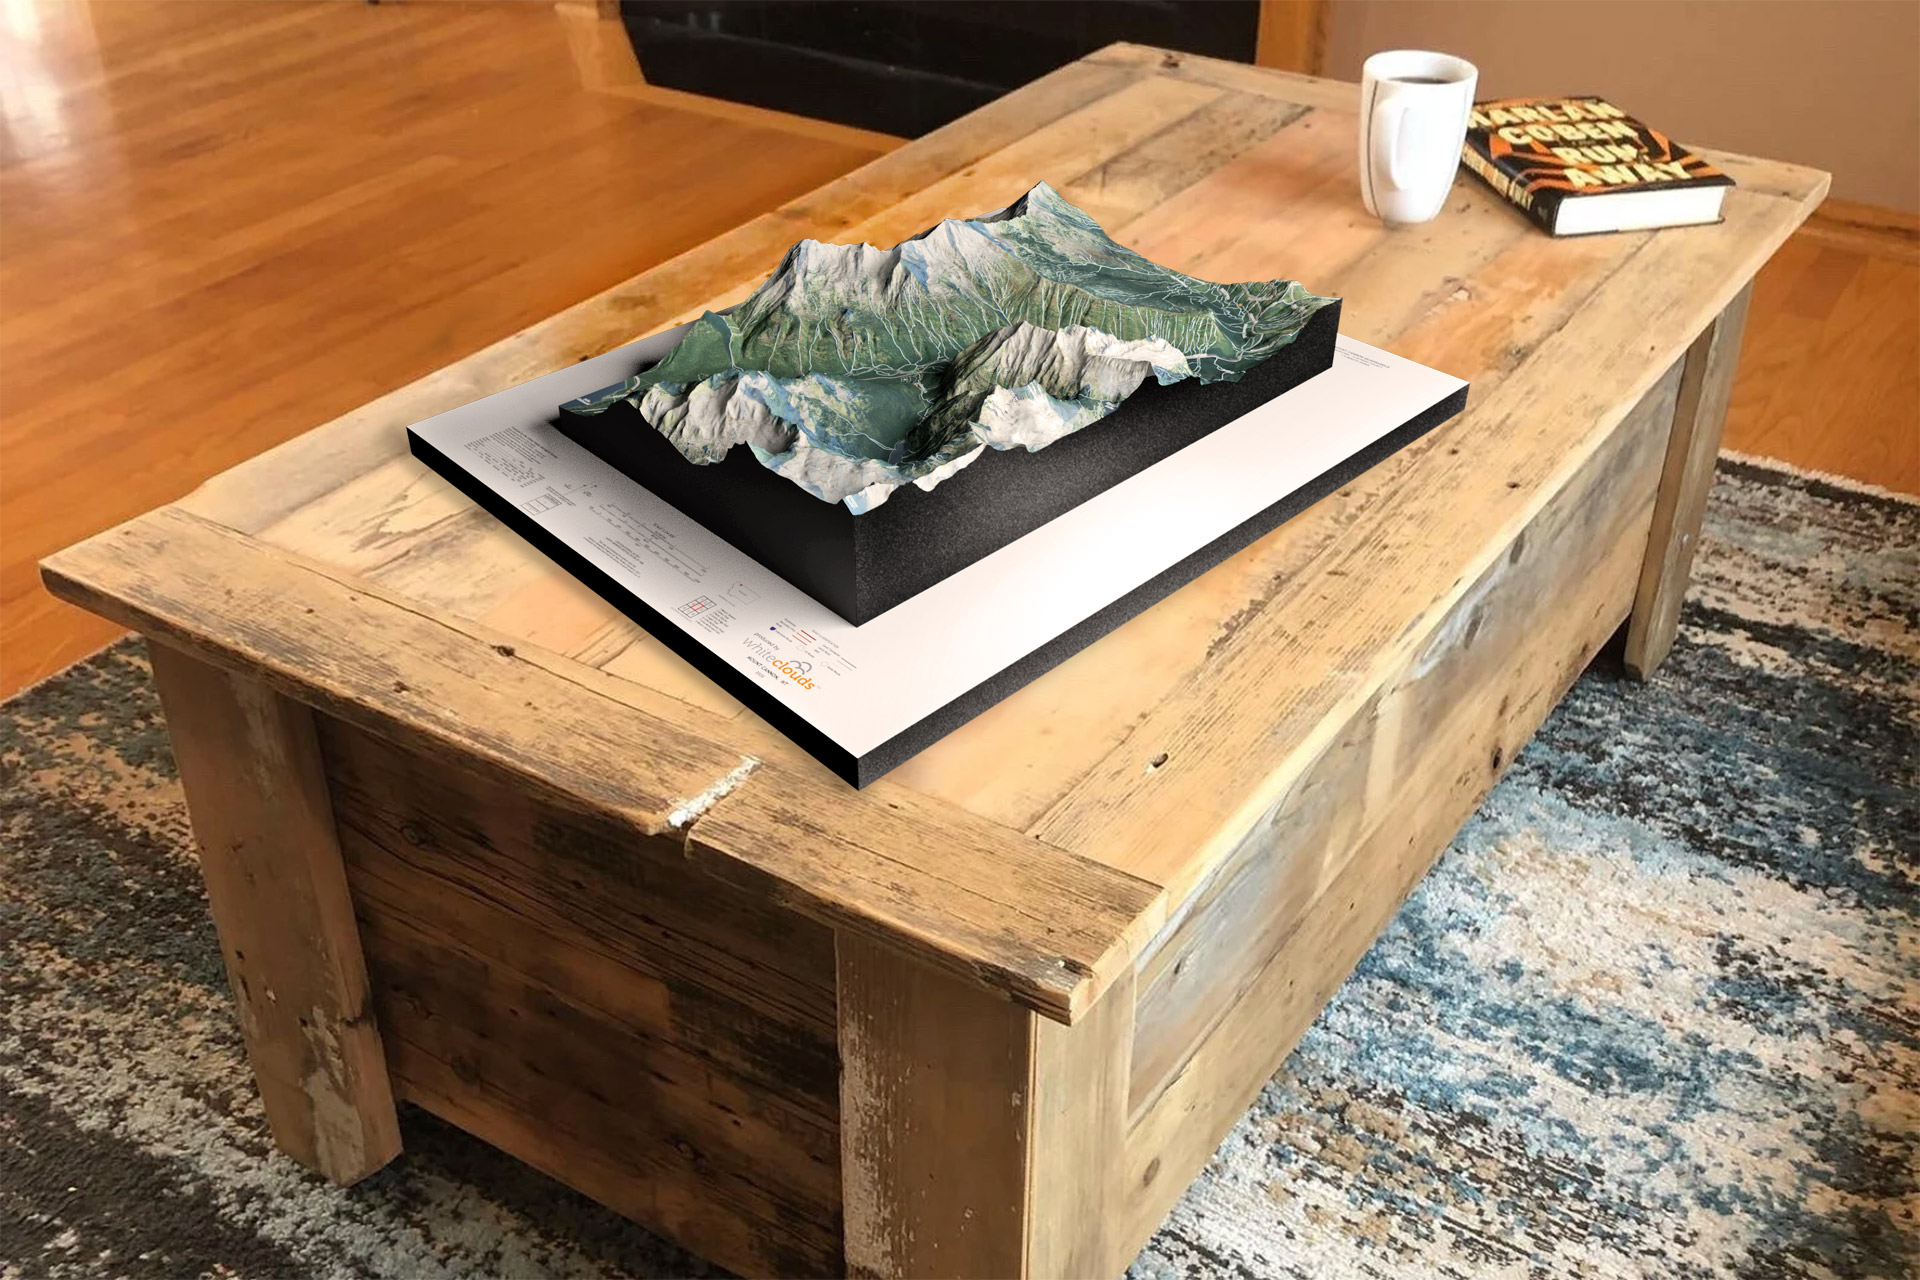
Today, 3D contour maps are an essential tool for understanding the shape and topography of the earth’s surface. They are used in a variety of fields, including geography, geology, engineering, and environmental science, and have been instrumental in shaping our understanding of the natural world. 

To learn more about the latest in 3D Printing, check out 3D printing.   

Get a Free Quote