
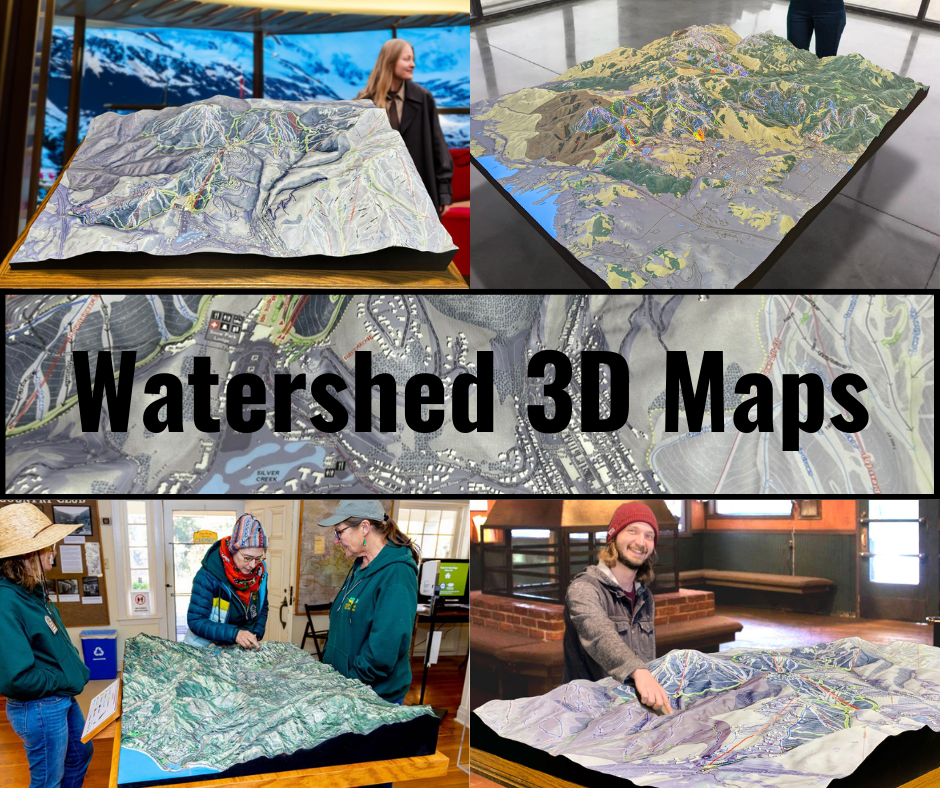
The Tar River Watershed Map: A Gateway to Understanding North Carolina’s Vital Waterway
The Tar River Watershed is one of North Carolina’s most significant natural systems, spanning approximately 6,148 square miles and encompassing a diverse array of landscapes, from rolling hills to flat coastal plains. As the lifeline for communities, ecosystems, and economies in the region, the Tar River provides critical water resources, supports agricultural activities, and sustains unique biodiversity. The Tar River Watershed Map is an essential tool for understanding this complex system, illustrating its intricate network of rivers, tributaries, wetlands, and urban areas.
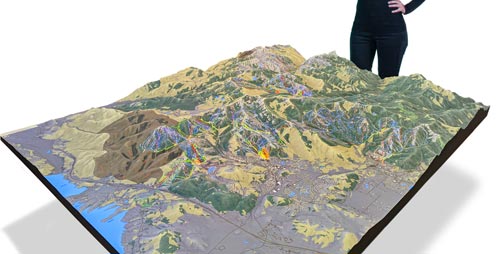
Diving into the Tar River Watershed Map reveals the interplay between natural and human systems. From its headwaters in the Piedmont region to its confluence with the Pamlico River and the Albemarle Sound, the watershed is a vital artery of life in eastern North Carolina. With advancements in mapping technologies, including the fabrication of 3D watershed maps, the Tar River Watershed Map offers an unparalleled opportunity to study and manage this critical resource in the face of growing environmental challenges.
Tracing the Tar River’s Flow: Geography and Hydrology of the Watershed
The Tar River originates near Roxboro, North Carolina, in the northern Piedmont region. Flowing southeastward, it passes through key towns such as Rocky Mount, Tarboro, and Greenville before merging into the Pamlico River. The watershed eventually drains into the Albemarle Sound, one of the largest estuaries on the Atlantic coast. Along its journey, the river gathers water from numerous tributaries, including Fishing Creek, Swift Creek, and Contentnea Creek, creating a vast and interconnected hydrological network.
The Tar River Watershed Map captures this intricate flow, detailing the river’s path and its relationship with the surrounding landscape. The map highlights significant reservoirs, such as the Tar River Reservoir, which provide water storage, flood control, and recreational opportunities. It also illustrates the river’s changing character as it transitions from the Piedmont’s rolling hills to the coastal plain’s flat and low-lying terrain. This gradient shapes the river’s velocity, sediment transport, and floodplain dynamics.
Wetlands are a key feature of the watershed, acting as natural buffers that absorb floodwaters, filter pollutants, and provide habitat for diverse species. The map showcases the distribution of these wetlands, emphasizing their role in maintaining the watershed’s ecological health and resilience.
Ecosystems and Biodiversity of the Tar River Watershed
The Tar River Watershed is a biodiversity hotspot, home to a variety of ecosystems that support unique flora and fauna. From riparian forests and freshwater wetlands to estuarine habitats, the watershed provides critical resources for both terrestrial and aquatic species. The Tar River Watershed Map offers a detailed view of these ecosystems, helping to visualize their distribution and connectivity.
Riparian zones along the Tar River and its tributaries are vital for stabilizing riverbanks, filtering runoff, and supporting wildlife. These areas are inhabited by species such as deer, otters, and migratory birds, which rely on the river’s resources for survival. The map highlights these riparian corridors, illustrating their importance for both biodiversity and water quality.
Wetlands within the watershed, including those in the Roanoke-Tar-Neuse Conservation Area, are critical for maintaining ecological balance. These wetlands are home to amphibians, waterfowl, and fish, and they provide essential ecosystem services such as carbon storage and nutrient cycling. The map reveals the distribution of these wetlands, showcasing their role as vital components of the watershed’s hydrology and biodiversity.
The estuarine ecosystems of the Pamlico River and Albemarle Sound are particularly significant, serving as nurseries for fish and shellfish, including striped bass, blue crabs, and shrimp. These habitats are influenced by the flow of the Tar River, and the map illustrates how freshwater inflows shape estuarine biodiversity. Maintaining water quality and consistent flow is critical for the health of these ecosystems.
Human Influence and Water Management in the Tar River Watershed
The Tar River Watershed has been shaped by human activity for centuries, from Indigenous stewardship to modern agriculture and urban development. These influences have brought both benefits and challenges, altering the watershed’s natural dynamics and creating a need for sustainable management. The Tar River Watershed Map provides a comprehensive view of these interactions, helping stakeholders address critical issues.
Agriculture is a dominant land use in the watershed, with fields of soybeans, sweet potatoes, and tobacco spread across the region. While agriculture is vital to the local economy, it also contributes to nutrient runoff and habitat loss. The map identifies agricultural zones and their proximity to rivers and wetlands, offering insights into how farming practices impact water quality and ecosystem health.
Urban areas such as Rocky Mount, Greenville, and Tarboro add complexity to the watershed. The map highlights these population centers and their associated infrastructure, including stormwater systems and wastewater treatment facilities. Understanding the relationship between urban development and the watershed’s hydrology is essential for effective water management and pollution control.
Flooding is a recurring issue in the Tar River Watershed, particularly in the coastal plain where flat terrain exacerbates water retention. The map provides valuable information on flood-prone areas and natural flood mitigation features, such as wetlands and floodplains. This information is critical for disaster preparedness and community resilience.