
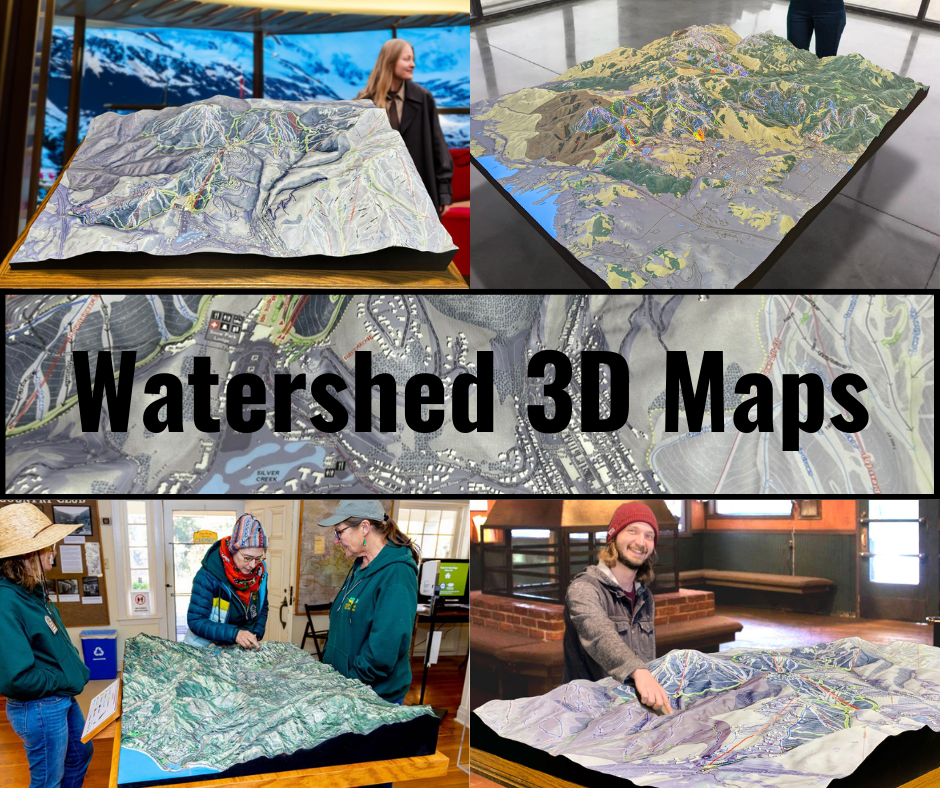
The San Antonio River Watershed Map: A Journey Through South Texas’ Vital Waterway
The San Antonio River Watershed is one of South Texas’ most significant hydrological systems, encompassing over 4,180 square miles across diverse landscapes. The San Antonio River itself is central to the region’s natural beauty, culture, and economy, flowing 240 miles from its headwaters in Bexar County to its confluence with the Guadalupe River near the Gulf of Mexico. The San Antonio River Watershed Map is a vital tool for understanding this dynamic system, offering a detailed view of its extensive river networks, wetlands, and urban-rural interplay.
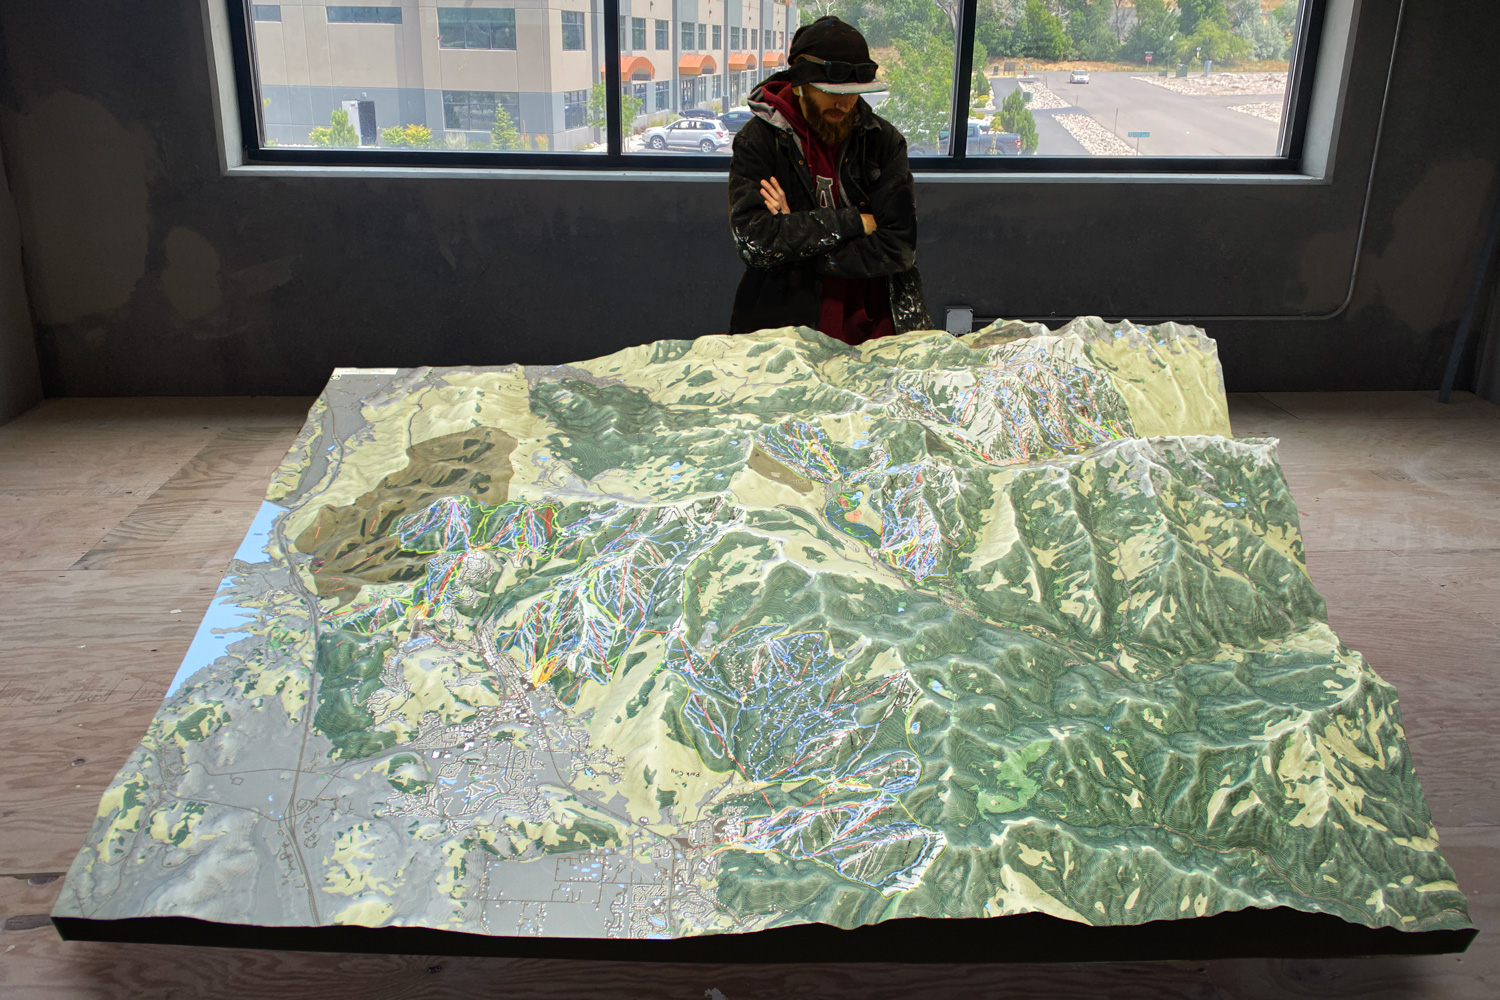
Exploring the San Antonio River Watershed Map reveals the intricate connections between its ecological systems and human activities. From its role in supporting agriculture and biodiversity to its cultural significance in shaping San Antonio’s identity, the watershed is more than just a source of water—it’s a lifeline. With advancements like 3D mapping, we now have cutting-edge tools to analyze, manage, and protect this critical resource more effectively.
Tracing the San Antonio River’s Course: Geography and Hydrology of the Watershed
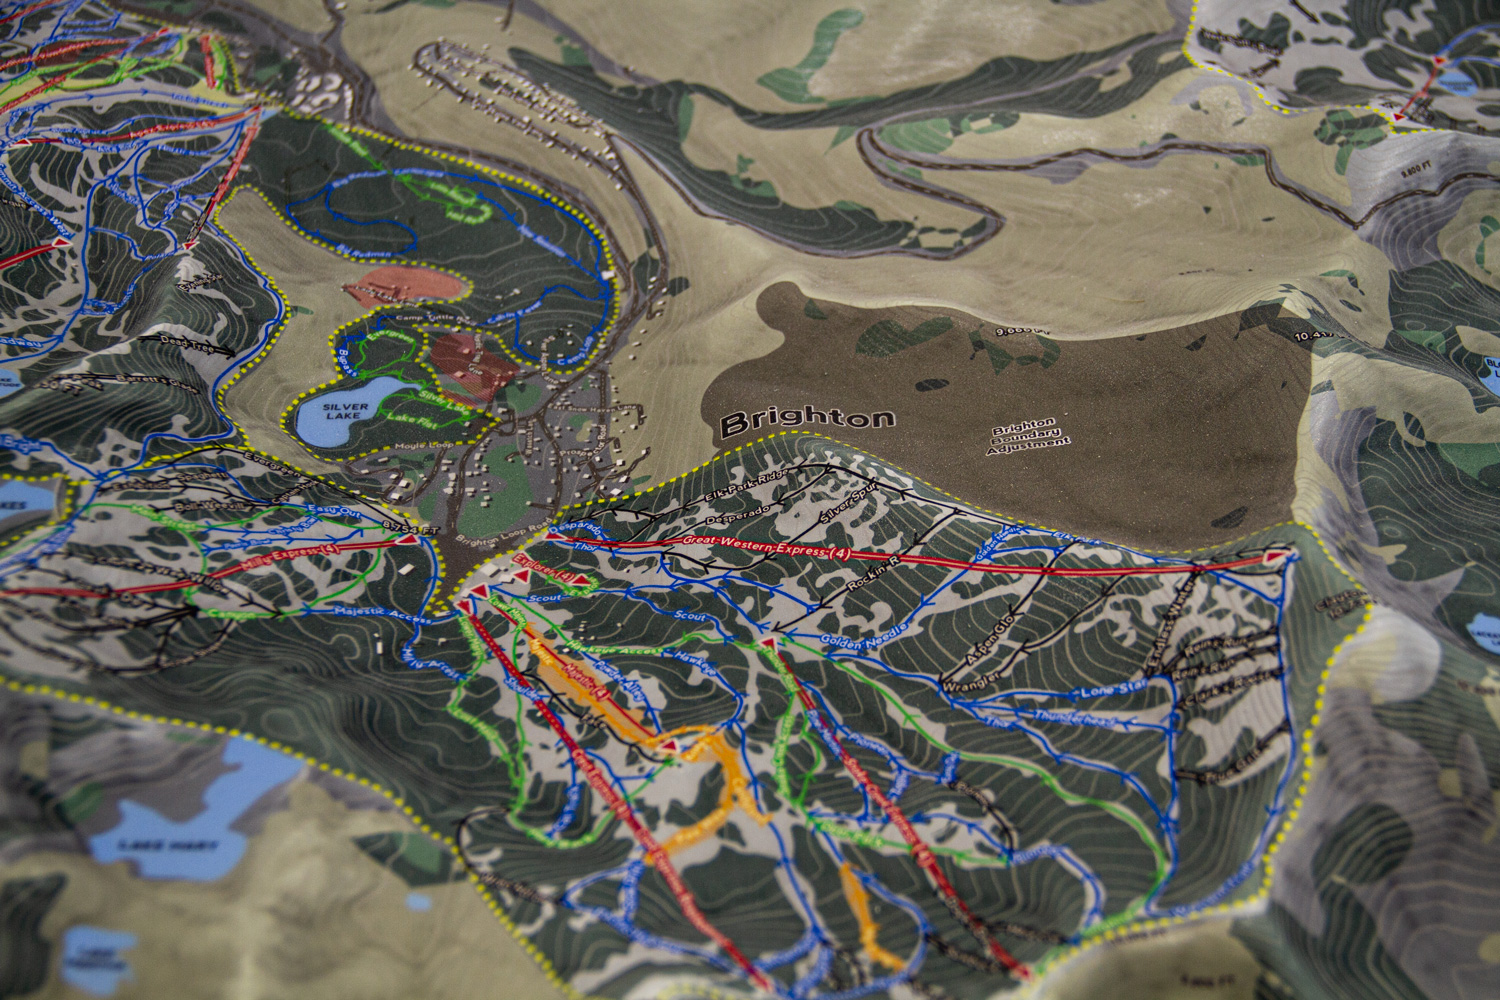
The San Antonio River originates from springs near downtown San Antonio, including the iconic San Pedro Springs. Flowing southeast through lush landscapes and historical landmarks, it passes urban areas like San Antonio, Floresville, and Goliad before joining the Guadalupe River. The San Antonio River Watershed Map captures this journey, detailing the river’s path and its connections to major tributaries such as the Medina River, Salado Creek, and Cibolo Creek.
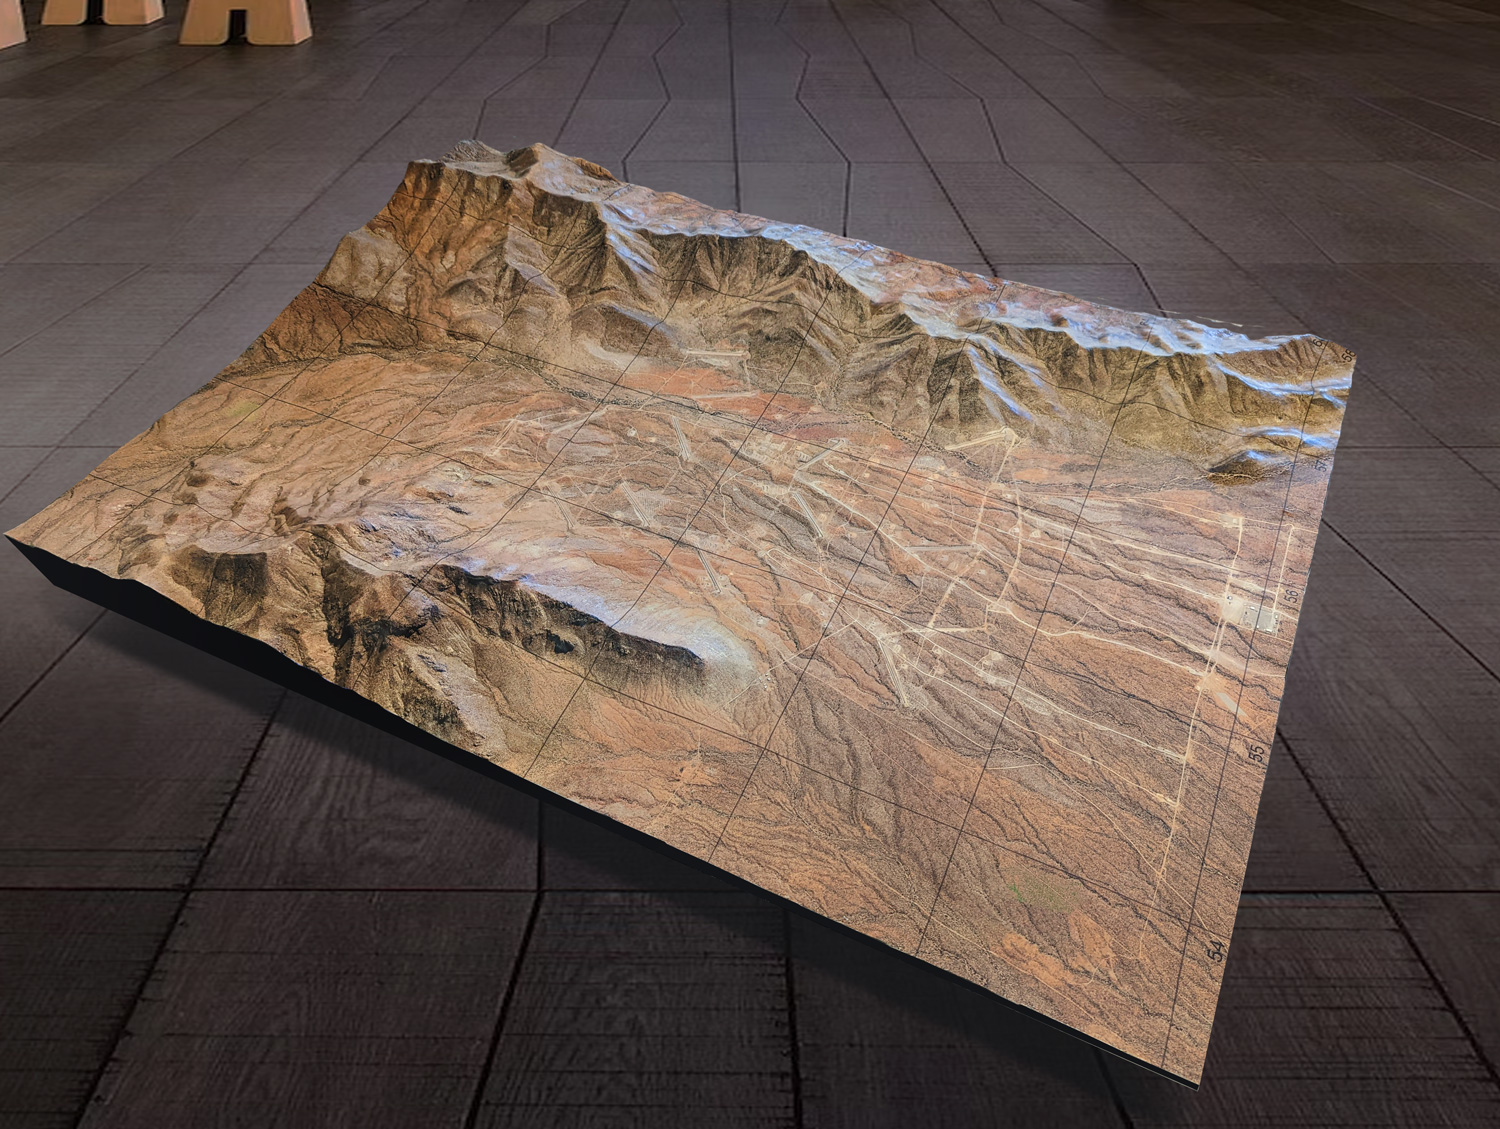
The watershed’s geography spans the Texas Hill Country, Blackland Prairies, and Gulf Coastal Plains, each contributing unique characteristics to the river’s flow and ecology. The map illustrates these diverse terrains, providing insights into how topography shapes the river’s hydrological dynamics, including its seasonal variability and sediment transport.
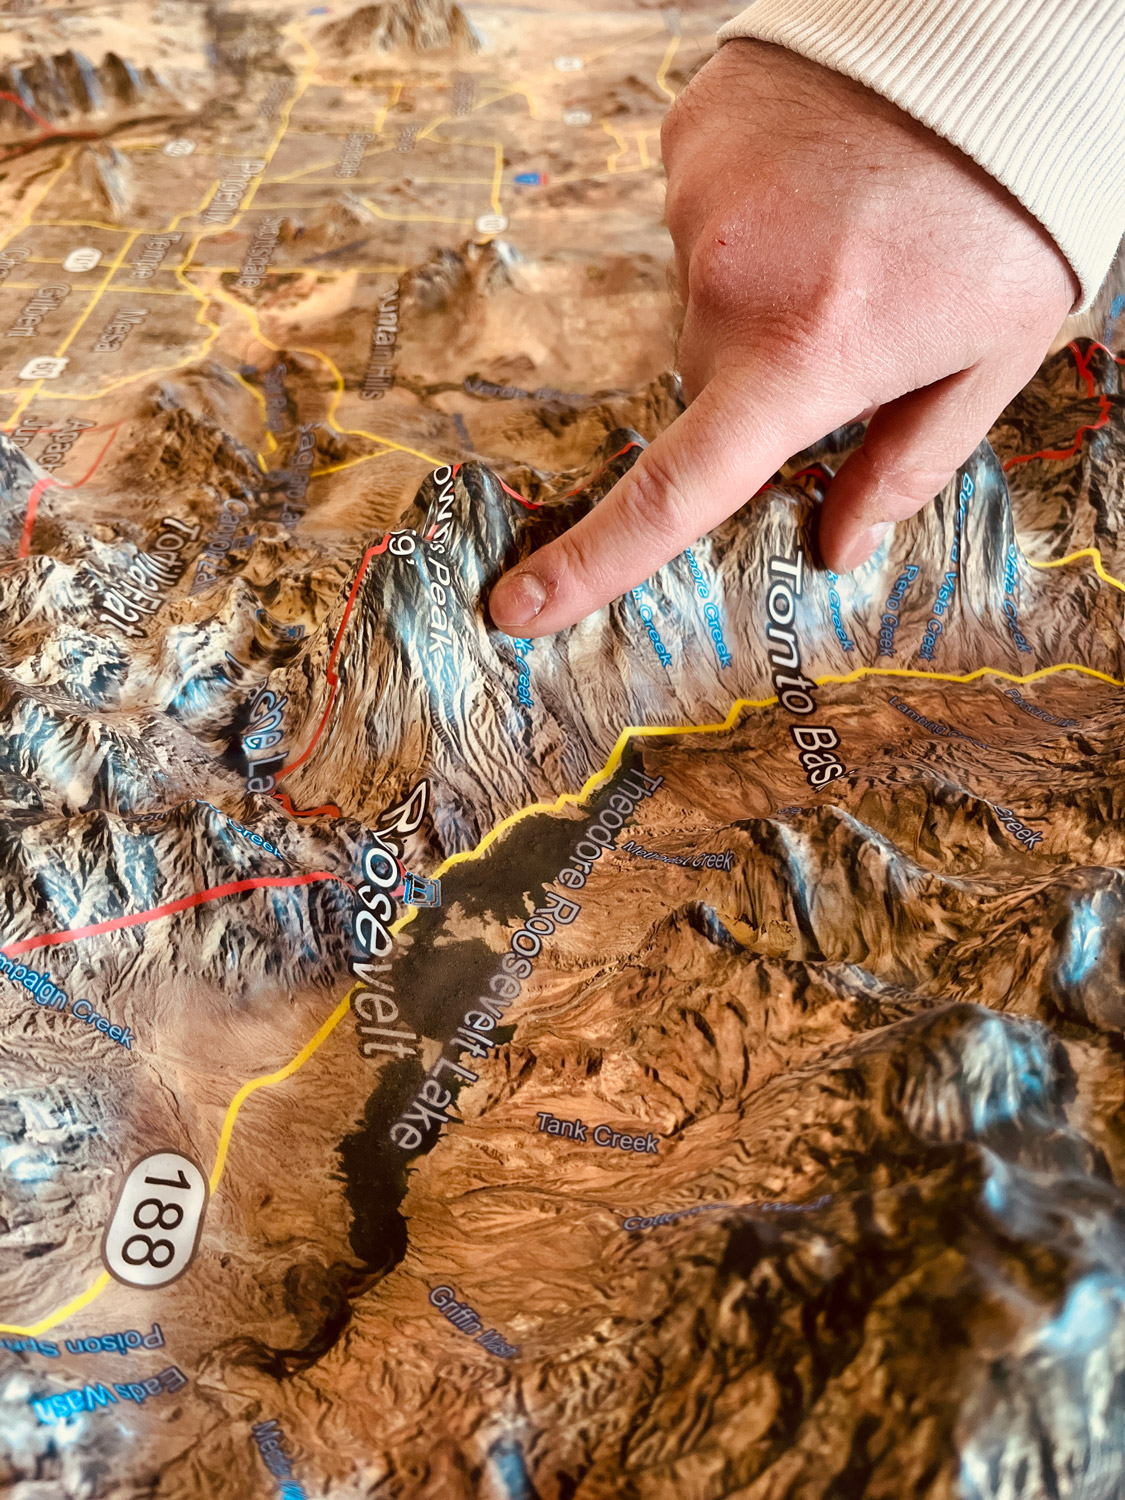
Reservoirs like Calaveras Lake and Braunig Lake play pivotal roles within the watershed. These man-made lakes support industrial cooling, recreational fishing, and wildlife habitats. The map highlights these reservoirs as key components of the watershed’s infrastructure, integrating their significance into the broader hydrological framework.
Ecosystems and Biodiversity in the San Antonio River Watershed
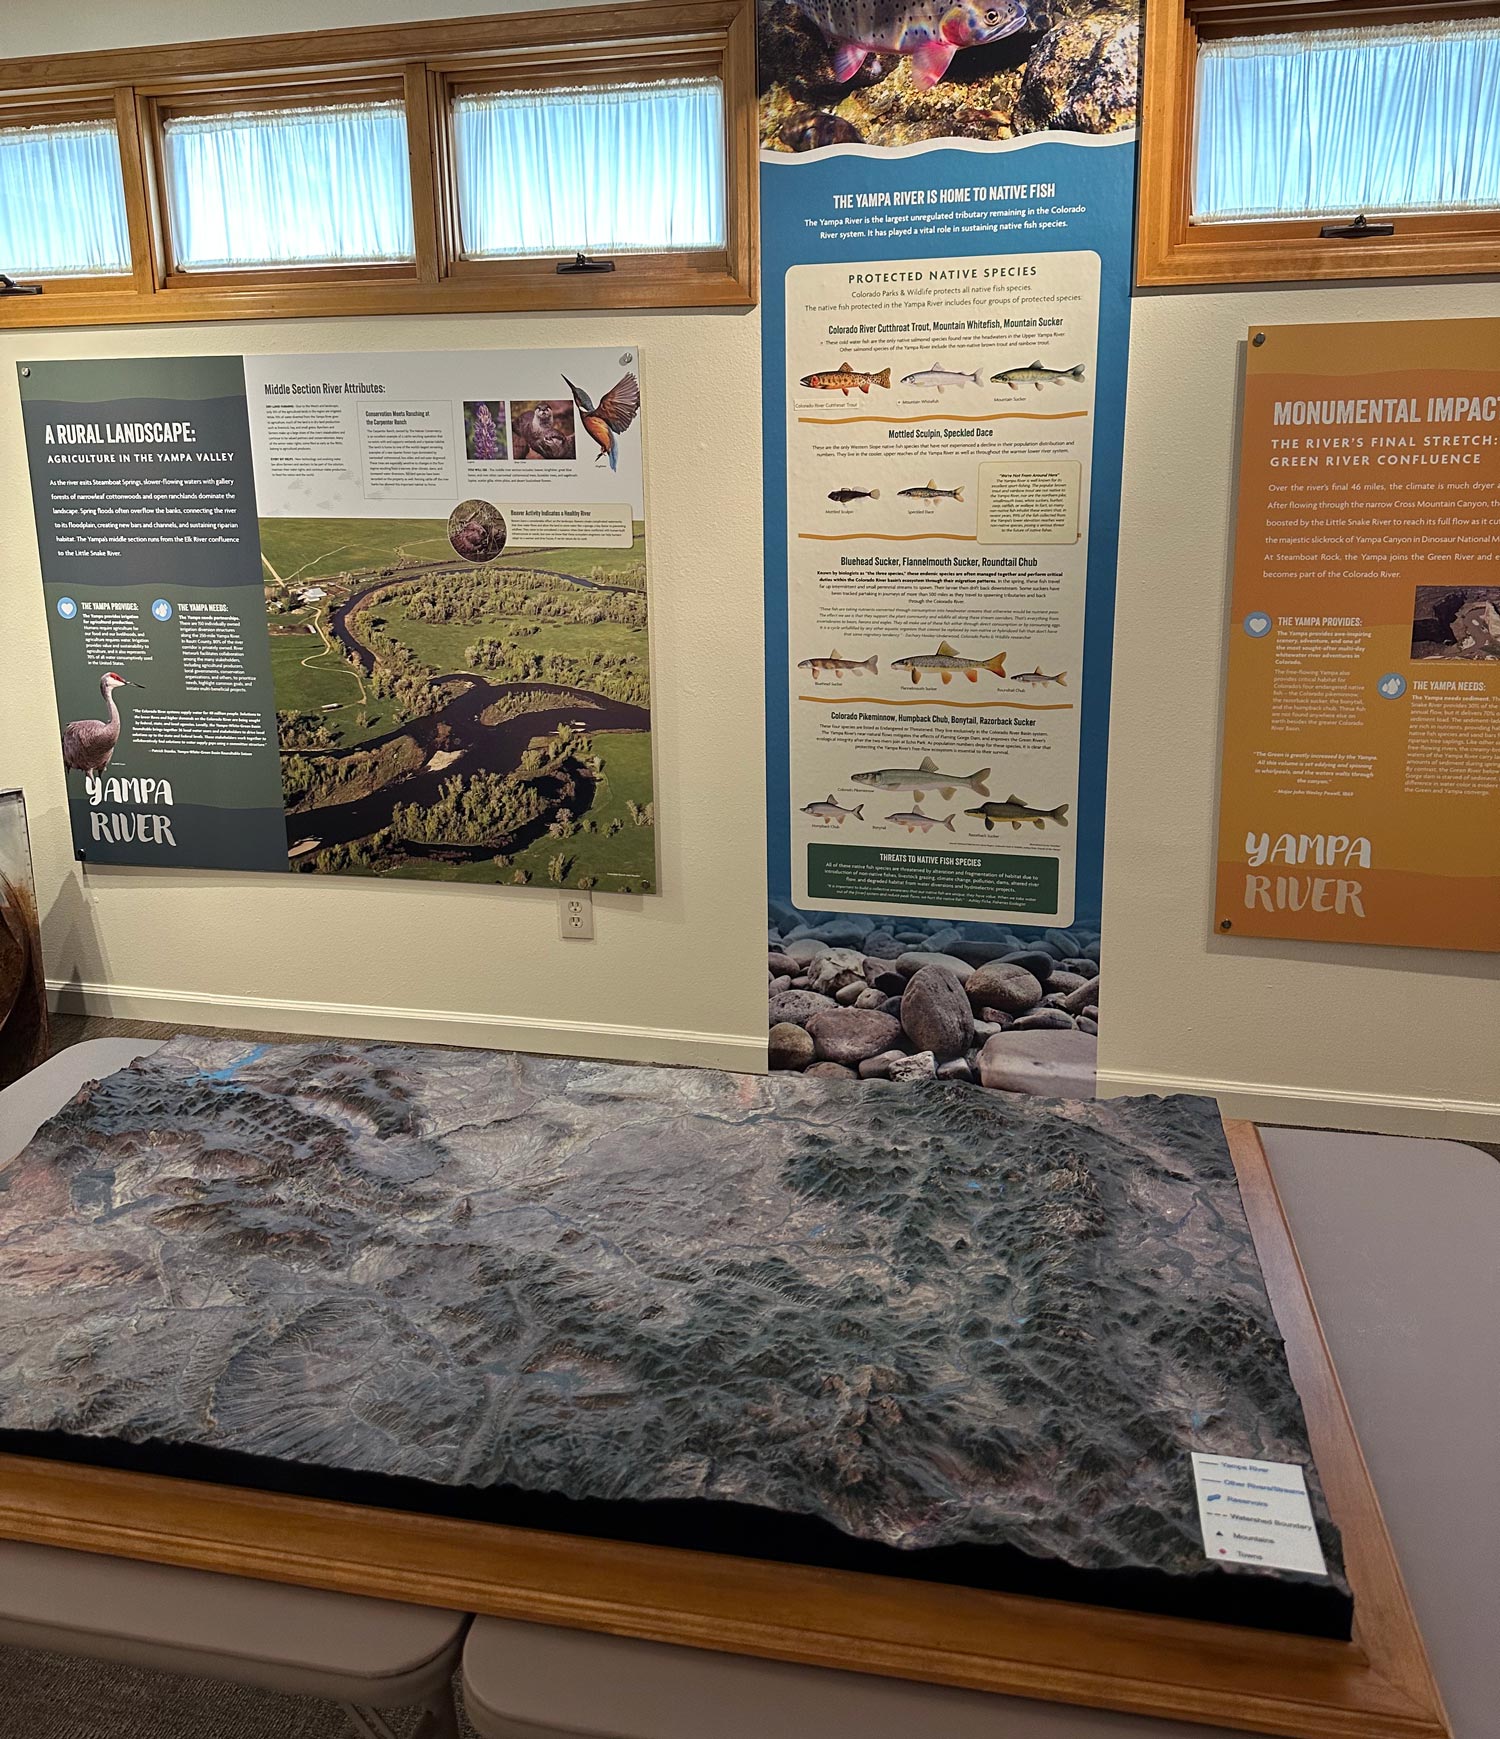
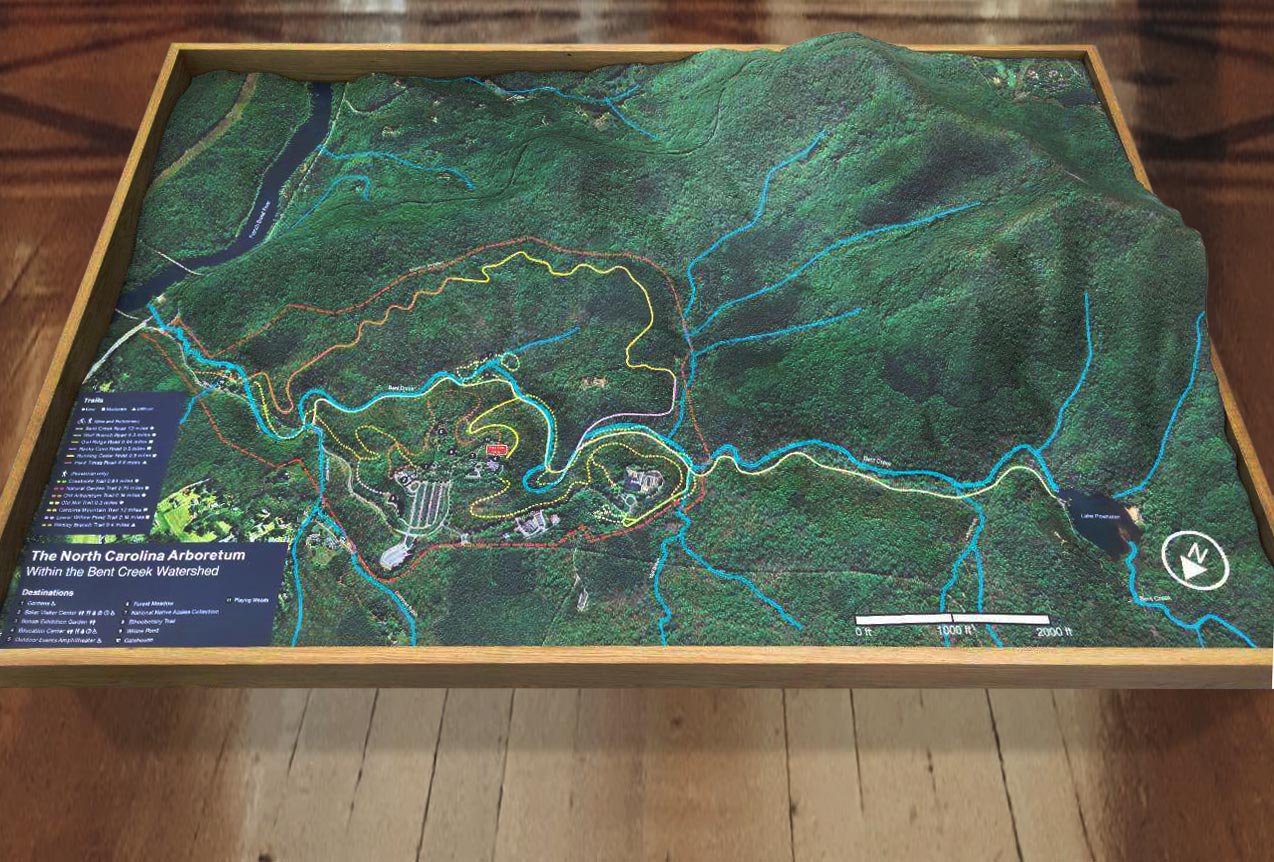
The San Antonio River Watershed is home to a remarkable diversity of ecosystems, ranging from riparian forests and grasslands to wetlands and estuarine habitats. These ecosystems sustain a variety of plant and animal species, many of which are adapted to the region’s unique environmental conditions. The San Antonio River Watershed Map provides a detailed perspective on these ecosystems, illustrating their distribution and connections.
Riparian zones along the San Antonio River and its tributaries are vital habitats for species such as herons, turtles, and Guadalupe bass. These areas also play crucial roles in stabilizing riverbanks, filtering pollutants, and maintaining water quality. The map emphasizes these riparian corridors, showcasing their ecological importance and the need for conservation.
Wetlands within the watershed act as natural buffers, mitigating floods and filtering water. They provide habitat for amphibians, fish, and migratory birds while supporting essential ecosystem services like nutrient cycling and carbon storage. The map highlights these wetlands, helping conservationists prioritize areas for protection and restoration.
The estuarine ecosystems at the watershed’s downstream end, near its confluence with the Guadalupe River, are critical for supporting marine biodiversity. These habitats depend on the river’s freshwater inflows to maintain the delicate balance of salinity and nutrients. The map illustrates these connections, emphasizing the importance of sustaining adequate water flows for coastal ecosystems.
Human Influence and Water Management in the San Antonio River Watershed
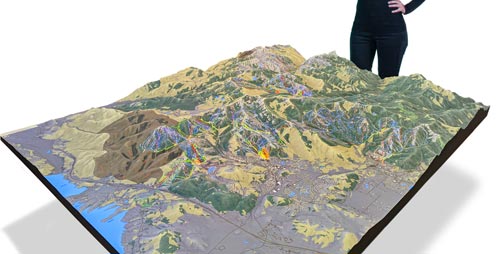
Human activity has profoundly influenced the San Antonio River Watershed, from early Indigenous stewardship to modern agriculture, urban development, and industrial use. These interactions have altered the watershed’s natural dynamics, presenting both challenges and opportunities. The San Antonio River Watershed Map offers a comprehensive view of these relationships, helping stakeholders navigate complex management issues.
San Antonio, the largest urban center in the watershed, has significantly shaped the river’s hydrology. The map highlights urban infrastructure such as stormwater systems, wastewater treatment plants, and flood control structures, showing how they interact with the river. Projects like the San Antonio River Walk and the Mission Reach Ecosystem Restoration demonstrate the potential for integrating ecological restoration with urban development.
Agriculture remains a dominant land use in the watershed, with fields of cotton, sorghum, and hay stretching across its plains. Irrigation from the San Antonio River and its tributaries is essential for sustaining these crops, but it also contributes to challenges like nutrient runoff and sedimentation. The map identifies agricultural zones and their proximity to waterways, offering insights into how farming practices impact water quality and ecosystem health.
Water quality is a central concern in the San Antonio River Watershed. Urban runoff, agricultural activities, and industrial discharges contribute to pollution, threatening both ecosystems and human health. The map serves as a tool for identifying pollution sources, tracking their impacts, and prioritizing areas for intervention.