
The Sabine River Watershed Map: Exploring a Vital Lifeline of the South
The Sabine River Watershed, a crucial hydrological system in the southern United States, spans over 9,600 square miles across Texas and Louisiana. This river and its watershed serve as an essential resource for communities, ecosystems, and industries, providing water for agriculture, energy production, and biodiversity. The Sabine River Watershed Map is an invaluable tool for understanding this interconnected system, illustrating its complex network of rivers, tributaries, wetlands, and reservoirs.
Exploring the Sabine River Watershed Map reveals the river’s vital role in shaping the region. From its headwaters in Texas to its outlet into the Gulf of Mexico, the Sabine River flows through diverse landscapes, connecting people and nature. With advancements in mapping technologies, including 3D watershed models, the Sabine River Watershed Map offers a cutting-edge perspective on managing and preserving this critical resource.
Tracing the Sabine River’s Path: Geography and Hydrology of the Watershed
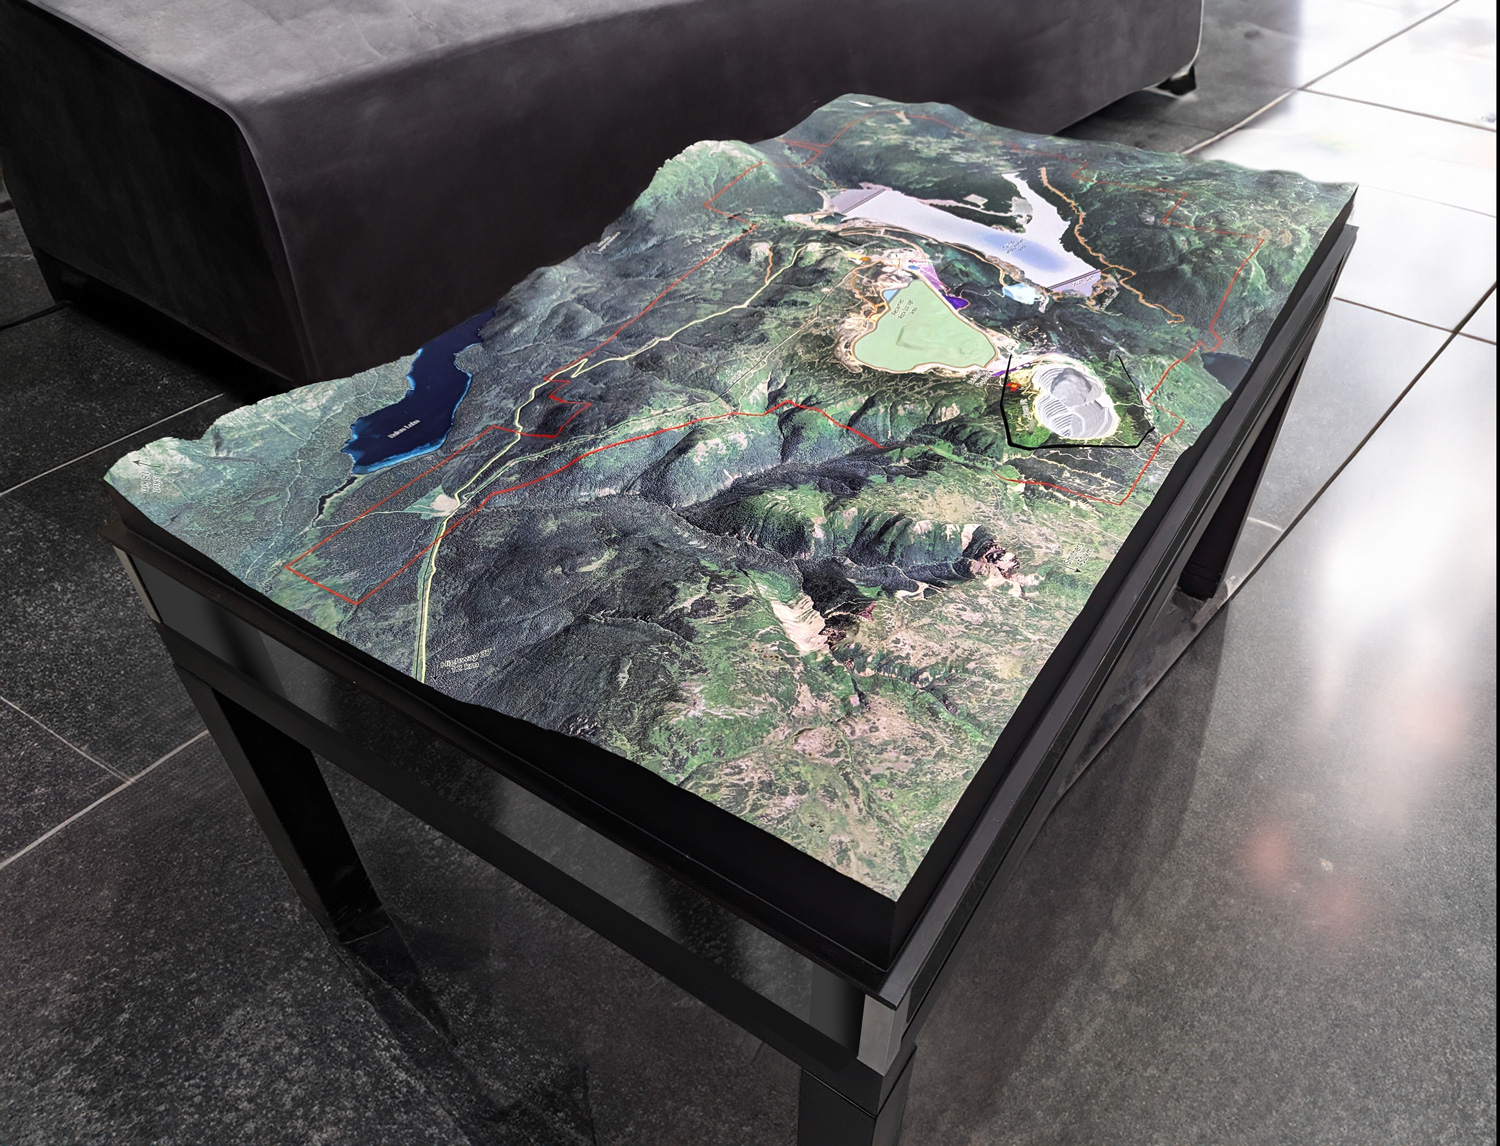
The Sabine River originates in northeast Texas, near Celeste, and flows southeast for 510 miles, forming much of the border between Texas and Louisiana before emptying into Sabine Lake and the Gulf of Mexico. The Sabine River Watershed Map captures this journey, detailing the river’s path and its connections to major tributaries, including the Cowleech Fork, South Fork, and Big Sandy Creek.
The watershed features a variety of landscapes, from rolling hills and forests in its upper reaches to coastal plains and estuaries near its mouth. This diverse topography influences the river’s flow dynamics, sediment transport, and seasonal water availability. The map highlights these geographical variations, offering insights into how the river interacts with its environment.
Key reservoirs within the watershed, such as Lake Tawakoni and Toledo Bend Reservoir, are vital for water storage, flood control, and recreation. The Sabine River Watershed Map showcases these reservoirs and their role in regulating the river’s flow while supporting human and ecological needs.
Ecosystems and Biodiversity in the Sabine River Watershed
The Sabine River Watershed is a biodiversity hotspot, supporting a wide range of ecosystems, from riparian forests and wetlands to estuarine habitats near the Gulf of Mexico. These ecosystems provide critical habitats for numerous plant and animal species, many of which are unique to the region. The Sabine River Watershed Map is a powerful tool for visualizing these ecosystems and understanding their interconnectedness.
Riparian zones along the Sabine River and its tributaries are home to a variety of wildlife, including river otters, alligators, and migratory birds. These zones also play a key role in stabilizing riverbanks, filtering pollutants, and maintaining water quality. The map highlights these riparian areas, showcasing their ecological importance and the need for targeted conservation efforts.
Wetlands within the watershed serve as natural sponges, absorbing floodwaters and filtering nutrients and sediments. They provide habitat for amphibians, fish, and waterfowl, while also supporting vital ecosystem services such as carbon storage and nutrient cycling. The map emphasizes the distribution of these wetlands, helping conservationists identify priority areas for protection and restoration.
In its lower reaches, the Sabine River transitions into estuarine ecosystems near Sabine Lake. These areas are nurseries for fish and shellfish, including species such as shrimp, blue crabs, and red drum. The map illustrates the connection between the river’s flow and these estuarine habitats, highlighting the importance of maintaining water quality and flow consistency to support coastal biodiversity.
Human Influence and Water Management in the Sabine River Watershed
The Sabine River Watershed has been shaped by human activity for centuries, from Indigenous land stewardship to modern agriculture, urbanization, and industrial use. These activities have created both opportunities and challenges, altering the watershed’s natural dynamics and raising questions about sustainability. The Sabine River Watershed Map provides a comprehensive view of these influences, helping stakeholders address critical management issues.
Agriculture is a dominant land use in the watershed, with crops such as rice, cotton, and soybeans grown throughout the region. Irrigation from the Sabine River and its tributaries is essential for sustaining these crops, but it also contributes to challenges such as nutrient runoff and habitat loss. The map identifies agricultural areas and their proximity to rivers and wetlands, offering insights into how farming practices affect water resources and ecosystem health.
Urban centers such as Longview, Texas, and Shreveport, Louisiana, add further complexity to the watershed. The map highlights these cities and their associated infrastructure, including stormwater systems, wastewater treatment plants, and industrial facilities. Understanding the relationship between urban development and the watershed’s hydrology is critical for reducing pollution and managing water sustainably.
Water allocation and rights within the Sabine River Watershed are also a major concern, particularly with the growing demands of agriculture, industry, and urban populations. The map serves as a visual tool for navigating these issues, helping stakeholders balance competing needs and develop equitable management strategies.