
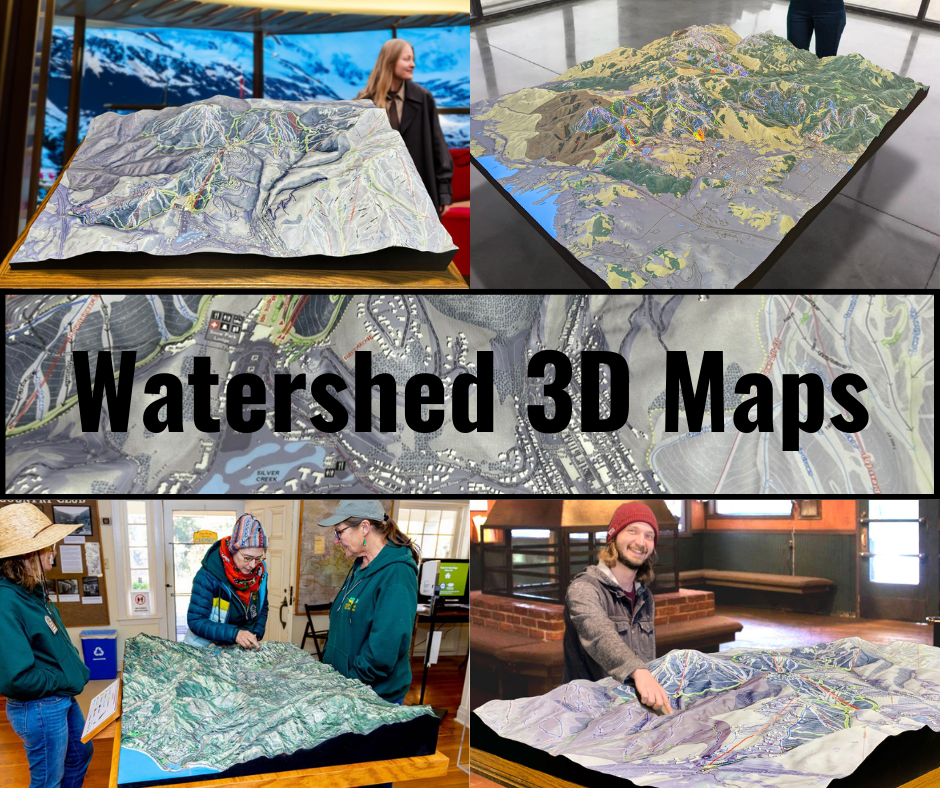
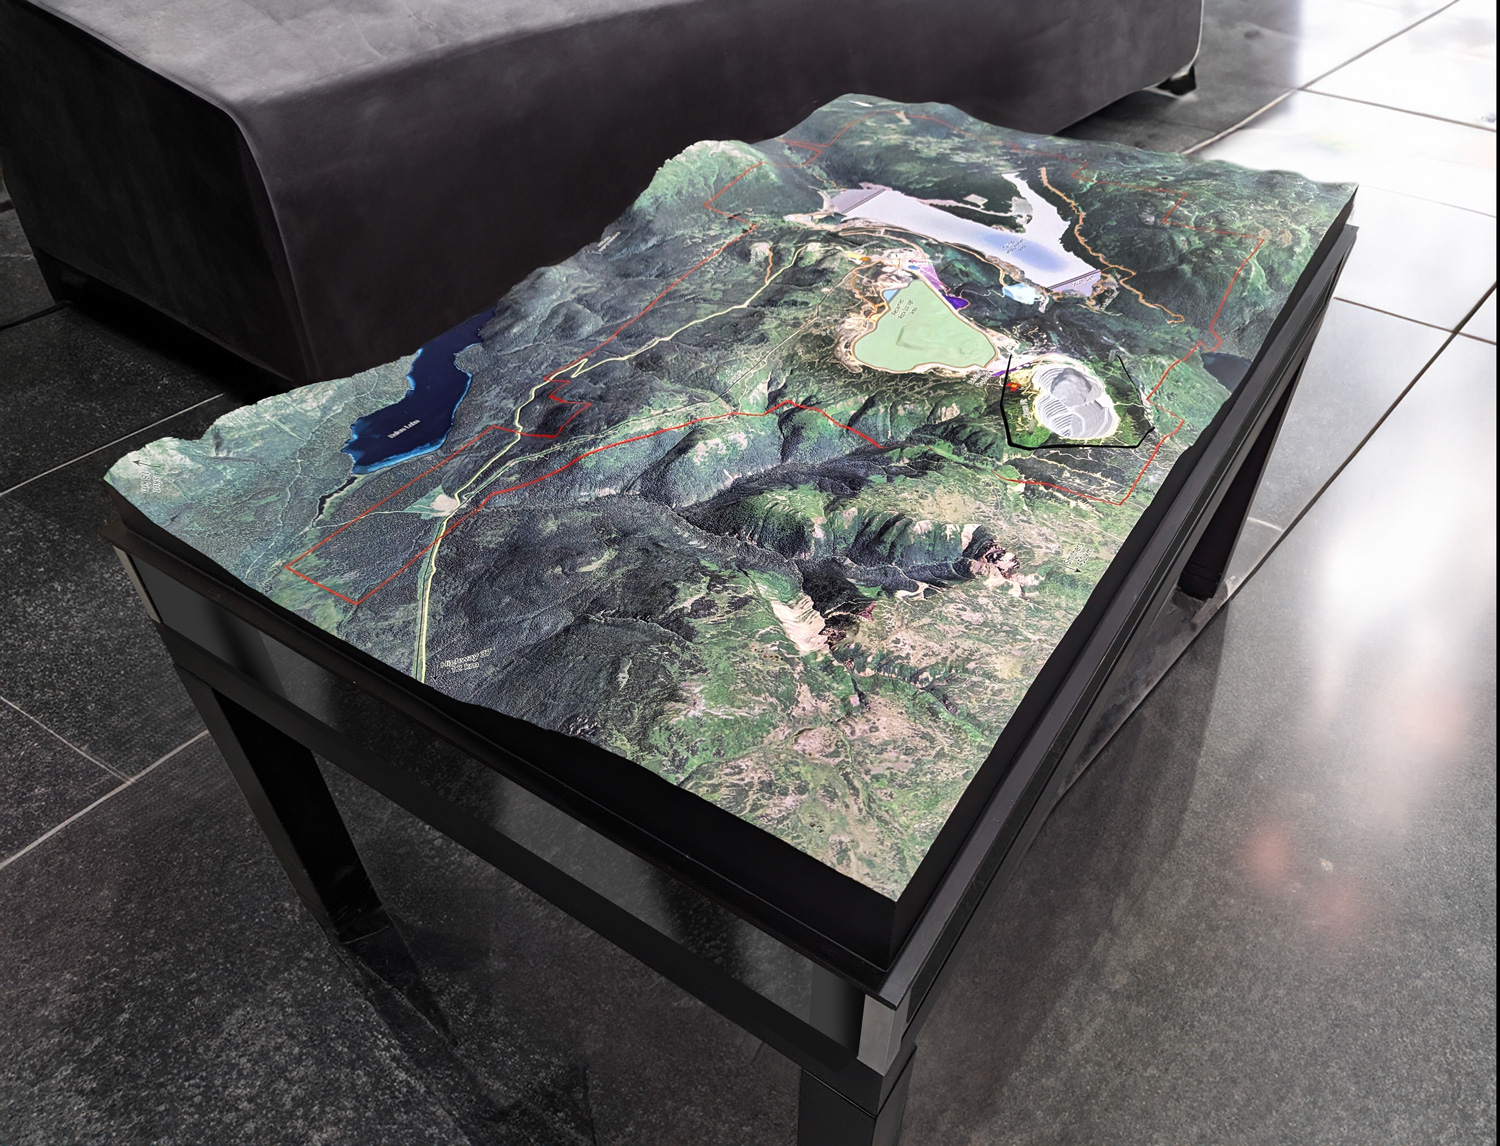
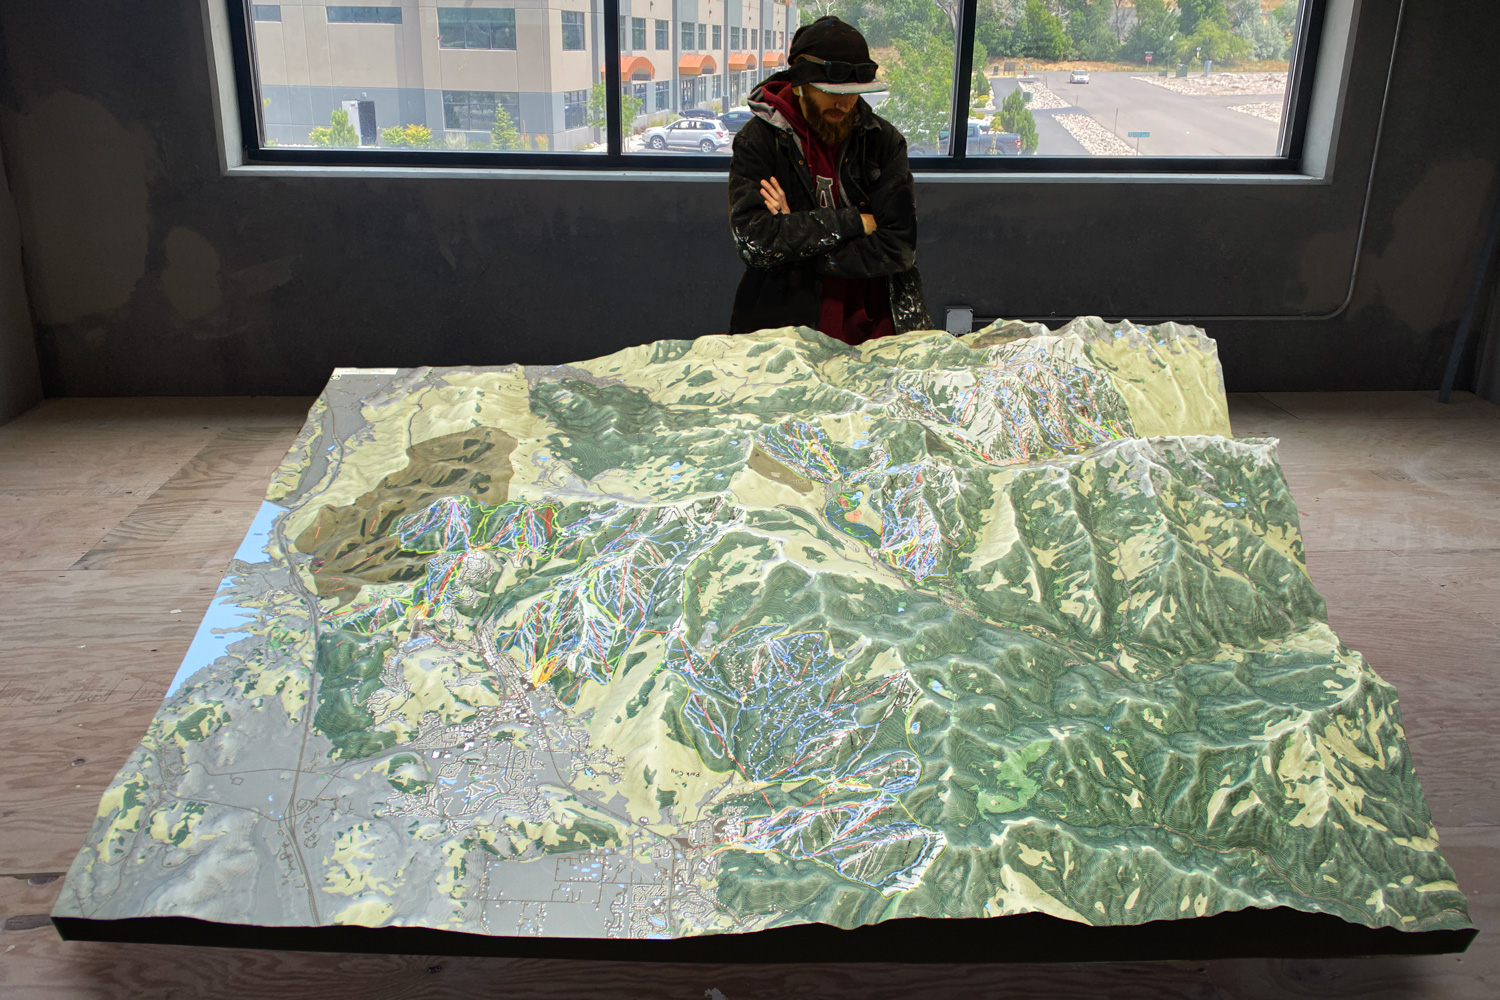
The Roaring Fork River Watershed Map: Discovering Colorado’s Mountain Oasis
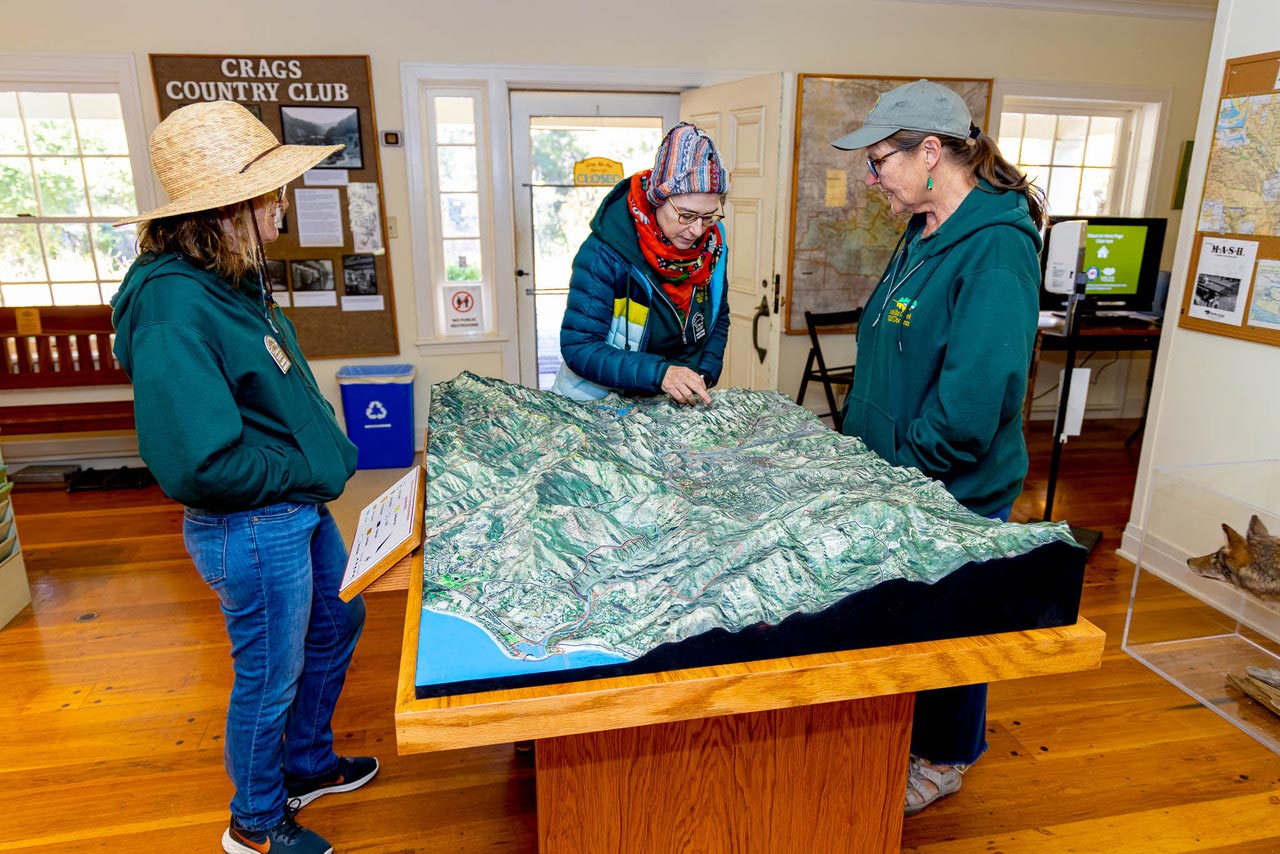
The Roaring Fork River Watershed is one of Colorado’s most stunning and vital hydrological systems, nestled in the heart of the Rocky Mountains. Covering approximately 1,451 square miles, the watershed encompasses diverse landscapes ranging from alpine meadows and glacial valleys to forested slopes and arid lowlands. Anchored by the Roaring Fork River, this watershed is a cornerstone of the region’s ecology, economy, and recreation. The Roaring Fork River Watershed Map offers a detailed perspective of this intricate network of rivers, streams, and tributaries, revealing its profound interconnectedness and ecological importance.
The Roaring Fork River originates in the high-altitude regions near Independence Pass and flows 70 miles through picturesque towns like Aspen, Carbondale, and Glenwood Springs before merging with the Colorado River. Along its journey, the river and its watershed provide vital water resources, habitat for diverse wildlife, and recreational opportunities that draw visitors from around the world. With innovations such as 3D watershed mapping, we can better understand and manage this remarkable system to ensure its health for generations to come.
Tracing the Roaring Fork River’s Path: Geography and Hydrology of the Watershed
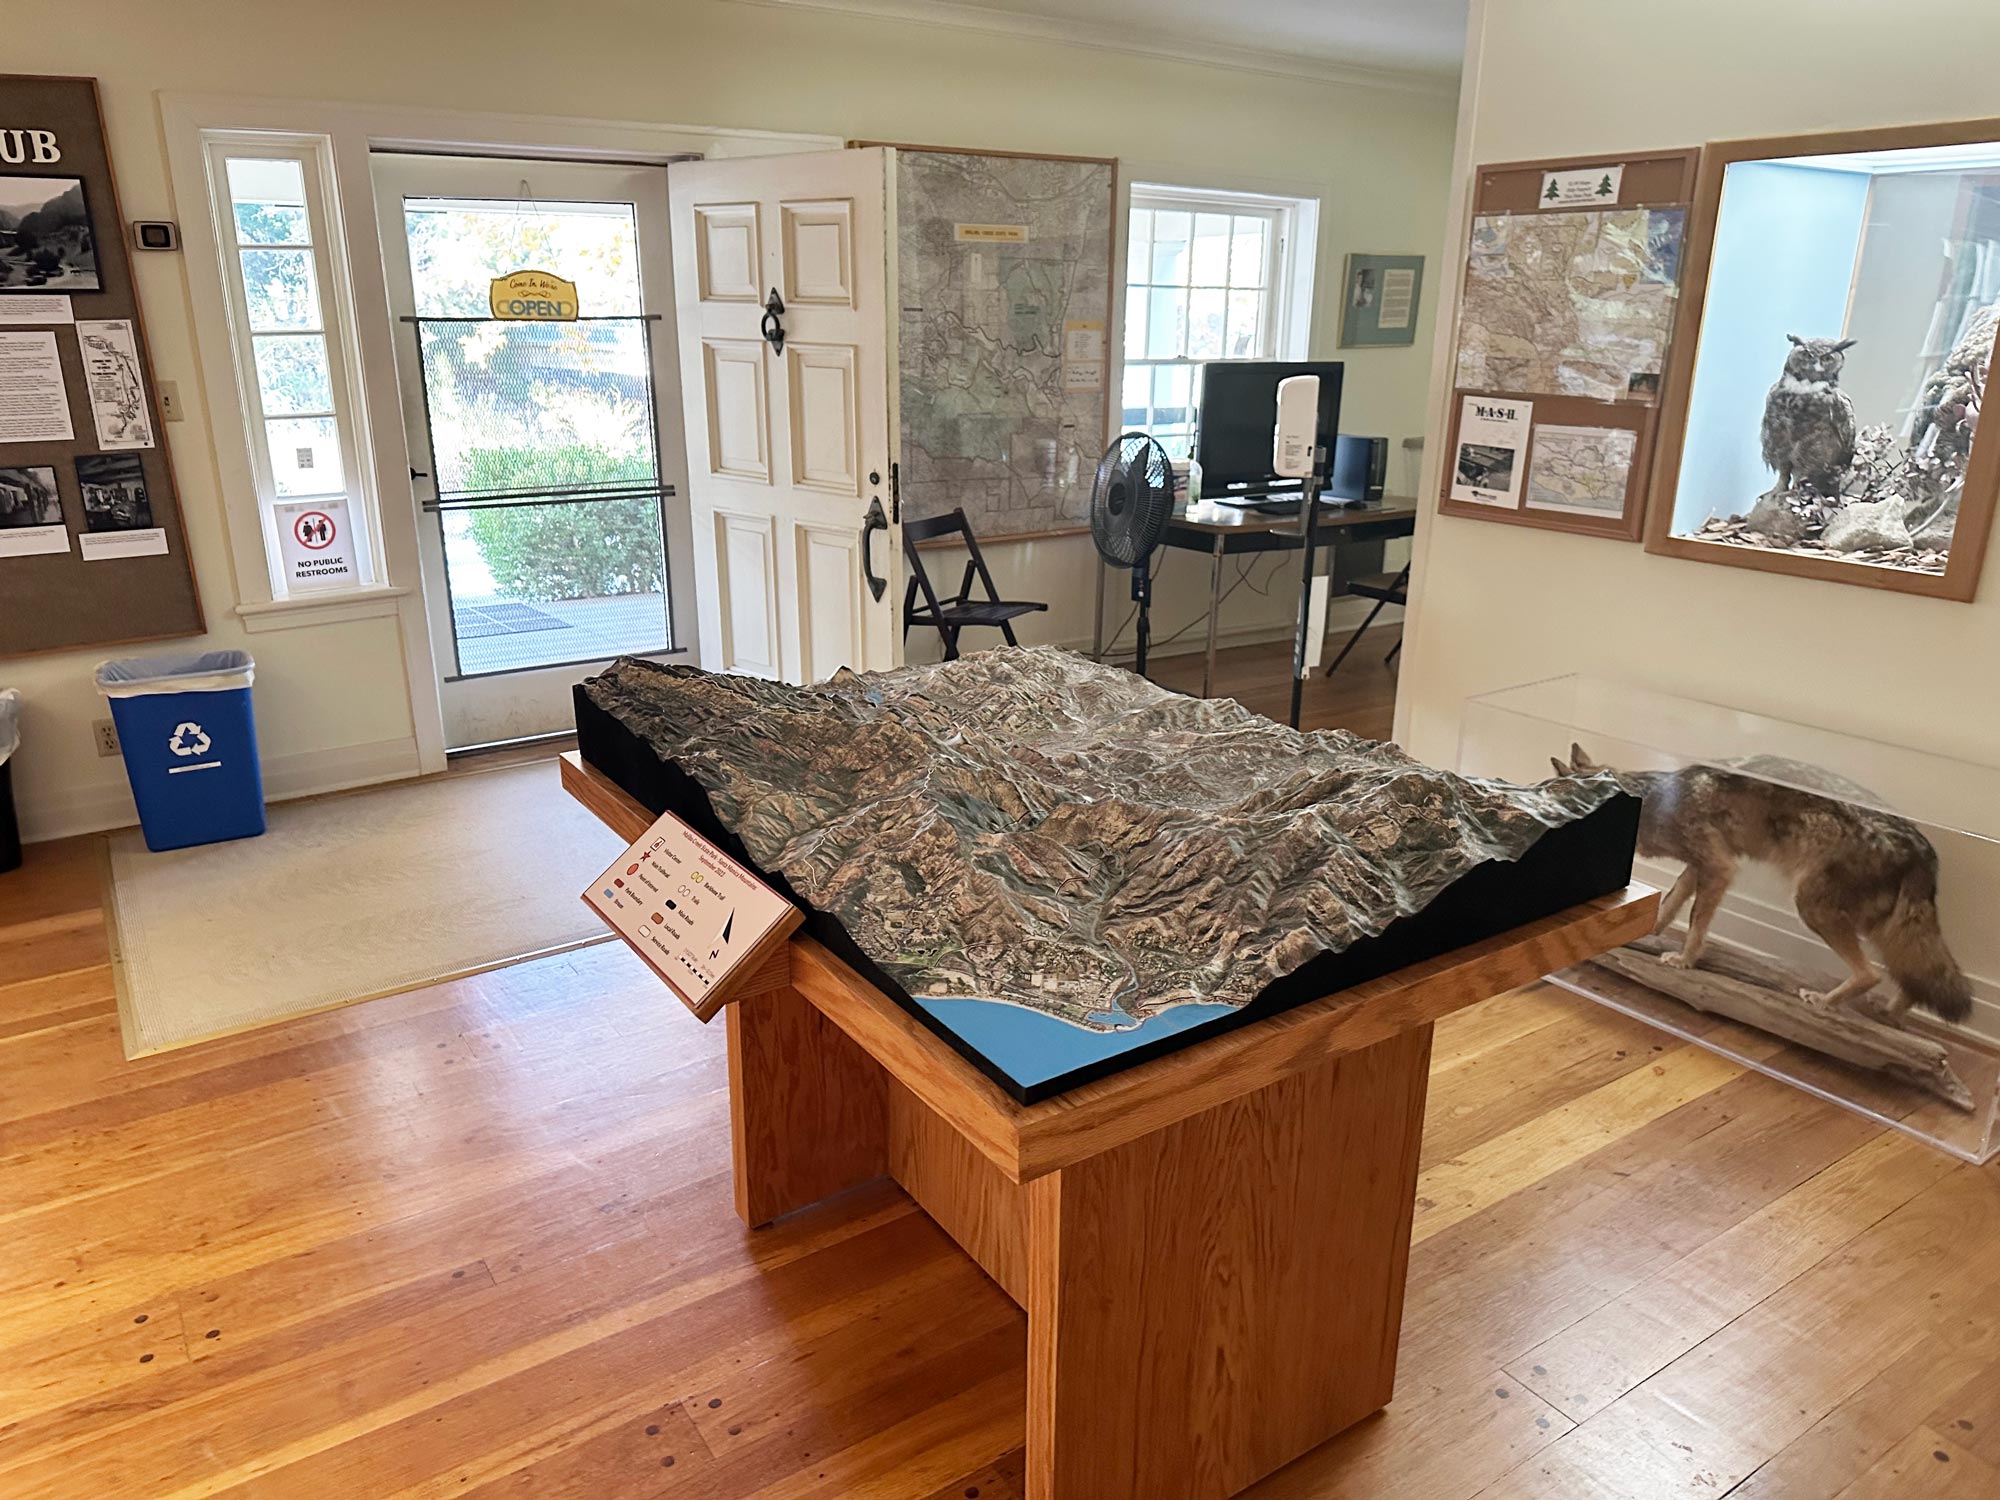
The Roaring Fork River begins at the Continental Divide near Independence Pass, where snowmelt and glacial runoff feed its headwaters. Flowing westward, the river cuts through rugged alpine terrain, descends into lush valleys, and eventually joins the Colorado River at Glenwood Springs. The Roaring Fork River Watershed Map captures this journey in exquisite detail, showcasing the river’s course and its major tributaries, including the Fryingpan River, Crystal River, and Maroon Creek.
The watershed’s geography is defined by dramatic contrasts, with elevations ranging from over 14,000 feet at the peaks of the Elk Mountains to 5,700 feet at its confluence with the Colorado River. These variations shape the river’s hydrology, influencing flow rates, sediment transport, and seasonal water levels. The map highlights these geographical features, providing a comprehensive view of the watershed’s natural dynamics.
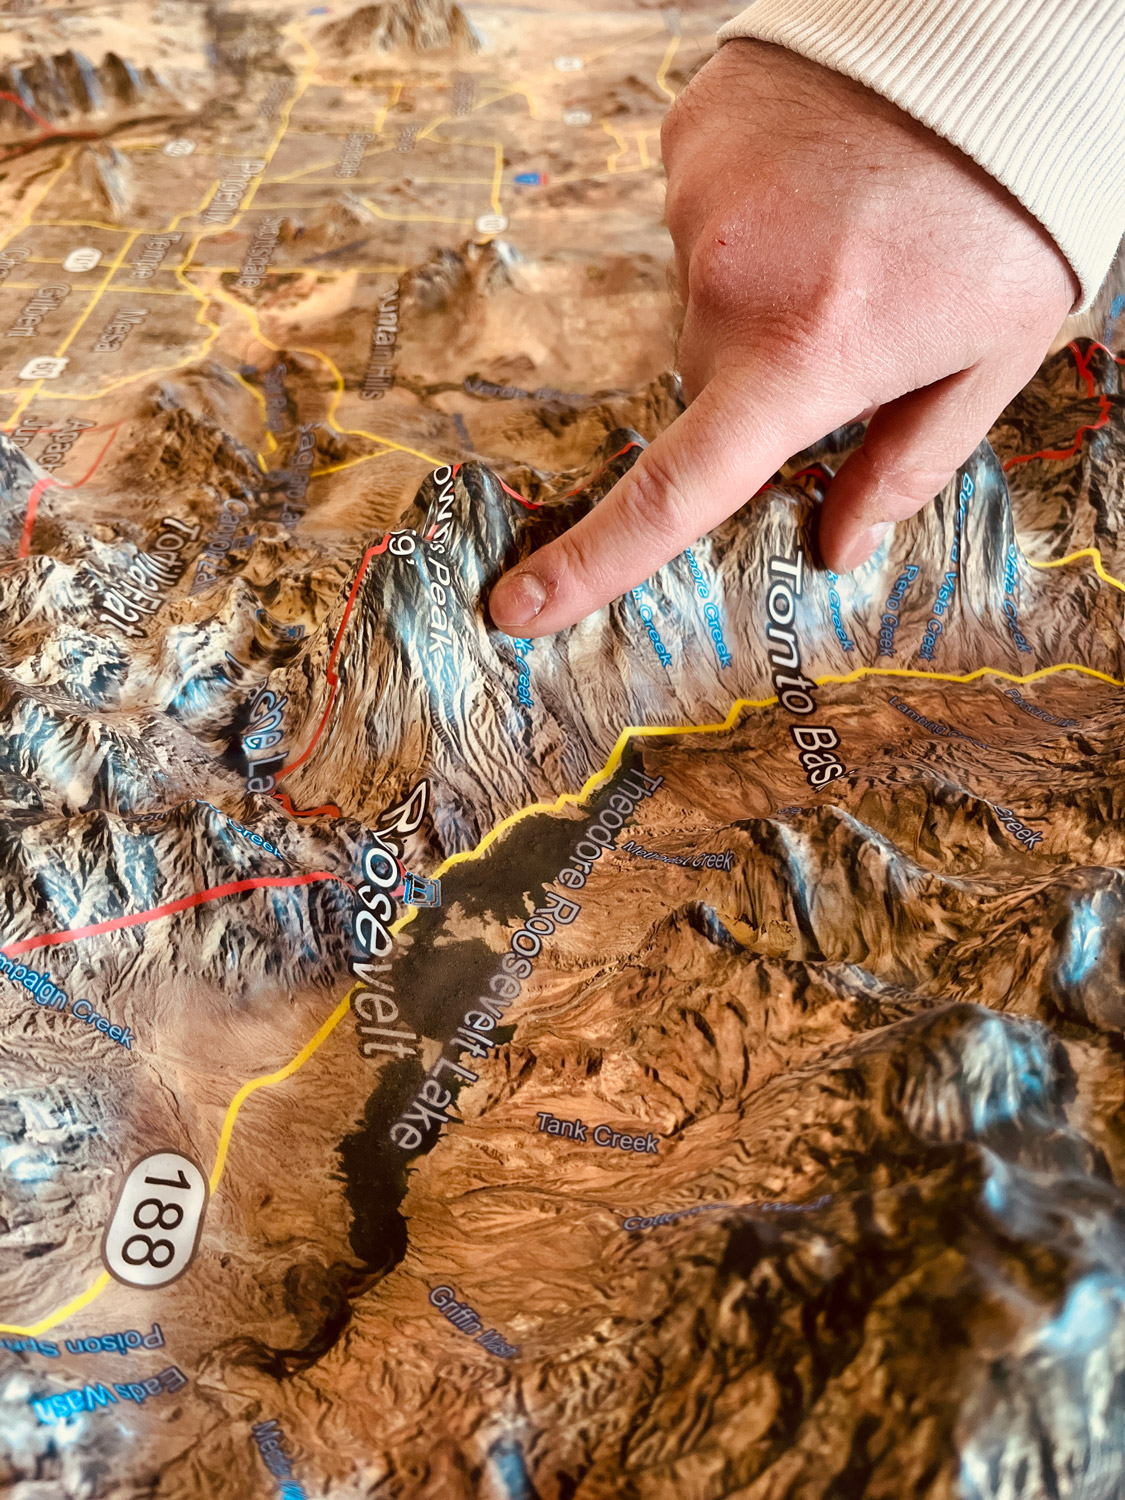
Reservoirs such as Ruedi Reservoir on the Fryingpan River play a crucial role in the watershed, supporting water storage, hydropower generation, and recreation. The Roaring Fork River Watershed Map integrates these reservoirs into the broader hydrological system, emphasizing their importance for regional water management and ecological balance.
Ecosystems and Biodiversity in the Roaring Fork River Watershed
The Roaring Fork River Watershed is a biodiversity hotspot, home to a wide range of ecosystems that include alpine tundra, riparian forests, wetlands, and sagebrush steppe. These habitats support a diverse array of plant and animal species, many of which are adapted to the region’s unique environmental conditions. The Roaring Fork River Watershed Map provides a detailed perspective on these ecosystems, illustrating their distribution and ecological significance.
Alpine zones in the upper reaches of the watershed, near the headwaters, are characterized by wildflower meadows, glacial lakes, and rocky outcrops. These areas provide habitat for species such as mountain goats, pika, and ptarmigan, as well as rare plants that thrive in harsh conditions. The map highlights these alpine habitats, showcasing their role in capturing snowmelt and sustaining downstream flows.
Riparian zones along the Roaring Fork River and its tributaries are vital for biodiversity, supporting species such as bald eagles, beavers, and cutthroat trout. These areas also stabilize riverbanks, filter sediments, and improve water quality. The map emphasizes these riparian habitats, illustrating their importance in maintaining ecological balance.
Wetlands within the watershed act as natural water filters and flood buffers, providing critical habitat for amphibians, waterfowl, and migratory birds. These wetlands also play a key role in carbon sequestration and nutrient cycling, contributing to the overall health of the watershed. The map highlights these wetlands, helping conservationists prioritize areas for restoration and protection.
Human Influence and Water Management in the Roaring Fork River Watershed
Human activity has significantly influenced the Roaring Fork River Watershed, from the land stewardship of Indigenous peoples to modern-day urban development, agriculture, and recreation. These interactions have shaped the watershed’s natural dynamics, creating both opportunities and challenges. The Roaring Fork River Watershed Map provides a comprehensive view of these influences, helping stakeholders address critical management issues.
Urban centers like Aspen, Basalt, and Carbondale have grown along the Roaring Fork River, contributing to the region’s economy and culture. The map highlights these towns and their associated infrastructure, including water treatment facilities, stormwater systems, and transportation networks. Understanding the relationship between urban development and the watershed’s hydrology is crucial for ensuring sustainable water use and reducing pollution.
Agriculture plays a significant role in the watershed, with irrigated fields of hay and alfalfa lining the river’s valleys. While agriculture is essential for the local economy, it also poses challenges such as nutrient runoff, soil erosion, and water diversion. The map identifies agricultural areas and their proximity to waterways, offering insights into how farming practices impact water quality and ecosystem health.
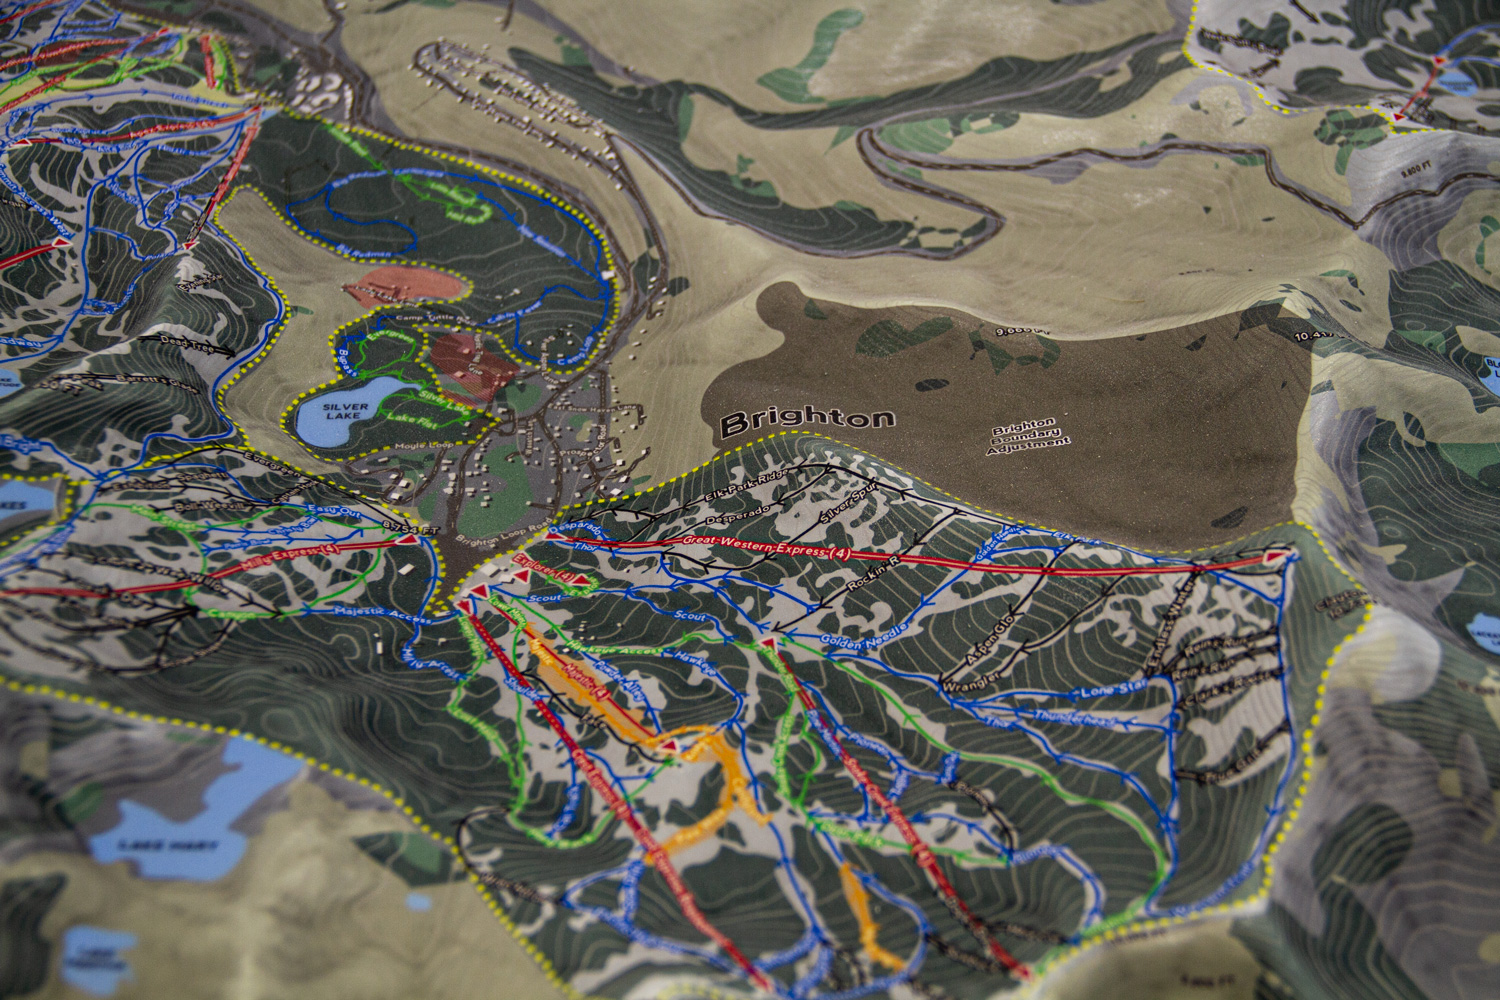
Recreation and tourism are major drivers of the region’s economy, with activities such as skiing, fishing, hiking, and rafting attracting visitors year-round. Popular destinations like Maroon Bells, Ruedi Reservoir, and Glenwood Canyon are featured on the map, emphasizing the need to balance human enjoyment with conservation efforts to protect the river’s natural beauty and resources.