 Map-main")
The Red River Watershed (North) Map: Understanding the Heart of the Great Plains
The Red River Watershed in the northern United States is an iconic hydrological system, spanning over 45,000 square miles across North Dakota, Minnesota, and Manitoba, Canada. As a vital resource for agriculture, wildlife, and communities, the Red River Watershed defines the landscape and livelihoods of the Great Plains. The Red River Watershed Map offers a comprehensive view of this complex and expansive system, showcasing its intricate network of rivers, floodplains, and wetlands while providing insights into the challenges and opportunities it presents.
Exploring the Red River Watershed Map is a journey into the hydrology, ecosystems, and human impact that shape this region. Coupled with advancements in cartographic technologies, including the creation of 3D watershed maps like those of the Green River, these tools help us dive deeper into understanding and managing the critical resources of this iconic watershed.
Tracing the Geography and Hydrology of the Red River Watershed
The Red River of the North originates at the confluence of the Bois de Sioux and Otter Tail Rivers in Breckenridge, Minnesota. From there, it flows northward into Canada, eventually emptying into Lake Winnipeg. This unusual northward flow sets the watershed apart, creating unique challenges such as ice jams during spring thaw and frequent flooding events.
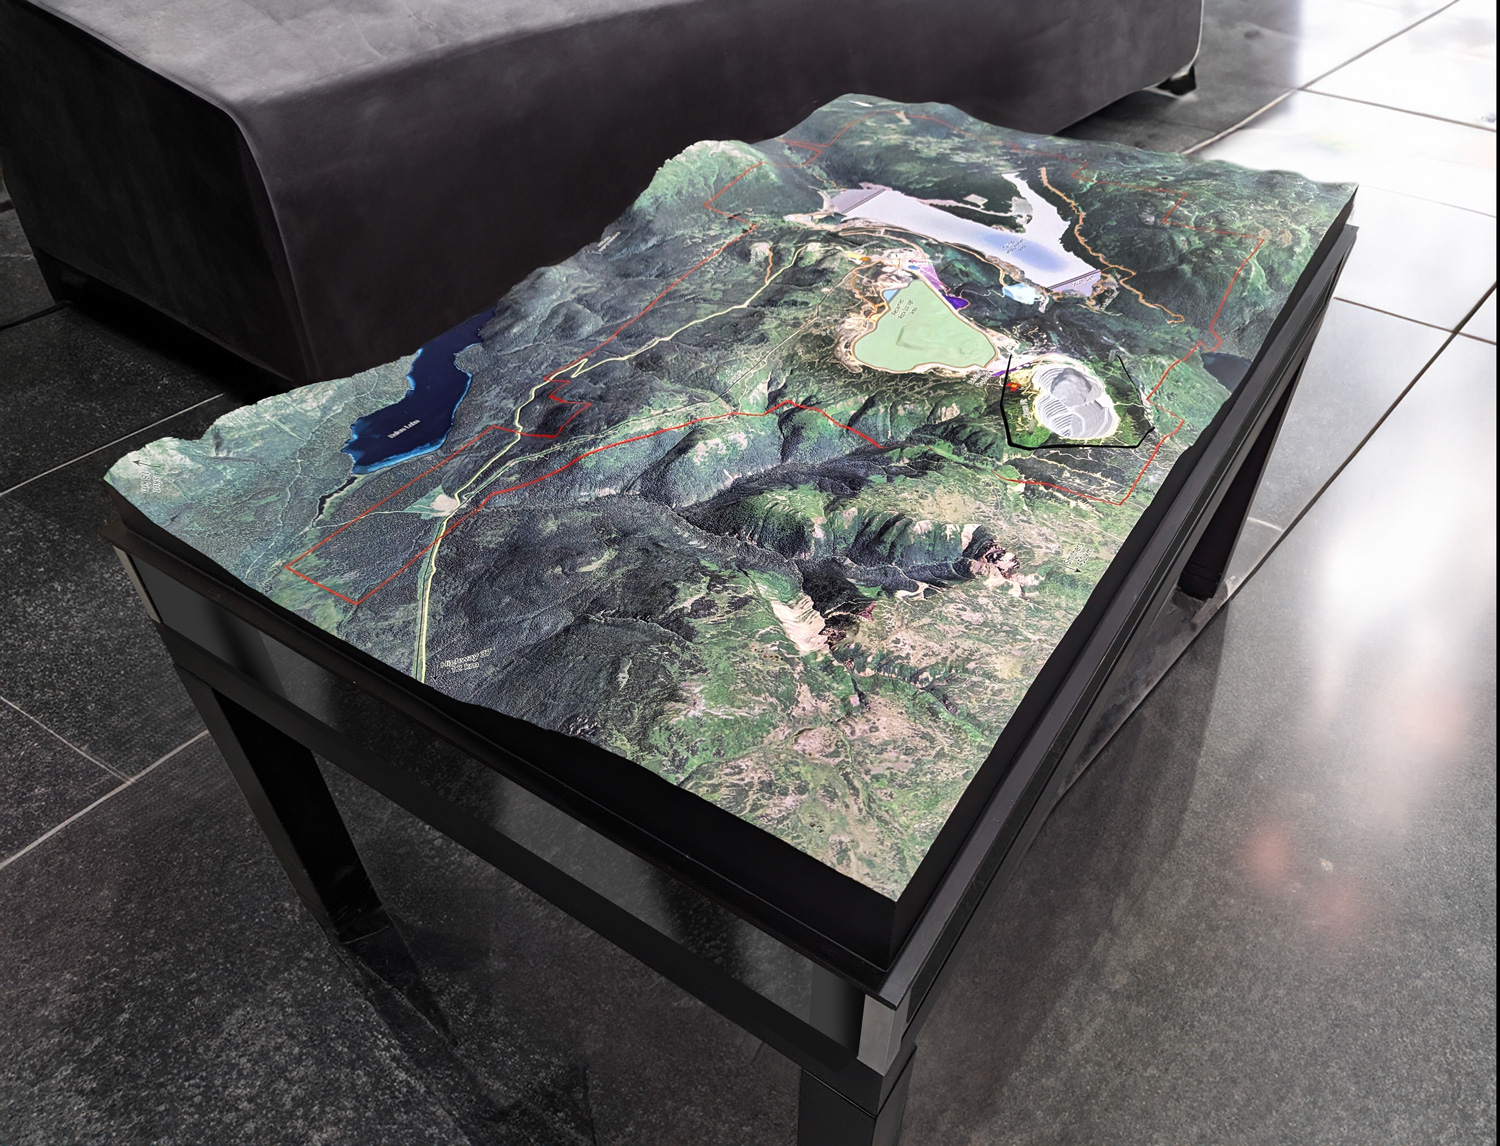
The Red River Watershed Map illustrates the river’s meandering path, highlighting its vast network of tributaries, including the Sheyenne, Pembina, and Wild Rice Rivers. These tributaries play critical roles in maintaining the hydrological balance of the watershed, contributing water and sediment while supporting diverse ecosystems. The map also showcases the watershed’s expansive floodplains, which are both a blessing and a challenge for the region.
Flooding is a defining characteristic of the Red River Watershed, driven by its flat topography and clay-rich soils. The map captures the scale of this phenomenon, detailing flood-prone areas and illustrating how water spreads across the landscape during high-flow events. This information is invaluable for flood management and mitigation efforts.
Ecosystems and Biodiversity Within the Red River Watershed
The Red River Watershed is home to a variety of ecosystems, from prairie grasslands to riparian forests and wetlands. These habitats support a wide array of plant and animal species, many of which are integral to the region’s ecological and economic health. The Red River Watershed Map is an essential tool for visualizing these ecosystems and understanding their interconnectedness.
Prairie wetlands are a hallmark of the watershed, providing critical habitat for migratory birds such as ducks, geese, and shorebirds. These wetlands also play a vital role in water filtration, flood control, and carbon storage. The map highlights the distribution of these wetlands, helping conservationists identify priority areas for protection and restoration.
Riparian forests along the Red River and its tributaries are another key feature of the watershed. These forests stabilize riverbanks, filter pollutants, and provide habitat for species such as beavers, herons, and bald eagles. The map showcases these riparian zones, emphasizing their importance in maintaining the watershed’s health.
The northern part of the watershed extends into the boreal forest region of Manitoba, where it transitions into a landscape dominated by coniferous trees and peatlands. This diversity of habitats underscores the ecological richness of the watershed, as well as the importance of preserving its integrity in the face of environmental pressures.
Human Influence and Water Management Challenges
Human activity has significantly shaped the Red River Watershed, from agricultural expansion to urban development and flood control infrastructure. The Red River Watershed Map provides a detailed view of these influences, highlighting both their benefits and their impacts on the system.
Agriculture dominates land use in the watershed, with vast fields of wheat, soybeans, and other crops stretching across its fertile plains. While agriculture drives the region’s economy, it also contributes to challenges such as nutrient runoff, soil erosion, and habitat loss. The map identifies agricultural areas and their proximity to rivers and wetlands, offering insights into how land use practices affect water quality and ecosystem health.
Urban areas, including Fargo, North Dakota, and Winnipeg, Manitoba, exert additional pressure on the watershed. The map highlights these population centers and their associated infrastructure, such as stormwater systems and wastewater treatment facilities. Understanding the interplay between urban development and the natural hydrology of the watershed is critical for sustainable planning.
Flood management is a major focus in the Red River Watershed, given its history of devastating floods. The map provides valuable information on flood-prone areas, levees, and retention basins, helping planners design strategies to reduce risk. It also highlights natural flood mitigation features, such as wetlands and floodplains, which can complement engineered solutions.