What Is a Geological Survey Map? An Exploration of the Earth Beneath Our Feet
When we look at a city skyline, a mountain range, or even our own backyard, it’s easy to focus only on what’s visible. But beneath every road, forest, and rooftop lies a secret world—an extraordinary landscape of rock layers, faults, minerals, and ancient history that shaped the very surface we walk on today. Geological survey maps act as the decoder ring for that hidden world. They are carefully crafted visual tools that reveal the composition, structure, and evolution of the Earth from ground level to deep underground. These maps aren’t just for scientists or hikers. They influence where we build homes, drill wells, place pipelines, mine resources, protect wildlife, and even where communities should avoid building due to landslide or earthquake risks. They merge science with artistry—color-coded palettes showing millions of years of change in a simplified, easy-to-read form. So, what exactly is a geological survey map, and why does it matter? Let’s dig deep.
The Definition: More Than Just “Rocks on a Map”
A geological survey map is a highly detailed document that illustrates the types, ages, and arrangements of rocks and sediments across a region. It captures not only what lies on the surface but also how layers tilt, fold, fracture, or dive beneath the earth. You’ll see boundaries where one type of rock transforms into another, alongside symbols representing fault lines, volcanic structures, and underground contacts.
At its core, it answers questions such as:
What is the land made of? How did it form? And how stable is it?
These maps typically come from national or regional geological surveys—organizations like the U.S. Geological Survey (USGS), Geological Survey of Canada (GSC), or British Geological Survey (BGS). Their teams venture into the field to analyze rock samples, study terrain, record data, and piece together clues like detectives solving a mystery millions of years in the making.
A Journey Through Time: The Story Rocks Tell
Geological maps are essentially time machines. They let us see how continents collided, volcanoes erupted, oceans vanished, or glaciers bulldozed entire landscapes. Every color on the map represents a rock formed at a certain point in Earth’s history. Soft blues may reveal marine sediments laid down when the region sat beneath an ancient ocean. Deep reds might mark hardened lava flows from long-dormant volcanoes. Light yellows can represent loose soils left behind by recent river deposits. Instead of reading a timeline left to right, you read a geological map across the land itself.
You’re not just looking at colored patches—you’re peering back hundreds of millions of years. A single boulder near your home might once have been buried in the heart of a mountain before erosion transported it downhill. An otherwise gentle hillside might be the top of a massive fault structure that once shook the region violently. Every line, label, and shade helps unravel Earth’s dramatic past.
The Science Behind the Map: Field Work Meets Technology
Creating a geological survey map is not as simple as flying a drone or looking at satellite imagery. It’s a blend of rugged exploration and cutting-edge tools.
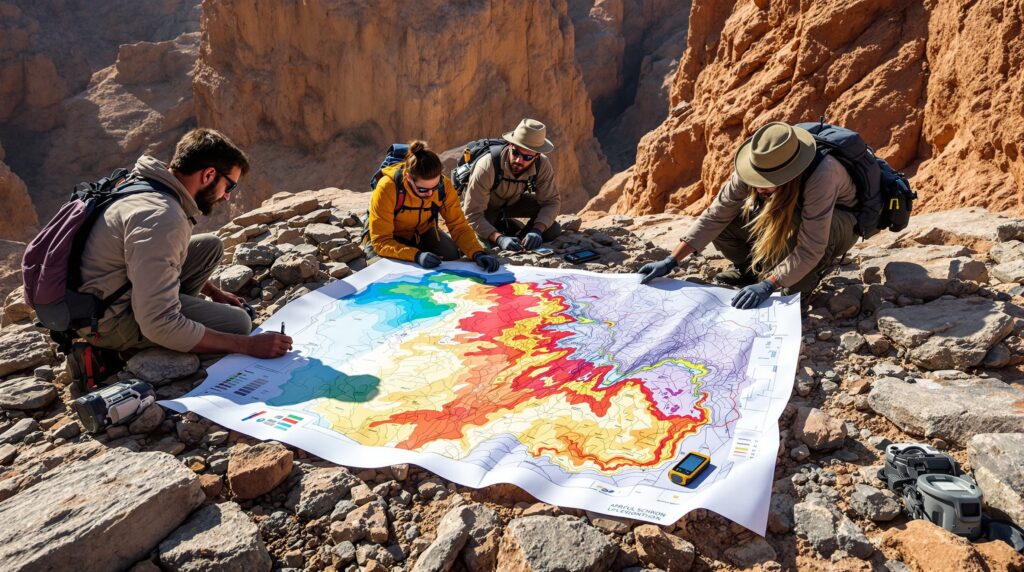
Geologists hike through cliffs, canyons, hillsides, and deserts to observe rock formations firsthand. They use specialized equipment—hammers, compasses, GPS units—to measure rock angles and orientations. They note where layers appear or disappear, sketching the puzzle on portable field maps covered in notations and dust.
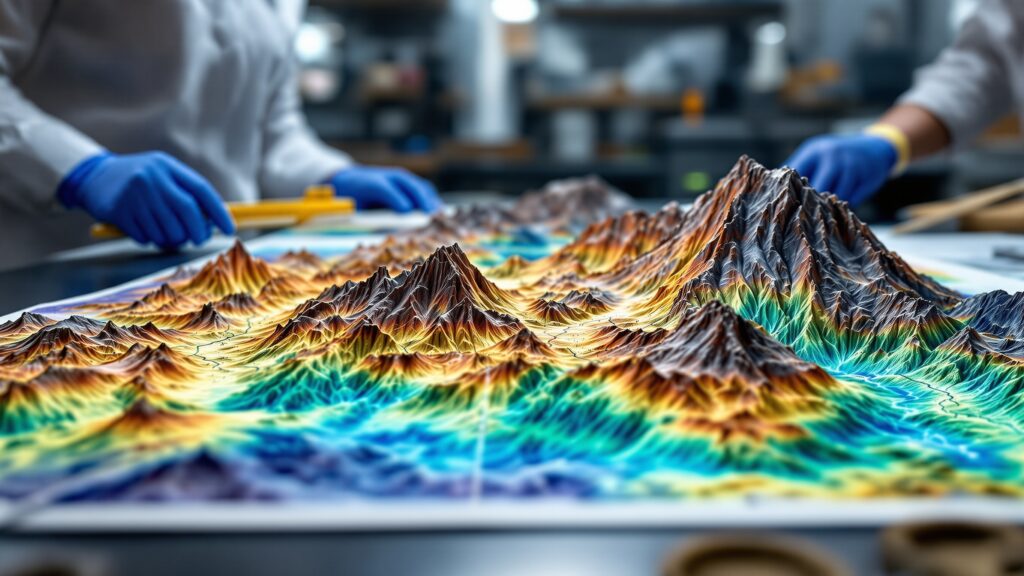
Once field data is collected, scientists combine it with laboratory results: microscopic mineral studies, chemical analyses, and dating techniques that determine rock age. Digital mapping technology and 3D modeling help refine the final visual output, connecting surface observations with underground structures that may never be directly seen. The result is a map that is both incredibly practical and deeply scientific.
What Do All Those Colors and Symbols Mean?
At first glance, geological survey maps can appear intimidating. They seem like a rainbow exploded onto a topographic map sprinkled with hieroglyphic-like symbols. But there’s a logical system behind the visual chaos.
Each color corresponds to a type of rock or sediment. Neighboring shades show how rocks vary over short distances. Letters and numbers represent geological periods or specific formations—like Cretaceous sandstone or Precambrian granite. Lines also tell powerful stories:
- Fault lines identify zones where the Earth has fractured and moved.
- Contacts mark transitions between rock layers.
- Strike and dip symbols show the angles at which rocks tilt underground.
- Folds represent bends created when forces squeezed the land like a compressed accordion.
Think of it as reading the Earth’s architectural blueprint. Once you know the legend, the language becomes thrillingly clear.
A Map With Real-World Impact
Geological survey maps are crucial across many industries and community planning efforts. Without them, civilization would make far more dangerous and costly mistakes.
Imagine constructing a neighborhood over a hidden earthquake fault or on land composed of unstable clay. Placing a factory atop a valuable groundwater aquifer might contaminate the region’s drinking supply. Mining companies rely on geological maps to locate minerals like gold, copper, and lithium—materials powering everything from phones to electric vehicles.
Civil engineers consult these maps to:
- Avoid landslides and sinkholes
- Identify stable construction zones
- Choose safe routes for railroads, highways, and pipelines
Environmental agencies and climate scientists rely on geological maps when studying erosion, flood risks, and coastal change. Every streetlight, bridge, and rooftop benefits from the knowledge hidden in these maps.
Natural Hazards: Predicting the Planet’s Next Move
The Earth is a restless place—faults slip, volcanoes erupt, slopes crumble. Geological survey maps help determine where disasters are more likely to occur. They show:
- Active and ancient fault traces
- Volcanic lava fields and ash deposits
- Unstable mountain slopes prone to avalanches
- Regions susceptible to liquefaction during earthquakes
Communities can use this information to guide growth instead of guessing blindly. A clear understanding of local geology can save lives. In an age of increasing environmental challenges, geological maps are more important than ever.
Finding Groundwater and Natural Resources
Freshwater doesn’t just float around waiting to be tapped—it hides in underground aquifers within porous rock and sediment. Geological survey maps help hydrologists locate these important reserves so wells can be placed effectively. They are also key tools in resource exploration, pinpointing where oil, gas, and critical minerals are locked within the Earth. From ancient coral reefs that turned into giant oil reservoirs to mountain belts rich in rare metals, geological maps mark humanity’s treasure spots. Our modern lifestyles depend on these discoveries.
A Tool for the Curious Explorer
You don’t need a geology degree to enjoy the wonders of a geological map. Hikers use them to explore scenic trails shaped by geological forces. Paleontologists use them to locate fossil-rich rock units. Amateur rockhounds use them to find crystals and unique minerals. Even if you’re simply fascinated by landscapes, geological survey maps unlock a more profound appreciation. You begin to see mountains not as monoliths but as uplifted relics of ancient seafloors. A dusty plateau becomes evidence of long-ago volcanic eruptions. That canyon wall becomes a chapter book revealing millennia of sediment layering. It’s like acquiring new vision—where the ground below isn’t just dirt, but a record of Earth evolving.
Geological Mapping Goes Digital: The Future of Earth Insights
Technology is redefining what geological survey maps can show. Augmented reality, 3D subterranean models, and interactive web mapping allow users to dive beneath the surface virtually.
Modern tools include:
- LIDAR that scans terrain forms through vegetation
- Seismic imaging to visualize deep rock structures
- Remote sensing from satellites or drones
- Geospatial software to analyze massive datasets
The result: maps that update faster, reach more people, and offer unprecedented detail.
Soon, we may hold holographic maps that display real-time Earth movement or simulate how a region would react to a major quake. The map is becoming not just a record but a prediction engine.
Educational Power: Teaching Earth’s Story
Classrooms use geological maps to make geology exciting, transforming textbook diagrams into real-world examples. They give students a tactile understanding of Earth’s processes—something far more immersive than a lecture alone. When young learners see a large, color-splashed map, they discover the excitement of science mixed with geography, art, and storytelling. It may even inspire careers in environmental protection, engineering, planetary science, or archaeology. It’s hard not to get swept up in the detective work of uncovering what shaped the land around us.
Why Geological Maps Matter—Locally and Globally
Every inch of Earth has a story. A geological survey map gives that story shape and meaning. It empowers safer development, smarter environmental protection, stronger resource management, and a deeper understanding of nature’s ongoing evolution.
Whether you’re planning a city or planning a hike, this map ensures we live in harmony with the ground beneath us. It’s a reminder that Earth isn’t static. It’s active, alive, and always changing—just often too slowly for our eyes to see. Geological maps rekindle that awareness. They show us not only where we stand but how this land came to be—and where it might be headed. A world full of mystery emerges the moment you look beneath the surface.