When Land Meets Water: The Hidden Stories Beneath Our Feet
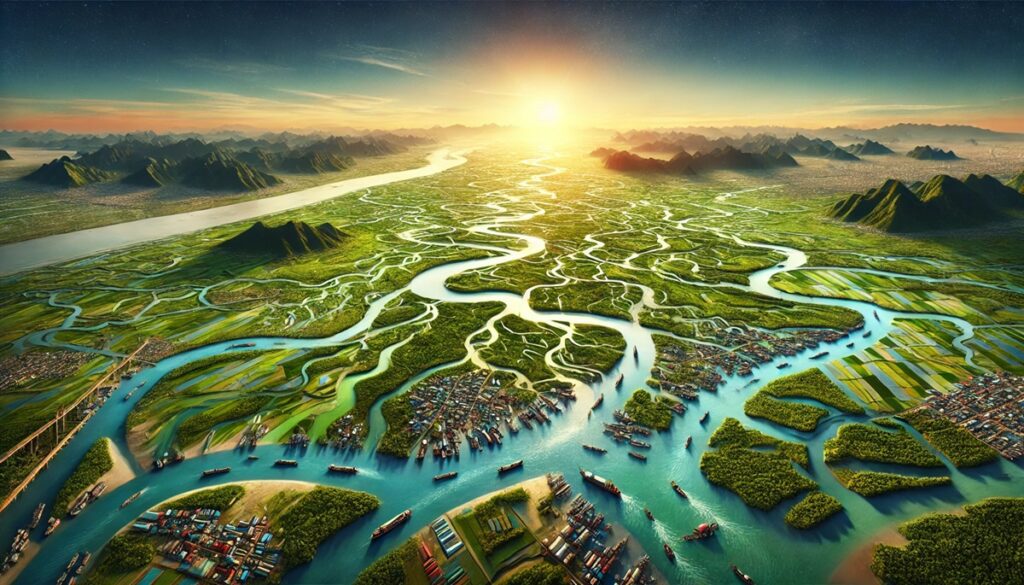
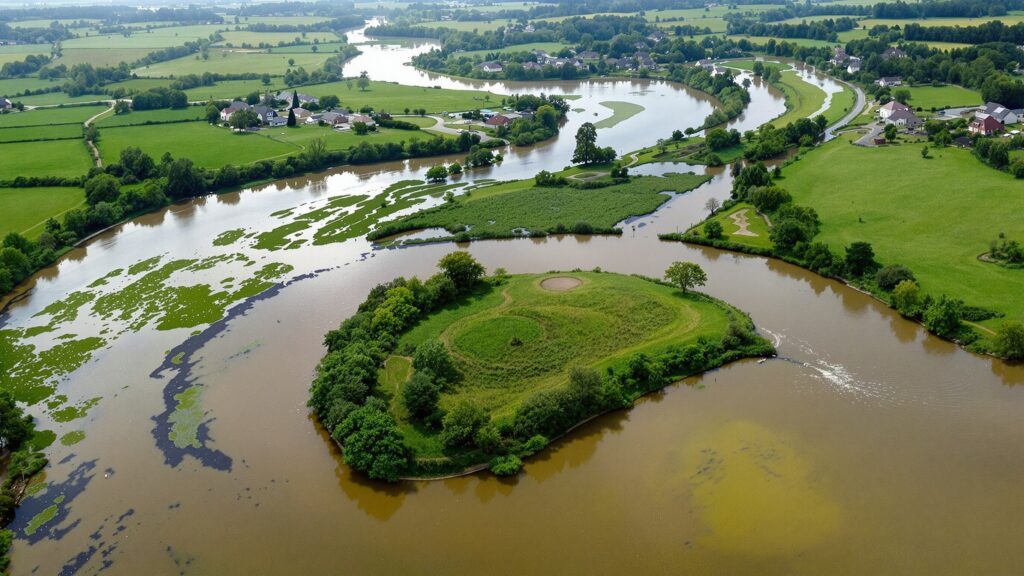
Picture a river winding lazily through a valley, glinting in the afternoon sun. On calm days, it looks peaceful—almost timeless. But when heavy rains pour and snow melts upstream, that same gentle river can surge to life, spilling across its banks and reshaping the land. Those flooded areas aren’t random—they follow invisible patterns, ancient pathways carved by nature and time. And that’s where floodplain maps come in. A floodplain map is the key to understanding the silent dance between water and land. It’s a tool that reveals where floods have been, where they’re likely to go, and how communities can prepare for them. Beyond the technical lines and shaded zones, floodplain maps tell one of the most powerful stories on Earth: the story of resilience, risk, and how humans learn to live alongside water. Let’s dive in—figuratively, of course—and explore what floodplain maps really are, how they’re made, and why they matter more today than ever before.

The Basics: What Exactly Is a Floodplain Map?
At its core, a floodplain map is a visual representation that identifies areas vulnerable to flooding. It shows how water moves across land during heavy rainfall, river overflow, storm surges, or even snowmelt. Think of it as a weather forecast made permanent—a picture of what could happen, not just what has. Floodplain maps highlight the regions adjacent to rivers, lakes, and coastal zones that are prone to inundation. These maps are crucial for urban planners, engineers, homeowners, and emergency managers alike. They inform building codes, insurance requirements, and community preparedness strategies.
In the United States, the most recognized versions are FEMA Flood Insurance Rate Maps (FIRMs). These official maps, created by the Federal Emergency Management Agency, classify land into different flood risk categories—like high-risk “100-year flood zones” and moderate- or low-risk areas. But no matter where they’re made, all floodplain maps share a common purpose: to help people understand where water wants to go, and how to stay safely out of its path.
The Anatomy of a Floodplain Map
A floodplain map isn’t just a random collection of blue lines and shaded patches—it’s a masterpiece of science, data, and history combined. Every symbol tells part of the hydrological story.
The base map usually shows familiar features: roads, property boundaries, rivers, and elevation contours. Layered on top are flood zones, color-coded areas that show varying degrees of flood risk. You’ll often see terms like:
- Zone AE or A: Areas with a 1% annual chance of flooding (often referred to as the 100-year flood zone).
- Zone X (shaded or unshaded): Areas with moderate or minimal flood risk.
- Zone VE: Coastal regions vulnerable to storm surges and wave action.
In addition to flood zones, these maps may display Base Flood Elevations (BFEs)—the expected height floodwaters could reach during a major event. Some maps include floodways, which mark the natural flow paths that carry the bulk of floodwaters downstream. When you look at a floodplain map, you’re essentially seeing a forecast in layers—a blend of history, topography, and mathematical probability, condensed into one sheet of vital information.
The Science Behind the Map: How Floodplains Are Mapped
Creating a floodplain map is a scientific journey involving hydrology, meteorology, and advanced modeling. It starts with understanding rainfall patterns, river flow rates, land elevation, and soil characteristics.
Scientists use LiDAR (Light Detection and Ranging) to capture highly accurate elevation data from aircraft or drones. They analyze how water would flow across those surfaces under various rainfall scenarios. Then, using hydraulic models, they simulate how rivers rise, overflow, and disperse over the landscape.
Historical data—like past flood events, stream gauge readings, and satellite imagery—also play a major role. The goal is not just to map where floods have happened, but where they’re likely to occur again.
The result is a detailed representation that predicts flood behavior under different conditions, allowing cities and citizens to make informed choices. It’s like giving the land a voice, translating the patterns of water into a language humans can understand.
The Purpose: Why Floodplain Maps Are So Important
Floodplain maps aren’t just for scientists—they shape real-world decisions every day. They’re used to determine building permits, guide infrastructure design, and set property insurance rates.
- For homeowners, a floodplain map can mean the difference between being required to purchase flood insurance or not. Lenders often rely on FEMA maps to assess risk before approving mortgages. Developers use them to decide where to safely build neighborhoods or businesses.
- For governments, floodplain maps guide zoning laws and emergency planning. They help cities plan stormwater systems, construct levees, and design evacuation routes.
Most importantly, they save lives. By clearly showing where floodwaters could reach, these maps allow communities to prepare—before disaster strikes. In short, a floodplain map is part science, part safety net. It’s a blueprint for coexistence between civilization and nature’s most powerful force: water.
The Evolution of Floodplain Mapping: From Paper to Pixels
Floodplain mapping has come a long way from hand-drawn charts and surveyor’s notes. In the early 20th century, flood risk was often estimated based on anecdotal evidence—“where the river reached last time.” But as flooding became more costly and urbanization expanded into vulnerable areas, the need for accurate data grew urgent.
In 1968, the U.S. launched the National Flood Insurance Program (NFIP), requiring precise flood maps to determine insurance rates. Early FEMA maps were paper-based, printed in black and blue lines, and distributed to local governments.
Fast forward to today, and floodplain maps are digital, interactive, and constantly evolving. Online tools like FEMA’s Flood Map Service Center allow anyone to search their address and instantly view flood zones. Geographic Information Systems (GIS) now enable multi-layer mapping, combining topography, weather patterns, and urban infrastructure into dynamic visualizations.
Modern maps even integrate climate change projections, accounting for sea-level rise, increased rainfall, and more frequent storms. What was once static is now predictive—a living map that grows and adapts as our planet changes.
Floodplain Maps and the Insurance Connection
If you’ve ever wondered why your neighbor pays higher flood insurance than you do, look no further than the floodplain map. Under the NFIP, properties within designated high-risk zones (those with a 1% or greater annual chance of flooding) are typically required to carry flood insurance if they have a federally backed mortgage. Homeowners outside those zones may not be required to—but that doesn’t mean they’re immune to risk.
In fact, about 25% of all flood claims come from areas outside officially mapped high-risk zones. This statistic underscores how vital it is for everyone—not just those in shaded areas—to understand their map and local flood dynamics.
Floodplain maps also influence floodplain management regulations, determining where new development can occur and under what conditions. These measures help communities qualify for federal disaster aid and maintain affordable insurance rates. Your address on a floodplain map doesn’t just shape your property’s insurance—it shapes your community’s resilience.
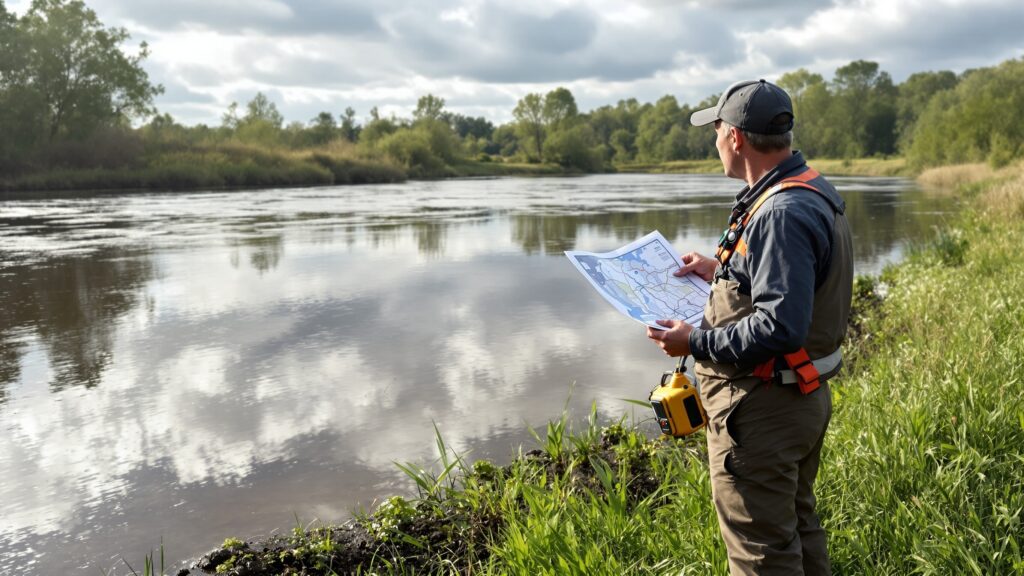
Reading a Floodplain Map: Turning Data Into Understanding
At first glance, a floodplain map might look overwhelming—lines, symbols, numbers—but once you learn the basics, it becomes a powerful storytelling tool.
- Start with orientation. Identify your location, major rivers, and the direction of flow. The shaded zones show where floodwaters are likely to spread. If your property lies in a darker shade, that indicates a higher risk.
- Pay attention to Base Flood Elevation numbers. These tell you the height floodwaters are projected to reach during a 100-year flood event. Knowing whether your home sits above or below that elevation helps you understand your vulnerability.
- Look for floodways—these are the natural channels that carry most of a river’s flood flow. Building in these areas is typically restricted to avoid blocking water movement.
Once you can “read” the map, it feels less like a chart and more like a dialogue between you and the landscape—a conversation that can protect your property, your family, and your peace of mind.
The Role of Floodplain Maps in Urban Planning
For cities and towns, floodplain maps are foundational tools for sustainable growth. They help urban planners make decisions that balance progress with protection. Before approving new developments, planners use these maps to identify flood-prone zones. They can then design green infrastructure—like retention ponds, wetlands, and permeable pavements—that help absorb runoff instead of channeling it into overburdened rivers.
Floodplain maps also inform the design of levees, dams, and storm drains, ensuring these structures align with the land’s natural drainage systems. In coastal cities, they guide the placement of sea walls and surge barriers. In essence, floodplain maps act as the conscience of urban design—a constant reminder that every street, bridge, and home must coexist with the forces of nature.
Floodplain Maps and Climate Change
As global temperatures rise, the importance of floodplain maps grows exponentially. Climate change is rewriting the rules of rainfall, snowmelt, and storm intensity. Areas once considered “safe” are now experiencing floods once thought impossible.
Modern floodplain maps incorporate climate resilience modeling—predicting how future sea-level rise, shifting precipitation patterns, and stronger hurricanes will reshape flood zones. This forward-looking approach is critical for long-term planning and infrastructure investment.
For example, coastal floodplain maps now project storm surge scenarios decades into the future, helping cities plan for higher tides and more frequent flooding. Inland, maps increasingly factor in flash floods from intense storms that overwhelm drainage systems. By integrating climate science into cartography, today’s floodplain maps are more than snapshots of risk—they’re windows into our planet’s hydrological future.
The Human Side of Floodplain Mapping
Every floodplain map is more than data—it’s a story of people and place. It reveals which communities live closest to risk and highlights the social and economic implications of geography. In many regions, floodplains have historically attracted settlement because they offer fertile soil, flat land, and access to water. Over time, however, those same advantages have turned into vulnerabilities. As cities expanded, natural floodplains were paved over, reducing the land’s ability to absorb water and increasing runoff.
Modern floodplain mapping helps communities rethink their relationship with these environments. It encourages relocation from high-risk areas, restoration of natural wetlands, and smarter design for those who stay. At its heart, mapping is empathy in action—it helps humans see not just the risk, but the shared responsibility of living with water.
Technology and the Future of Flood Mapping
The future of floodplain mapping is dazzlingly high-tech. Artificial intelligence and machine learning are now being used to predict flood behavior with unprecedented accuracy.
- Satellite imagery from NASA and the European Space Agency continuously tracks water movement across continents. Drones can survey flooded zones within hours of a storm, updating maps in real time.
- New global initiatives are creating open-source flood mapping systems, allowing developing countries to access vital risk data for the first time. Combined with cloud computing and crowdsourced local data, flood maps are becoming faster, more detailed, and more democratic.
Imagine holding an augmented reality device that overlays flood risk zones directly onto the landscape as you walk—showing you, in real time, how water might flow during a storm. That’s not science fiction; it’s the next step in making flood awareness accessible to all.

Floodplain Maps as Tools for Hope
Though floodplain maps often depict danger, they’re ultimately tools of hope. They empower communities to prepare, adapt, and thrive.
When local officials use them to create early warning systems, lives are saved. When architects reference them to elevate homes, properties endure. When citizens understand them, neighborhoods become safer.
These maps transform fear into foresight. They turn the unpredictable chaos of floods into manageable information. Each line and shaded contour represents not just risk, but knowledge—and knowledge is the foundation of resilience.
The Personal Connection: Why Floodplain Maps Affect Everyone
Even if you’ve never lived near a river or coast, floodplain maps affect you. They influence insurance rates, disaster response costs, and the way your city plans for growth. They remind us that water connects everything. A storm in one region can trigger flooding downstream, affecting communities hundreds of miles away. Understanding floodplains isn’t just about protecting property—it’s about respecting the natural systems that sustain us all.
So, whether you’re a homeowner checking your risk zone, an urban planner designing a park, or a student learning about hydrology, floodplain maps offer something universal: perspective. They teach us that the boundary between land and water is never fixed—it’s fluid, alive, and deserving of our respect.
Reading the Lines of the Future
So, what is a floodplain map? It’s a portrait of possibility—a meeting point between nature’s rhythm and human foresight. It blends science, art, and geography to tell a story as old as rivers themselves: water will always find its way. When we learn to read these maps, we’re not just decoding data; we’re learning to live in harmony with the elements. We’re acknowledging that safety begins with understanding, and that the future depends on how we interpret the past. A floodplain map doesn’t just show where floods might occur—it shows where wisdom begins. Because in the end, every blue line is a reminder: the land remembers, the water remembers, and it’s up to us to listen.