
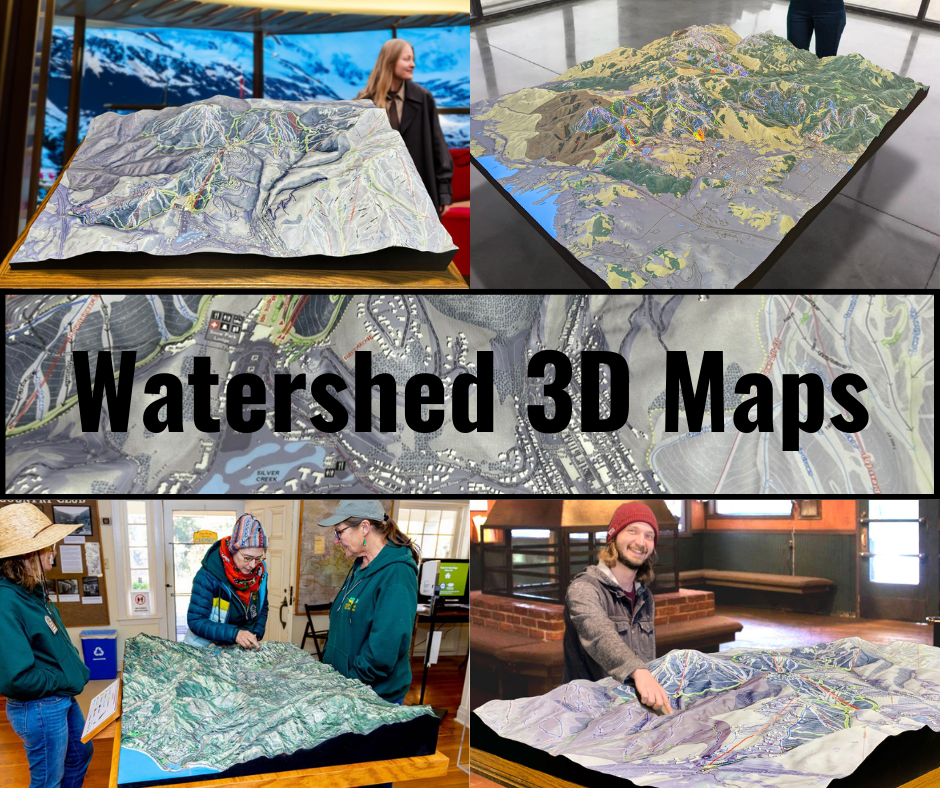
The Tombigbee River Watershed Map: A Vital Waterway of the American South
The Tombigbee River Watershed is one of the most important and ecologically significant regions in the southeastern United States. Spanning approximately 44,000 square miles across Mississippi, Alabama, and Tennessee, this watershed is a crucial part of the greater Mobile River Basin, which eventually empties into the Gulf of Mexico. The Tombigbee River itself is a key waterway that plays a central role in the region’s hydrology, ecology, and human development. The Tombigbee River Watershed Map serves as an essential tool for understanding the complex interactions between this river system, the surrounding landscapes, and the communities that rely on its resources.
The Tombigbee River has a rich history, both natural and human, which has shaped the region into what it is today. The river begins in the Appalachian foothills of Alabama and flows southward, winding through fertile plains and lowlands before joining the Alabama River. Along the way, it provides essential water resources for agriculture, industry, and recreation, while also supporting a wealth of biodiversity. The map of the Tombigbee River Watershed is a powerful resource that captures the river’s path, the surrounding ecosystems, and the human impact on this vital waterway.
Tracing the Tombigbee River’s Path: Geography and Hydrology of the Watershed
The Tombigbee River originates in the Appalachian foothills of northeastern Mississippi, where a network of tributaries converges to form the river. From there, it flows southward, winding through the rolling hills of Alabama before merging with the Alabama River to create the Mobile River, which eventually drains into the Gulf of Mexico. The Tombigbee River Watershed Map meticulously traces the course of the river, its major tributaries, and the landforms that influence its flow.
Geographically, the Tombigbee River Watershed is incredibly diverse. The upper reaches of the watershed are dominated by the hilly, forested terrain of the Appalachian foothills. These areas are characterized by steep slopes and rapid water flow, which contribute to the river’s high-energy environment. As the river moves downstream, it passes through a mix of gently sloping plains, wetlands, and floodplains, creating a more tranquil and meandering flow. The map illustrates these changes in topography, showing how the river’s course is shaped by both natural and human influences.
The hydrology of the Tombigbee River Watershed is primarily driven by precipitation patterns, with most of the rain falling in the winter and early spring. During these wetter months, the river swells, feeding wetlands, tributaries, and lakes that provide critical habitats for wildlife. In the summer and fall, the river’s flow slows as the rains decrease, and the river level drops, exposing sandbars and creating conditions ideal for fish spawning. The map provides valuable insights into how these seasonal variations affect the river’s dynamics and the surrounding ecosystems.
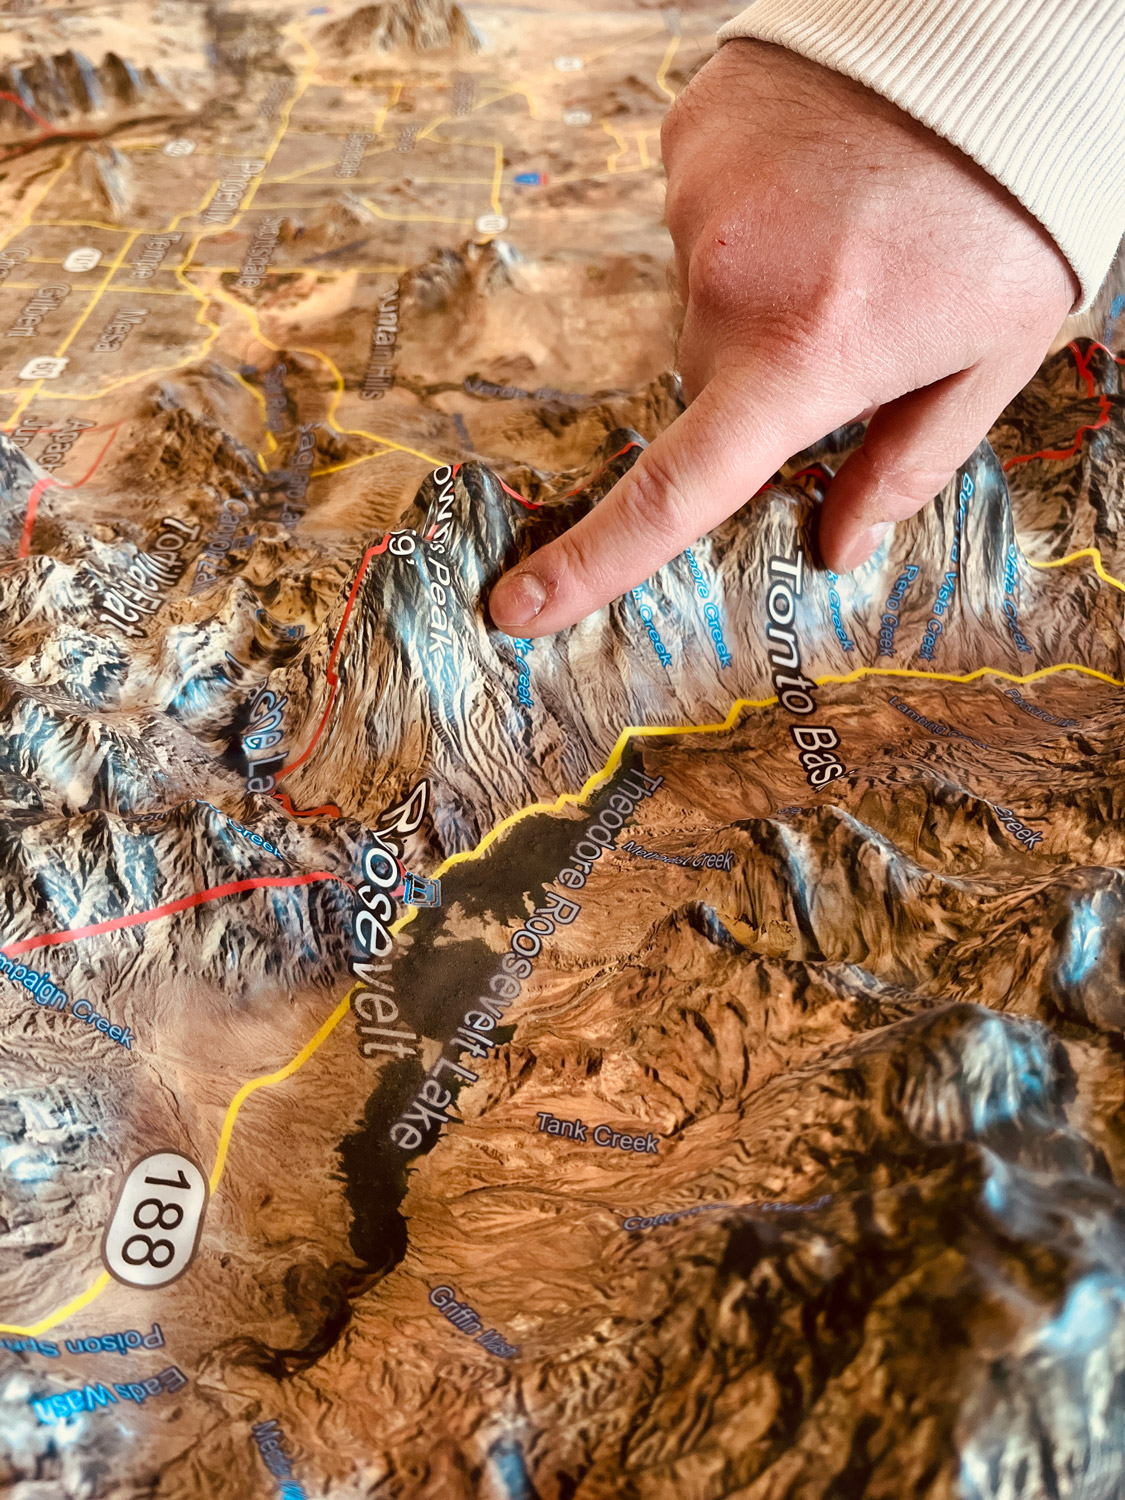
Human-made infrastructure, such as dams, reservoirs, and locks, also plays a significant role in regulating the flow of the river. The map highlights key structures, including the Coffeeville Lock and Dam, which help maintain water levels for navigation, flood control, and power generation. These structures, while important for economic development, can also disrupt natural habitats and alter water flow patterns, which the map helps to visualize.
Ecosystems and Biodiversity: The Tombigbee River Watershed as an Ecological Sanctuary
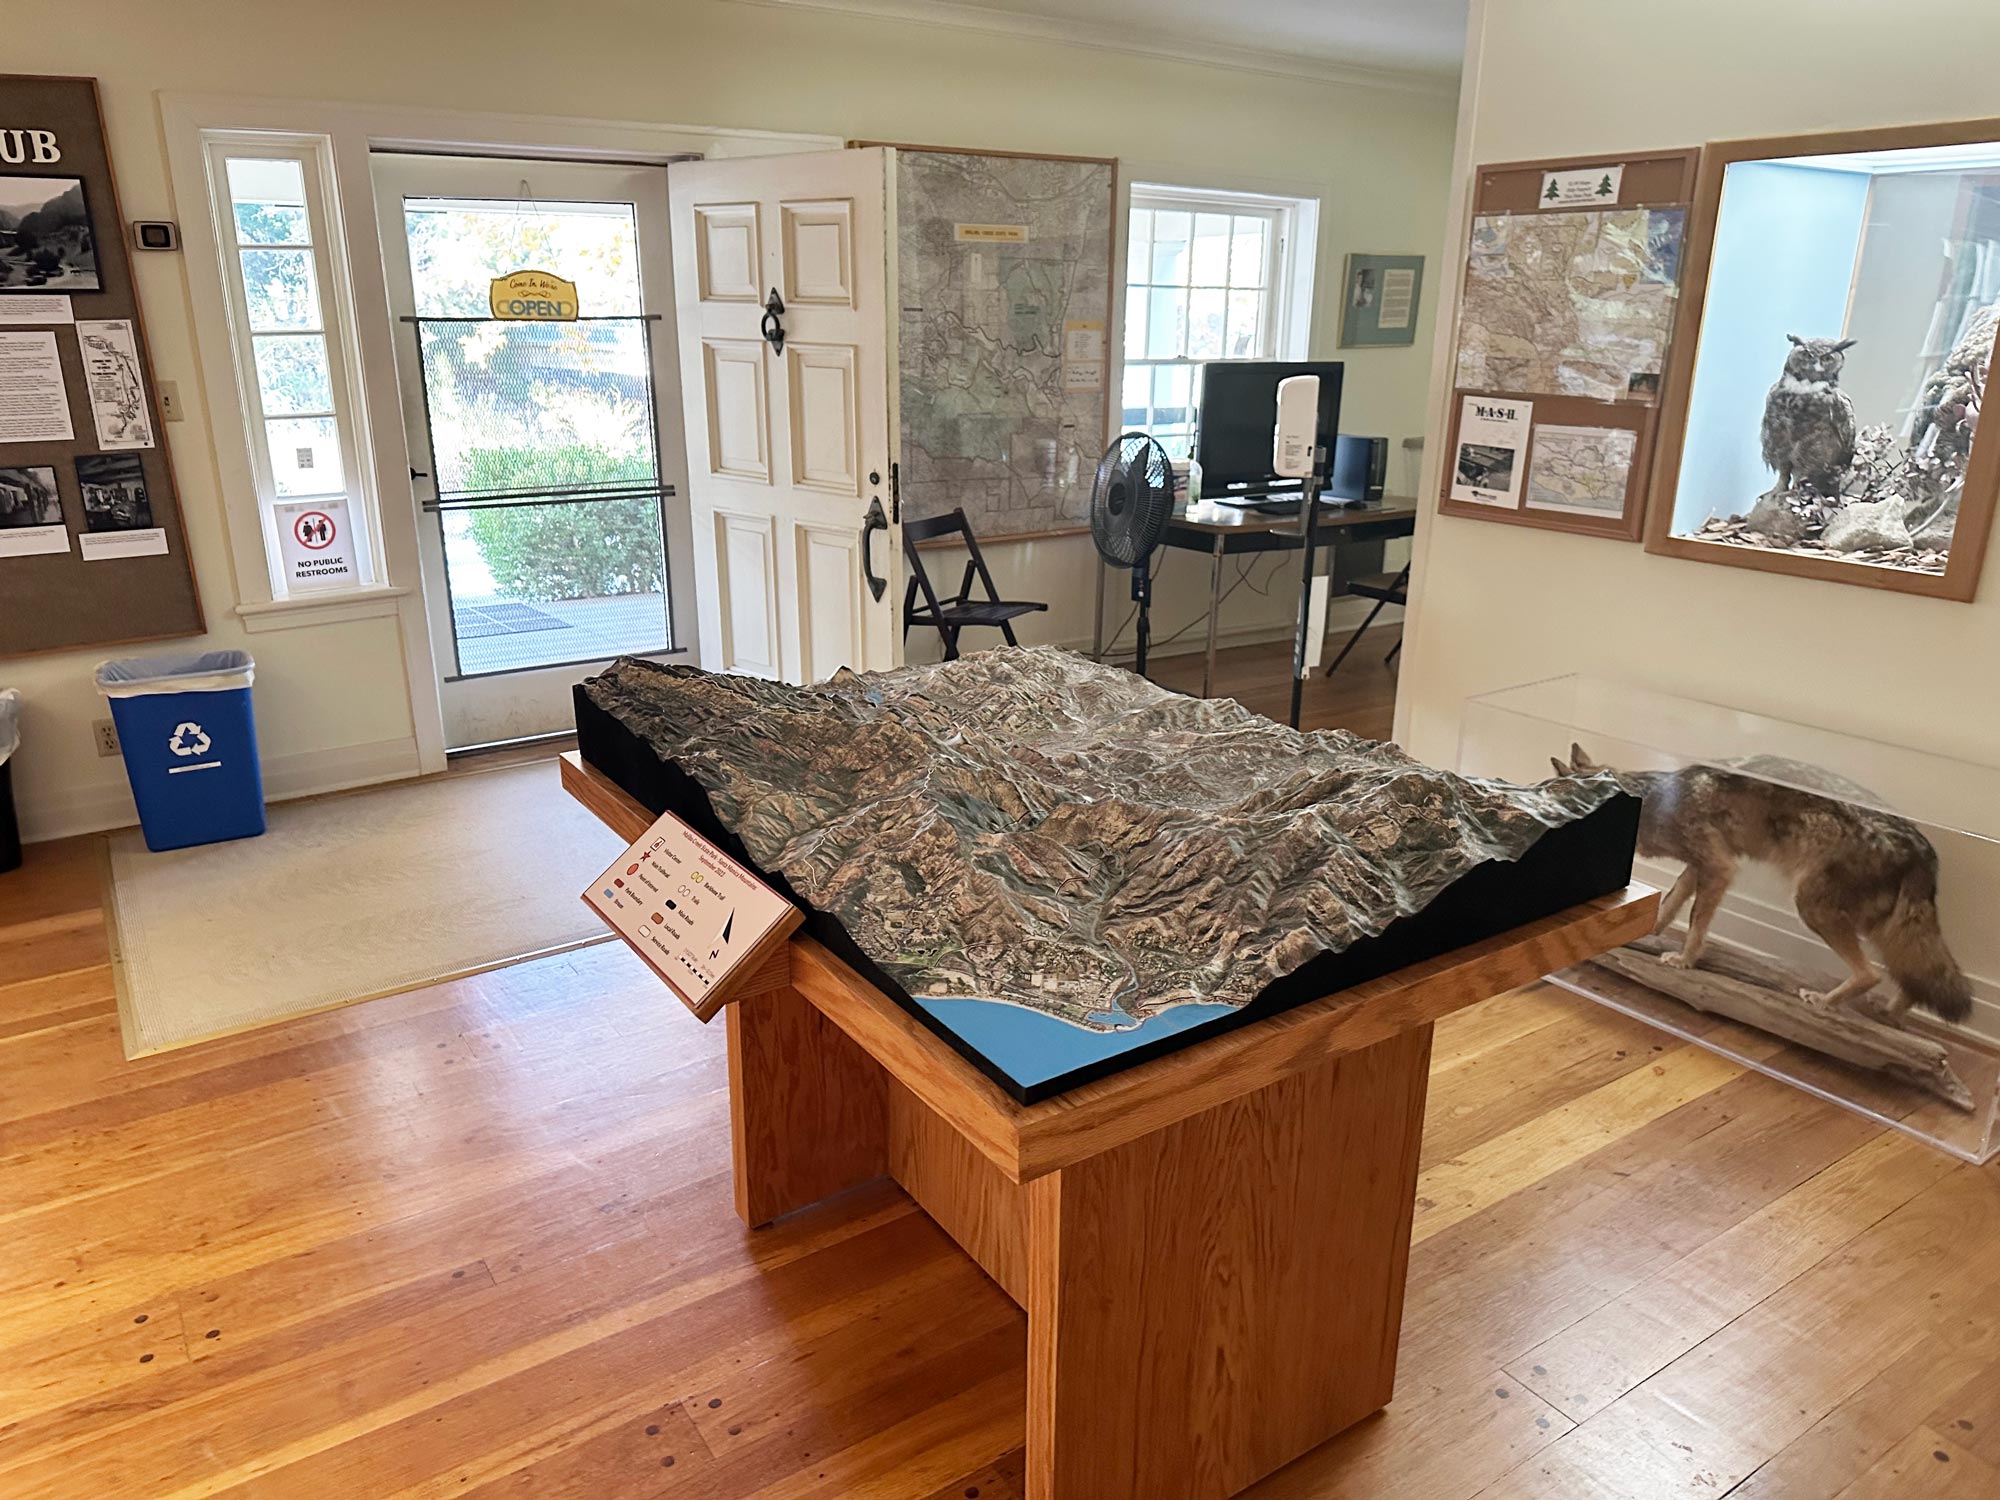
The Tombigbee River Watershed is home to a wide array of ecosystems, each supporting a variety of plant and animal species. From the lush riparian zones along the riverbanks to the wetlands and forests that surround it, these ecosystems are critical for maintaining biodiversity and ecological health. The Tombigbee River Watershed Map provides a detailed look at these ecosystems, illustrating how they interact with the river and how the river supports the life within them.
Riparian habitats along the Tombigbee River are essential for maintaining water quality and supporting aquatic life. These areas, characterized by dense vegetation and water-loving plants, act as buffers that filter pollutants from runoff, stabilize riverbanks, and provide shelter for a variety of species. The map highlights these riparian zones, emphasizing their importance for supporting wildlife such as beavers, otters, and birds like the great egret and herons. These areas are also crucial for fish, including the bass, catfish, and freshwater mussels that are found in abundance in the river.
Wetlands, particularly those in the lower reaches of the watershed, are another critical component of the ecosystem. These wetlands act as natural filters, removing excess nutrients and pollutants from the water before it reaches larger bodies like the Mobile River and ultimately the Gulf of Mexico. The map identifies key wetland areas, helping to prioritize conservation efforts to protect these valuable resources. Wetlands also serve as important breeding and feeding grounds for migratory birds, such as ducks, geese, and shorebirds, which rely on these habitats during their long journeys.
The forests and grasslands surrounding the river are also home to a diverse range of species. From the hardwood forests of the Appalachian foothills to the mixed woodlands and prairies of the lower watershed, these areas provide vital habitat for animals such as white-tailed deer, wild turkeys, and red foxes. The map integrates these upland ecosystems, illustrating how they are connected to the river system and how the river’s health is intertwined with the health of the surrounding land.
Human Influence: Agriculture, Industry, and Urban Development in the Tombigbee River Watershed
Human activity has had a profound impact on the Tombigbee River Watershed, shaping the land, water, and ecosystems in countless ways. From the early agricultural practices of Native American tribes to the establishment of European settler communities, the region has been influenced by centuries of human activity. Today, the watershed is home to a range of industries, including agriculture, manufacturing, and energy production, all of which rely on the river for water, transportation, and power. The Tombigbee River Watershed Map provides a detailed view of these human influences, showing how urban development, agriculture, and infrastructure intersect with the natural environment.
Agriculture has long been a dominant land use within the Tombigbee River Watershed. The fertile soils of the river valley support crops such as cotton, soybeans, corn, and rice, as well as livestock grazing. The map highlights areas of intensive agricultural activity, illustrating how irrigation systems draw water from the river to sustain farming operations. While agriculture is essential to the region’s economy, it also poses challenges, such as water depletion, nutrient runoff, and soil erosion. The map helps visualize these impacts and serves as a tool for implementing sustainable farming practices that protect the river and surrounding ecosystems.
Urbanization has also had a significant impact on the Tombigbee River Watershed. Cities such as Columbus, Mississippi, and Tuscaloosa, Alabama, are located within the watershed and rely on the river for drinking water, waste disposal, and industrial cooling. As urban populations grow, so too does the demand for water, energy, and infrastructure. The map identifies key urban areas and infrastructure, such as dams, wastewater treatment plants, and roads, allowing policymakers to assess how urban development affects water quality, habitat availability, and flood risks.
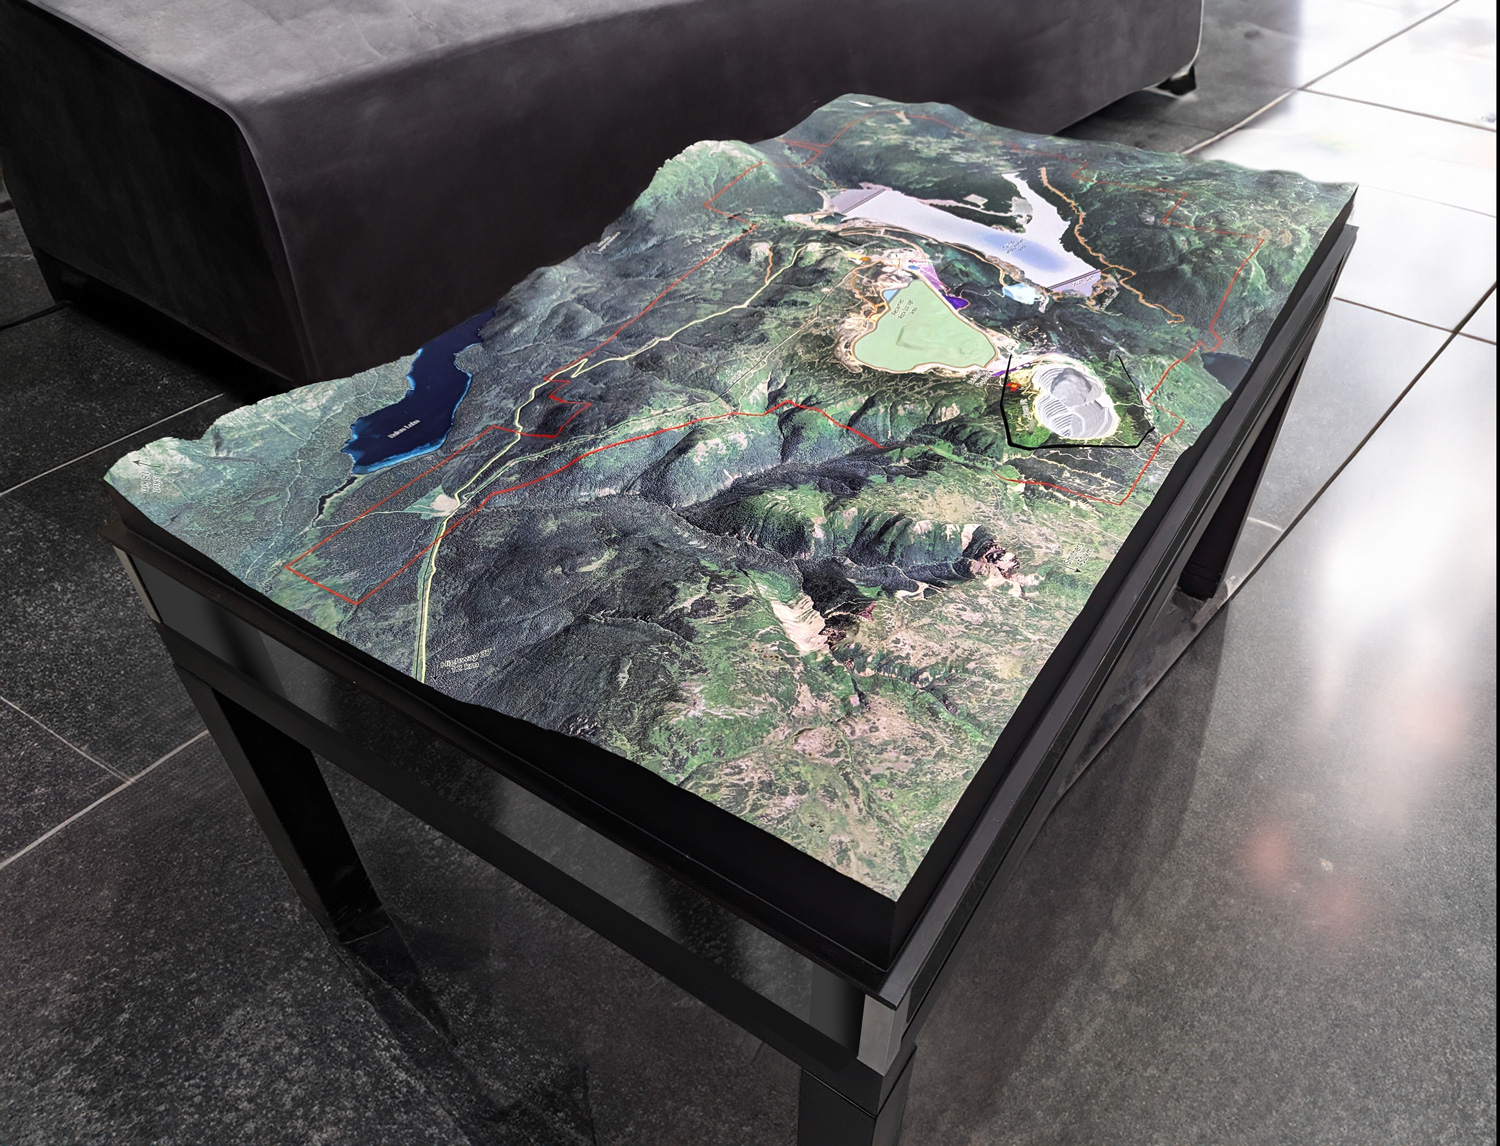
Industries within the watershed, such as mining, timber, and energy production, also contribute to the region’s economic growth. The Tombigbee River Watershed Map illustrates how these industries impact the river’s flow, water quality, and surrounding ecosystems. For example, the extraction of minerals and the construction of energy facilities may disrupt natural habitats, while timber harvesting can lead to soil erosion and sedimentation. The map highlights these areas, helping to identify opportunities for sustainable practices that balance economic development with environmental protection.