
The Suwannee River Watershed Map: Exploring Florida’s Iconic Waterway
The Suwannee River Watershed is one of the Southeast’s most fascinating and ecologically rich regions, stretching across Georgia and Florida to empty into the Gulf of Mexico. Covering more than 10,000 square miles, this watershed is a vital lifeline for countless species, diverse ecosystems, and communities that depend on its waters for survival. The Suwannee River Watershed Map offers a comprehensive look into the complexities of this system, illustrating how its interconnected rivers, springs, and wetlands shape the landscape and influence life across the region.
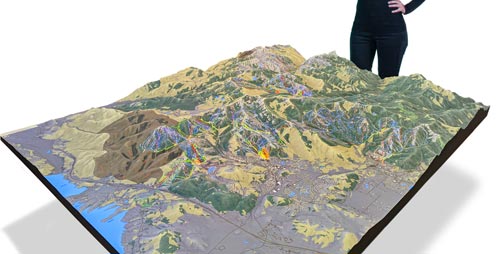
Understanding the Suwannee River Watershed Map reveals much about the history, hydrology, and challenges facing this iconic river. From its origins in the Okefenokee Swamp to its journey through Florida’s karst terrain, the map showcases the intricate web of natural features and human influences that define the watershed. With advancements in cartographic techniques, including 3D mapping technologies exemplified by the Green River Watershed, we can explore the Suwannee’s dynamics in unprecedented detail.
The Geographic and Hydrological Scope of the Suwannee River Watershed
The Suwannee River originates in the Okefenokee Swamp, a vast and mysterious wetland straddling the Georgia-Florida border. As the river meanders southward through Florida, it gathers water from a network of tributaries, springs, and aquifers. The Suwannee River Watershed Map highlights the major tributaries, including the Alapaha, Withlacoochee, and Santa Fe Rivers, all of which contribute to the system’s hydrological balance.
This watershed is particularly unique due to its karst topography. The limestone bedrock beneath the Suwannee River is riddled with sinkholes, caves, and underground streams, which give rise to one of the world’s largest concentrations of freshwater springs. The map details these springs, such as the iconic Ichetucknee and Fanning Springs, illustrating their role in replenishing the river and supporting biodiversity.
The Suwannee River Watershed Map also reveals the system’s connection to the Gulf of Mexico. Estuaries at the river’s mouth are critical for maintaining water quality and providing habitats for marine life, including fish and shellfish vital to Florida’s economy. By showing how the river’s flow impacts coastal ecosystems, the map underscores the interconnectedness of freshwater and marine environments.
Ecosystems and Biodiversity Within the Suwannee River Watershed
The Suwannee River Watershed is home to a wide array of ecosystems, from the blackwater swamps of the Okefenokee to the clear, spring-fed rivers of Florida. These habitats support an incredible diversity of plant and animal species, many of which are found nowhere else on Earth. The Suwannee River Watershed Map is an essential tool for identifying and protecting these ecological treasures.
Riparian forests line much of the Suwannee River, providing habitat for species such as river otters, bald eagles, and alligators. These forests also act as natural filters, trapping sediment and nutrients that would otherwise degrade water quality. The map highlights these riparian zones, emphasizing their importance in maintaining the health of the watershed.
The watershed’s springs are particularly significant, supporting aquatic ecosystems that rely on their constant flow of crystal-clear water. Many of these springs are designated as critical habitats for the Florida manatee, a gentle marine mammal that migrates to the springs during the winter months. The map showcases these critical habitats, helping conservationists prioritize areas for protection.
In addition to its wildlife, the Suwannee River Watershed is home to diverse plant communities, including cypress swamps, hardwood hammocks, and pine flatwoods. The map provides a detailed view of these habitats, illustrating how they are distributed across the watershed and their role in supporting biodiversity.
Human Influence and Water Management Challenges
Human activity has had a profound impact on the Suwannee River Watershed. Agriculture, urban development, and recreational use have all shaped the landscape, often at the expense of water quality and ecosystem health. The Suwannee River Watershed Map provides valuable insights into these challenges, helping stakeholders develop strategies for sustainable management.
Agriculture is one of the primary drivers of change in the watershed. Fertilizer runoff from farms contributes to nutrient pollution, leading to algal blooms that harm aquatic life and reduce water clarity. The map highlights agricultural areas within the watershed, showing how they intersect with rivers, springs, and wetlands. This information is critical for designing best management practices to reduce nutrient runoff and protect water quality.
Urban development poses another challenge, particularly in areas where population growth has increased demand for water and land. The Suwannee River Watershed Map identifies urban centers and their proximity to sensitive ecosystems, helping planners balance development with conservation. It also highlights the importance of stormwater management systems in reducing urban runoff and preventing flooding.
The map also underscores the challenges posed by climate change. Rising temperatures and altered rainfall patterns threaten the watershed’s hydrological balance, impacting everything from spring flows to estuarine health. By modeling these changes, the Suwannee River Watershed Map provides a roadmap for adaptive management strategies that ensure the long-term resilience of the system.