Understanding Elevation, Slopes, and Terrain Through Lines
At first glance, a contour map can look like a maze of looping lines. Circles stack inside circles, curves stretch across the page, and nothing appears flat or simple. But hidden inside those lines is one of the most powerful visual languages in geography. A contour map doesn’t just show where things are—it shows how the land rises, falls, and flows. Contour maps translate the three-dimensional shape of the Earth into a two-dimensional format that still communicates depth, slope, and elevation. With no shading, no 3D effects, and often no color at all, they manage to describe mountains, valleys, ridges, cliffs, and plains with remarkable precision. Once you learn how to read a contour map, landscapes begin to reveal themselves in entirely new ways. Hills become readable. Terrain becomes predictable. And suddenly, a flat piece of paper holds an entire world of shape and structure.
The Core Idea Behind a Contour Map
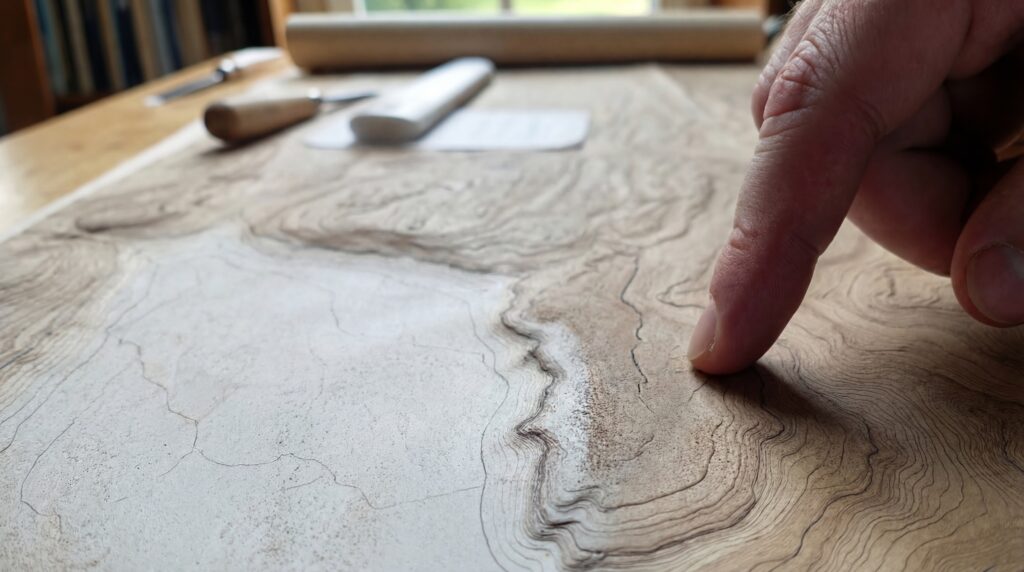
A contour map represents elevation using lines called contour lines. Each line connects points of equal elevation above a reference level, usually sea level. If you were to walk along one contour line in real life, you would never go uphill or downhill—you’d remain at the same height the entire time. The magic of a contour map lies in how those lines interact. Where they bunch tightly together, the land is steep. Where they spread far apart, the terrain is gentle. Closed loops usually indicate hills or depressions, while elongated curves trace ridges and valleys. Rather than showing height directly, contour maps show change in height, which is often more useful. They tell you not just how tall something is, but how quickly the land rises or falls.
Why Contour Maps Exist at All
The Earth is three-dimensional, but maps are not. Before contour maps existed, cartographers struggled to show elevation on flat surfaces. Early methods relied on perspective drawings or vague shading, which were visually appealing but imprecise.
Contour maps solved this problem by creating a system that was both accurate and repeatable. Instead of drawing hills as pictures, cartographers could describe terrain mathematically. Elevation became data. Shape became measurable.
This breakthrough allowed maps to be used not just for navigation, but for engineering, science, military planning, and environmental analysis. Contour maps turned geography into something that could be calculated as well as visualized.
A Short History of Contour Mapping
The concept of contour lines emerged in the 18th century as surveying techniques improved. Early engineers and scientists realized that connecting points of equal elevation revealed the underlying structure of landforms far more clearly than artistic shading. By the 19th century, contour maps became standard tools for civil engineering projects such as canals, railways, and roads. Knowing where land rose sharply or gradually was essential for planning efficient routes. As national mapping agencies developed, contour maps became widely available to the public. They were used by hikers, geologists, military planners, and educators, becoming one of the most enduring map types ever created.
How Contour Lines Actually Work
Each contour line represents a specific elevation, such as 500 feet or 100 meters above sea level. The vertical distance between adjacent lines is called the contour interval. This interval remains consistent across the map.
- A small contour interval shows fine detail and subtle elevation changes. A larger interval simplifies the terrain, making it easier to read at broader scales. The choice of interval depends on the map’s purpose and the landscape being shown.
- Index contours appear every few lines and are often drawn thicker to help users quickly identify elevation values. Between them, intermediate contours fill in the detail.
Together, these lines create a visual rhythm that describes terrain shape without ever drawing a single mountain directly.
Reading the Shape of the Land from Lines Alone
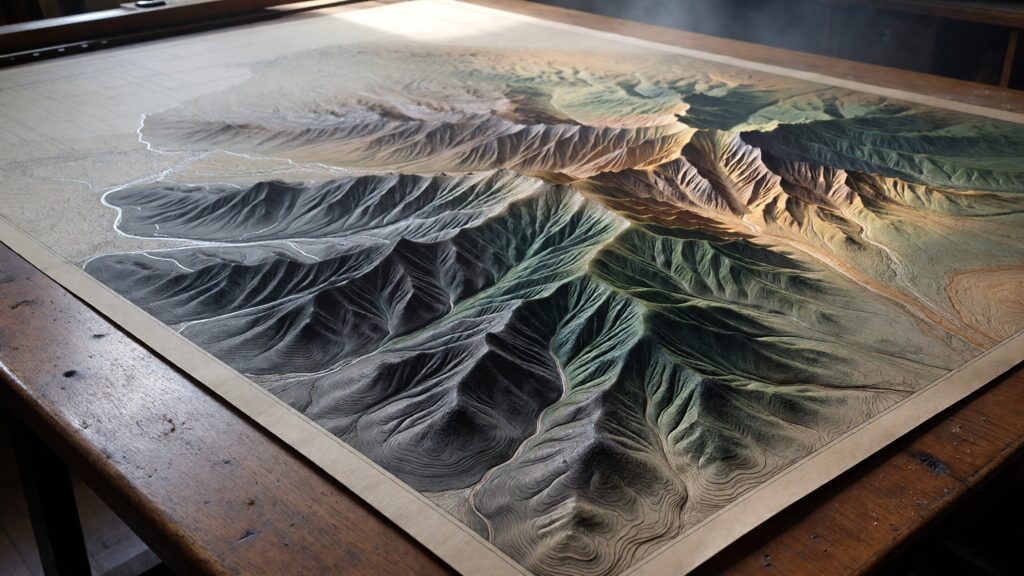
Once you understand contour patterns, terrain begins to emerge almost instantly. Concentric closed loops usually indicate hills, with elevation increasing toward the center. If the loops contain short tick marks pointing inward, they represent depressions instead. V-shaped contours pointing uphill indicate valleys and stream channels. V-shapes pointing downhill usually mark ridges. Long, parallel lines spaced evenly apart suggest gentle slopes, while lines stacked tightly together indicate steep terrain or cliffs. With practice, a contour map can feel almost three-dimensional in your mind. You stop seeing lines and start seeing landforms.
Why Contour Maps Feel Abstract at First
Many people find contour maps confusing initially because they require spatial imagination. Unlike raised relief maps or terrain models, contour maps don’t physically show height—they imply it.
This abstraction is their strength. Once learned, contour maps allow you to understand terrain with incredible precision using very little visual information. They are compact, efficient, and data-rich. The learning curve may be steeper, but the payoff is enormous.
Contour Maps vs Other Types of Maps
Contour maps differ from shaded relief maps, which use light and shadow to suggest elevation. Shaded maps are visually intuitive but less precise. Contour maps prioritize accuracy over realism.
They also differ from terrain models and raised relief maps, which physically represent elevation. Those models excel at instant understanding, while contour maps excel at detailed analysis and measurement.
Digital 3D maps combine elements of all three, but contour maps remain foundational. Even digital elevation systems rely on contour data behind the scenes.
Why Contour Maps Are Still Used Today
Despite modern technology, contour maps remain essential. Engineers use them to design roads, bridges, and drainage systems. Hikers rely on them to assess trail difficulty. Geologists study them to understand erosion and rock structure.
Contour maps are lightweight, printable, and usable without power or software. In critical situations, their reliability matters. They also teach spatial thinking in a way few other tools can.
Contour Maps in Outdoor Navigation
For hikers, climbers, and backpackers, contour maps are invaluable. They reveal how strenuous a route will be before you ever step outside. Closely spaced lines warn of steep ascents. Broad spacing promises easier terrain. They show saddle points between peaks, ridgelines for navigation, and valley floors where water is likely to flow. When paired with a compass, contour maps allow precise navigation even in low visibility. Many outdoor professionals consider contour literacy a core survival skill.
Contour Maps in Science and Engineering
Scientists use contour maps to study watersheds, floodplains, volcanic structures, and glacial landscapes. Engineers use them to calculate cut-and-fill volumes, slope stability, and drainage behavior.
In these contexts, contour maps are not illustrative—they are analytical tools. Decisions worth millions of dollars often depend on reading them correctly.
The simplicity of contour lines hides the depth of information they contain.
Contour Maps and Watersheds
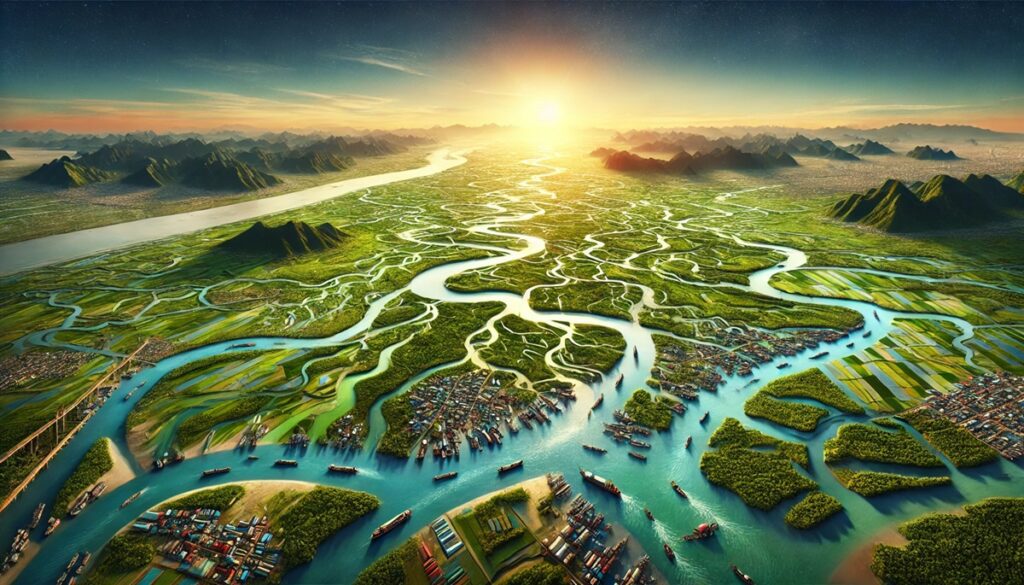
One of the most powerful uses of contour maps is understanding water flow. Because water moves downhill, contour patterns reveal where streams form, how watersheds divide, and where flooding may occur.
Watershed boundaries follow ridgelines, which are clearly visible on contour maps. Valley shapes guide stream paths. Subtle changes in spacing can signal areas prone to erosion or pooling. Environmental planners rely on contour maps to protect water resources and manage land sustainably.
Why Contour Maps Are Still Taught in Schools
Learning to read contour maps builds spatial reasoning skills. Students learn to visualize three-dimensional forms mentally, strengthening problem-solving abilities beyond geography. Contour maps also connect math, science, and real-world application. They show how numerical data becomes visual understanding. Even in a digital age, contour maps remain one of the most effective tools for teaching how the world is shaped.
Common Mistakes When Reading Contour Maps
A frequent misconception is assuming contour lines represent physical barriers. They don’t. They describe elevation, not walls.
Another mistake is ignoring the contour interval. Without knowing it, the map’s vertical scale is meaningless. A steep slope on one map might be gentle on another depending on interval. Understanding these nuances turns confusion into clarity.
Contour Maps as Design Inspiration
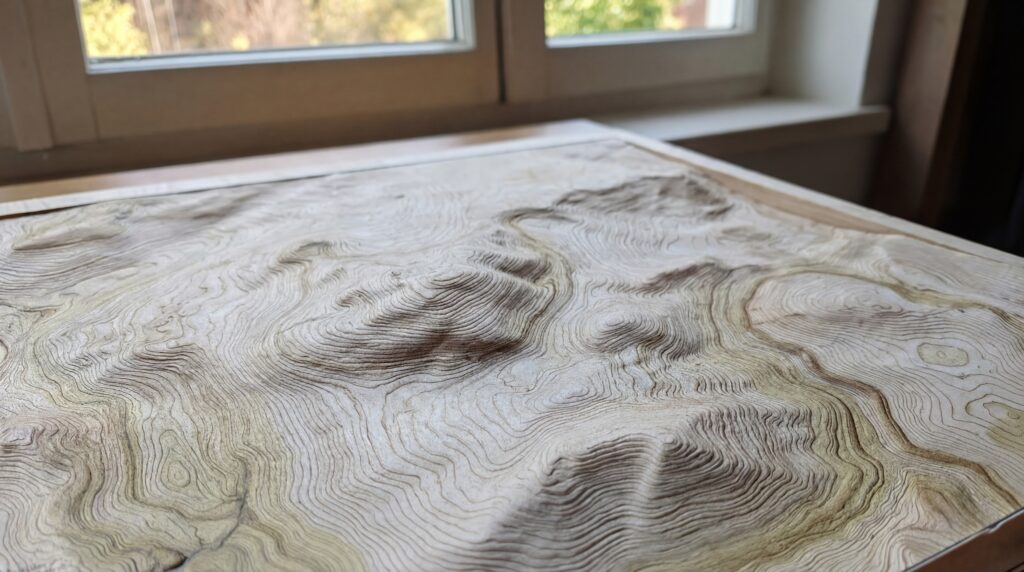
Beyond their technical uses, contour maps have inspired designers, artists, and architects. Their flowing lines resemble fingerprints, wood grain, and sound waves. Designers use contour patterns in everything from textiles to architecture to branding. The language of elevation becomes a visual metaphor for depth, complexity, and natural rhythm. This crossover between science and art is part of what makes contour maps so enduring.
Physical vs Digital Contour Maps
Digital contour maps allow layers, zooming, and real-time updates. Physical contour maps offer permanence and focus.
Many professionals use both. Digital tools for analysis. Physical maps for discussion, planning, and teaching. Contour lines remain the common language between them.
The Future of Contour Mapping
As data collection improves, contour maps grow more accurate and detailed. LiDAR allows contours to capture subtle features like old stream channels and human-altered landscapes. Yet the fundamental concept remains unchanged. Lines connect equal elevation. Shape emerges from repetition. Few mapping ideas have proven so timeless.
Why Contour Maps Still Matter
Contour maps teach us to think in shape, not just location. They reveal the structure beneath the surface. They reward patience, skill, and curiosity.
In a world full of instant visuals, contour maps slow us down and ask us to understand rather than glance. And once you do, the land never looks the same again.