What Is a Nautical Chart? Understanding the Maps That Guide Ships Safely Across the Sea
The ocean looks endless when you’re standing on shore. Blue water stretches to the horizon, waves roll in steady rhythms, and everything feels open and free. But beneath that calm surface lies a world of contours, hazards, channels, and invisible rules. Ships don’t move across the sea by instinct alone. They move by maps—very special maps known as nautical charts. A nautical chart is not just a map of water. It is a detailed guide to the seafloor, coastlines, tides, and dangers hidden beneath the waves. For centuries, these charts have helped sailors cross oceans, enter harbors, and return home safely. Even in an age of GPS and digital navigation, nautical charts remain one of the most trusted tools in maritime travel. Understanding what a nautical chart is opens the door to understanding how humans have explored, traded across, and survived on the world’s oceans.
The Origins of Nautical Charts
Long before satellites orbited Earth, sailors relied on observation, memory, and experience. Early seafarers marked coastlines, reefs, and safe anchorages on parchment and animal skins. These early charts were rough, often artistic, and sometimes wildly inaccurate, but they represented humanity’s first attempts to understand the sea. As exploration expanded, so did the need for better charts. The Age of Exploration transformed nautical charting into a scientific discipline. Mariners began measuring depth, recording currents, and calculating latitude and longitude. Over time, charts evolved from symbolic drawings into precise navigational tools. Every modern nautical chart is built on centuries of accumulated maritime knowledge.
What Exactly Is a Nautical Chart?
A nautical chart is a specialized map designed specifically for navigation on water. Unlike road maps or topographic maps, nautical charts focus on features that matter to vessels. These include water depth, underwater terrain, coastal outlines, navigational aids, shipping lanes, and hazards such as rocks, shoals, and wrecks.
Nautical charts represent both what you can see and what you cannot. They show the shape of the seafloor, the rise and fall of tides, and the invisible boundaries that guide marine traffic. In essence, a nautical chart transforms a seemingly empty surface into a readable, information-rich landscape. For mariners, these charts are not optional. They are essential.
How Nautical Charts Differ From Regular Maps
At first glance, a nautical chart might look similar to a map, but the differences are profound. A standard map is designed for land navigation, emphasizing roads, cities, and elevation. Nautical charts prioritize depth, water movement, and safe passage.
- Instead of contour lines for mountains, nautical charts use depth soundings and contour lines for the seabed.
- Instead of highways, they show channels and traffic separation schemes.
- Instead of landmarks like buildings, they highlight lighthouses, buoys, and beacons.
Everything on a nautical chart exists to answer one question: is it safe to sail here?
Understanding Depth and the Seafloor
One of the most critical elements of a nautical chart is depth information. Depth soundings show how deep the water is at specific locations, usually measured from a standard reference known as chart datum. These numbers guide captains in avoiding groundings and selecting safe routes.
Contour lines connect areas of equal depth, revealing underwater slopes, ridges, and drop-offs. Shallow areas may indicate sandbars or reefs, while sudden depth changes can signal underwater cliffs. Reading a nautical chart allows sailors to visualize the ocean floor as clearly as a hiker reads a mountain trail.
Coastlines and Shore Features
Nautical charts provide highly detailed representations of coastlines. Cliffs, beaches, harbors, and man-made structures are carefully mapped. These features help mariners confirm their position visually, especially near land.
Ports and harbors receive special attention. Piers, docks, breakwaters, and anchorages are precisely marked, allowing vessels to navigate crowded waters safely. Even small changes in shoreline shape can matter when entering narrow passages.
The coast is often the most dangerous part of any voyage, which is why charts devote so much detail to it.
Navigational Aids on Nautical Charts
The sea does not have street signs, but it does have navigational aids. Nautical charts show the location of lighthouses, buoys, daymarks, and beacons. Each of these aids has specific characteristics, such as color, shape, and light patterns.
Charts explain how these aids work together to mark channels, warn of hazards, and guide vessels safely. When sailors see a flashing light on the horizon, the chart tells them exactly what it means. These symbols and markings form a language that mariners learn to read fluently.
Hazards Hidden Beneath the Surface
One of the greatest dangers at sea is what cannot be seen. Rocks, reefs, wrecks, and submerged obstructions can destroy a vessel in seconds. Nautical charts mark these hazards clearly, often with cautionary symbols or notes. Some hazards are permanent, while others shift over time due to currents and storms. Chartmakers constantly update charts to reflect new discoveries and changes. A wreck that sank decades ago may still pose a threat today. By revealing hidden dangers, nautical charts turn uncertainty into knowledge.
Tides, Currents, and Water Movement
Water is never truly still. Tides rise and fall, currents flow, and water levels change with weather and seasons. Nautical charts provide essential information about these movements.
Tidal data helps sailors plan safe entry into shallow harbors. Current information helps vessels save fuel and maintain control. In some areas, ignoring tides can mean running aground or being swept off course.
A nautical chart does not just show where you are—it helps predict how the water around you will behave.
Chart Datum and Why It Matters
One concept that confuses beginners is chart datum. This is the reference level from which depths are measured, often based on the lowest expected tide. By using this conservative reference, charts ensure that listed depths are safe under most conditions.
Understanding chart datum allows mariners to adjust for tides and avoid misjudging clearance. It’s one of the many ways nautical charts prioritize safety. While technical, this detail can make the difference between smooth sailing and disaster.
Paper Charts vs Digital Charts
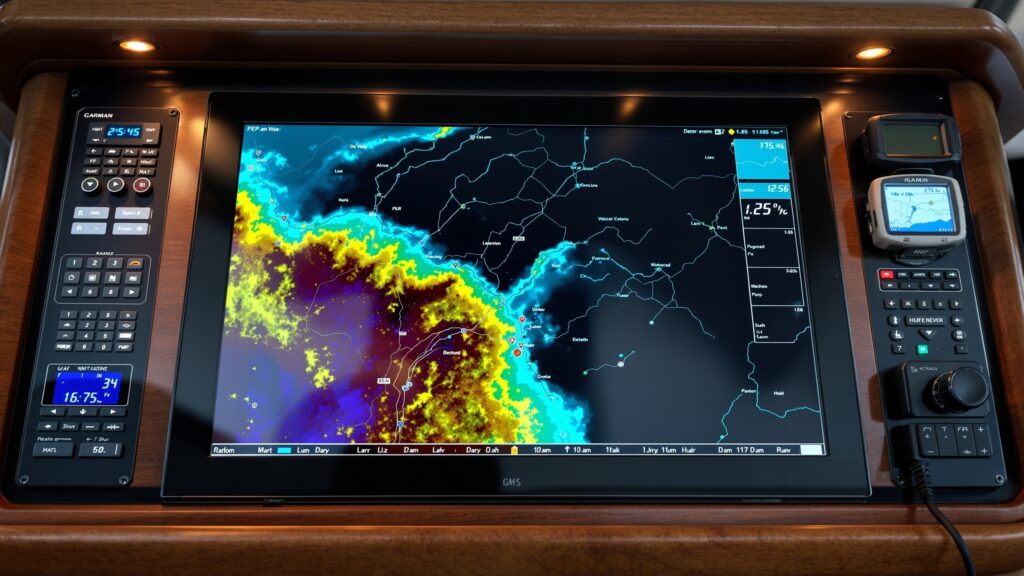
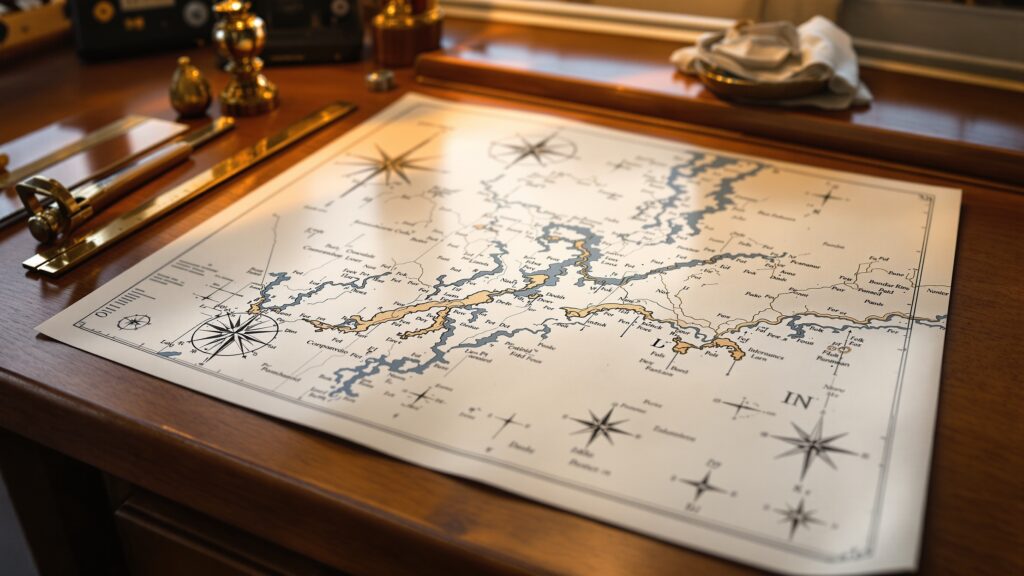
For centuries, nautical charts existed only on paper. These charts required careful storage, constant updating, and skilled interpretation. Today, digital charts have become widespread, offering interactive features and real-time positioning.
Electronic charts integrate with GPS systems, allowing vessels to see their location instantly. They can display layers of information, zoom in and out, and update automatically. Despite this, many sailors still carry paper charts as backups. The chart may have gone digital, but the principles behind it remain unchanged.
How Nautical Charts Are Made Today
Modern nautical charting is a high-tech process. Survey vessels use sonar to map the seafloor in extraordinary detail. Satellites collect data on water levels and coastline changes. Aircraft and drones capture high-resolution imagery. This data is analyzed, verified, and compiled by hydrographic offices. Accuracy is paramount, and charts undergo rigorous quality control before publication. Even with advanced technology, charting the ocean remains a massive and ongoing task.
Who Uses Nautical Charts?
Nautical charts are used by a wide range of people. Commercial shipping relies on them to move goods safely across the globe. Fishermen use them to find productive waters and avoid hazards. Recreational boaters depend on charts for weekend trips and coastal cruising.
Navies use charts for strategic planning, and scientists use them to study marine environments. Even search and rescue operations depend on accurate chart data. Any activity that involves navigating water benefits from a nautical chart.
Nautical Charts and Maritime Law
Nautical charts also play a role in maritime law. They define shipping lanes, territorial waters, and restricted areas. In legal disputes, charts may be used to establish navigational responsibility or determine fault. By standardizing how the sea is represented, nautical charts provide a common reference for international navigation. This shared language helps reduce confusion and conflict on busy waterways. The chart is as much a legal document as it is a navigational tool.
Learning to Read a Nautical Chart
At first glance, a nautical chart can feel overwhelming. Symbols, numbers, and lines crowd the page. But with practice, the chart begins to tell a story. Depths form patterns. Channels emerge. Hazards stand out.
Learning to read a nautical chart is like learning a new language. Once understood, it becomes intuitive, even beautiful. Many sailors describe a deep sense of confidence that comes from truly understanding their chart. That confidence is earned through study and experience.
Nautical Charts in the Age of GPS
With GPS available on smartphones, some people assume charts are obsolete. The opposite is true. GPS tells you where you are, but a nautical chart tells you where it’s safe to go.
Electronic positioning without chart knowledge can be dangerous. Charts provide context, foresight, and understanding that raw coordinates cannot. Experienced mariners always use charts alongside electronic tools.
Technology enhances charts, but it does not replace them.
Why Nautical Charts Still Matter
The ocean is unforgiving. Weather changes rapidly, water hides danger, and mistakes can be costly. Nautical charts represent humanity’s collective effort to make the sea understandable and navigable.
They embody knowledge passed down through generations, refined with science and technology. Every symbol, depth marking, and contour exists because someone learned something the hard way. In a world that still depends on maritime travel, nautical charts remain indispensable.
The Beauty of Nautical Charts
Beyond their function, nautical charts have an undeniable beauty. The curves of coastlines, the rhythm of depth contours, and the elegance of navigational symbols create a visual language all their own. Many people frame old charts as art, appreciating their craftsmanship and historical significance. Even modern charts carry a sense of exploration and possibility. They remind us that the sea is both a challenge and an invitation.
The Future of Nautical Charting
The future of nautical charts is dynamic and data-driven. Real-time updates, crowd-sourced data, and advanced modeling will make charts more responsive than ever. Climate change is already altering coastlines and sea levels, making continuous updates essential.
As vessels become more automated, charts will integrate even more deeply with navigation systems. Yet the core mission will remain the same: helping humans move safely across water.
No matter how technology evolves, the need to understand the sea will never disappear.
Why Nautical Charts Are Maps of Trust
At their heart, nautical charts are maps of trust. Sailors trust them with their vessels, their cargo, and their lives. That trust is earned through accuracy, consistency, and centuries of refinement. When a ship sets sail into open water, the chart becomes a silent companion, guiding every decision. It represents preparation, respect for nature, and the wisdom to navigate rather than conquer. In that sense, a nautical chart is more than a map. It is a promise.