Bathymetric Maps

What is a Bathymetric Map?

We build 2D and 3D Bathymetric Maps

Table of Contents

Bathymetric Maps

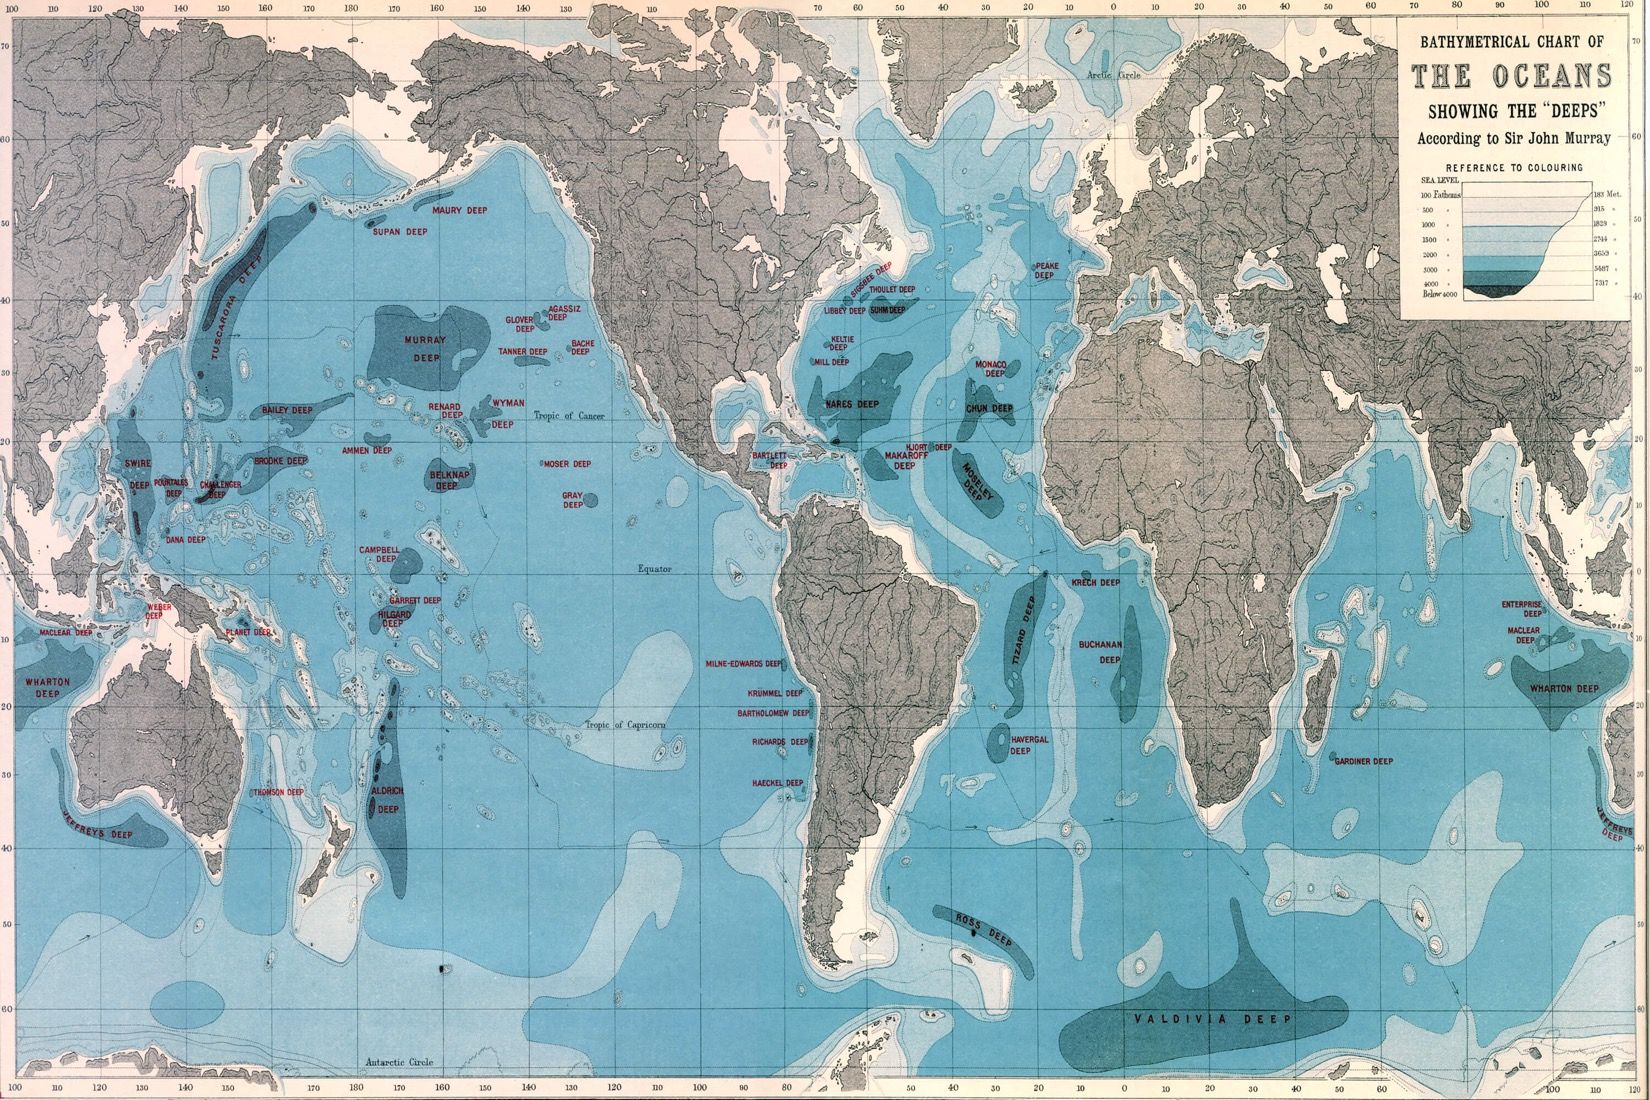
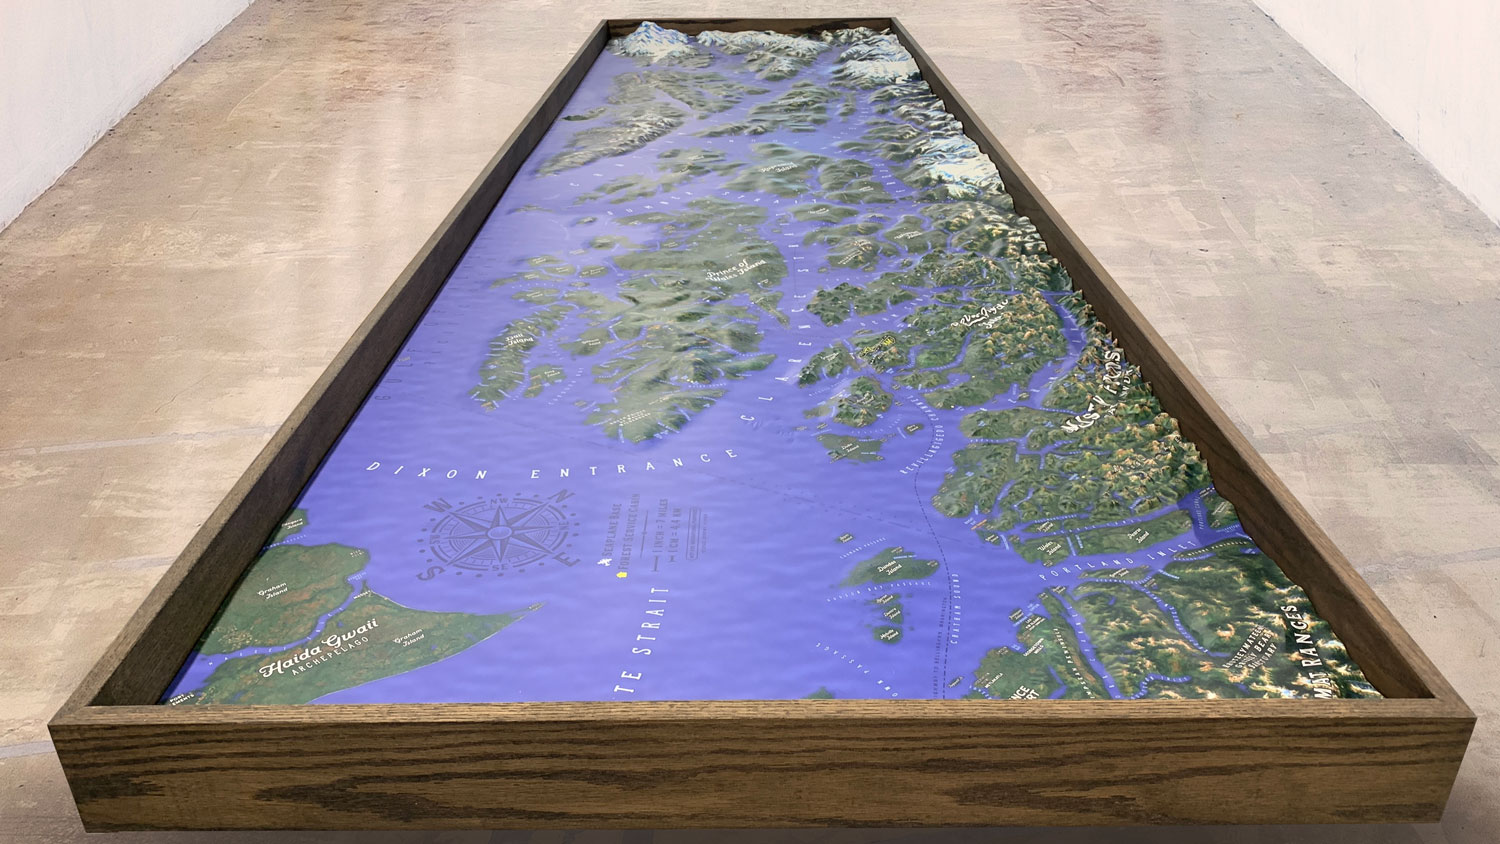
Beneath the tranquil surface of the world’s oceans and seas lies a fascinating and mysterious realm that has captivated humans for centuries.  Exploring the depths of the ocean has always been a daunting task, but with the advent of modern technology, scientists and explorers have been able to unveil the secrets of the underwater world.  One of the most essential tools for such explorations is the bathymetric map, which provides a detailed representation of the ocean floor topography.

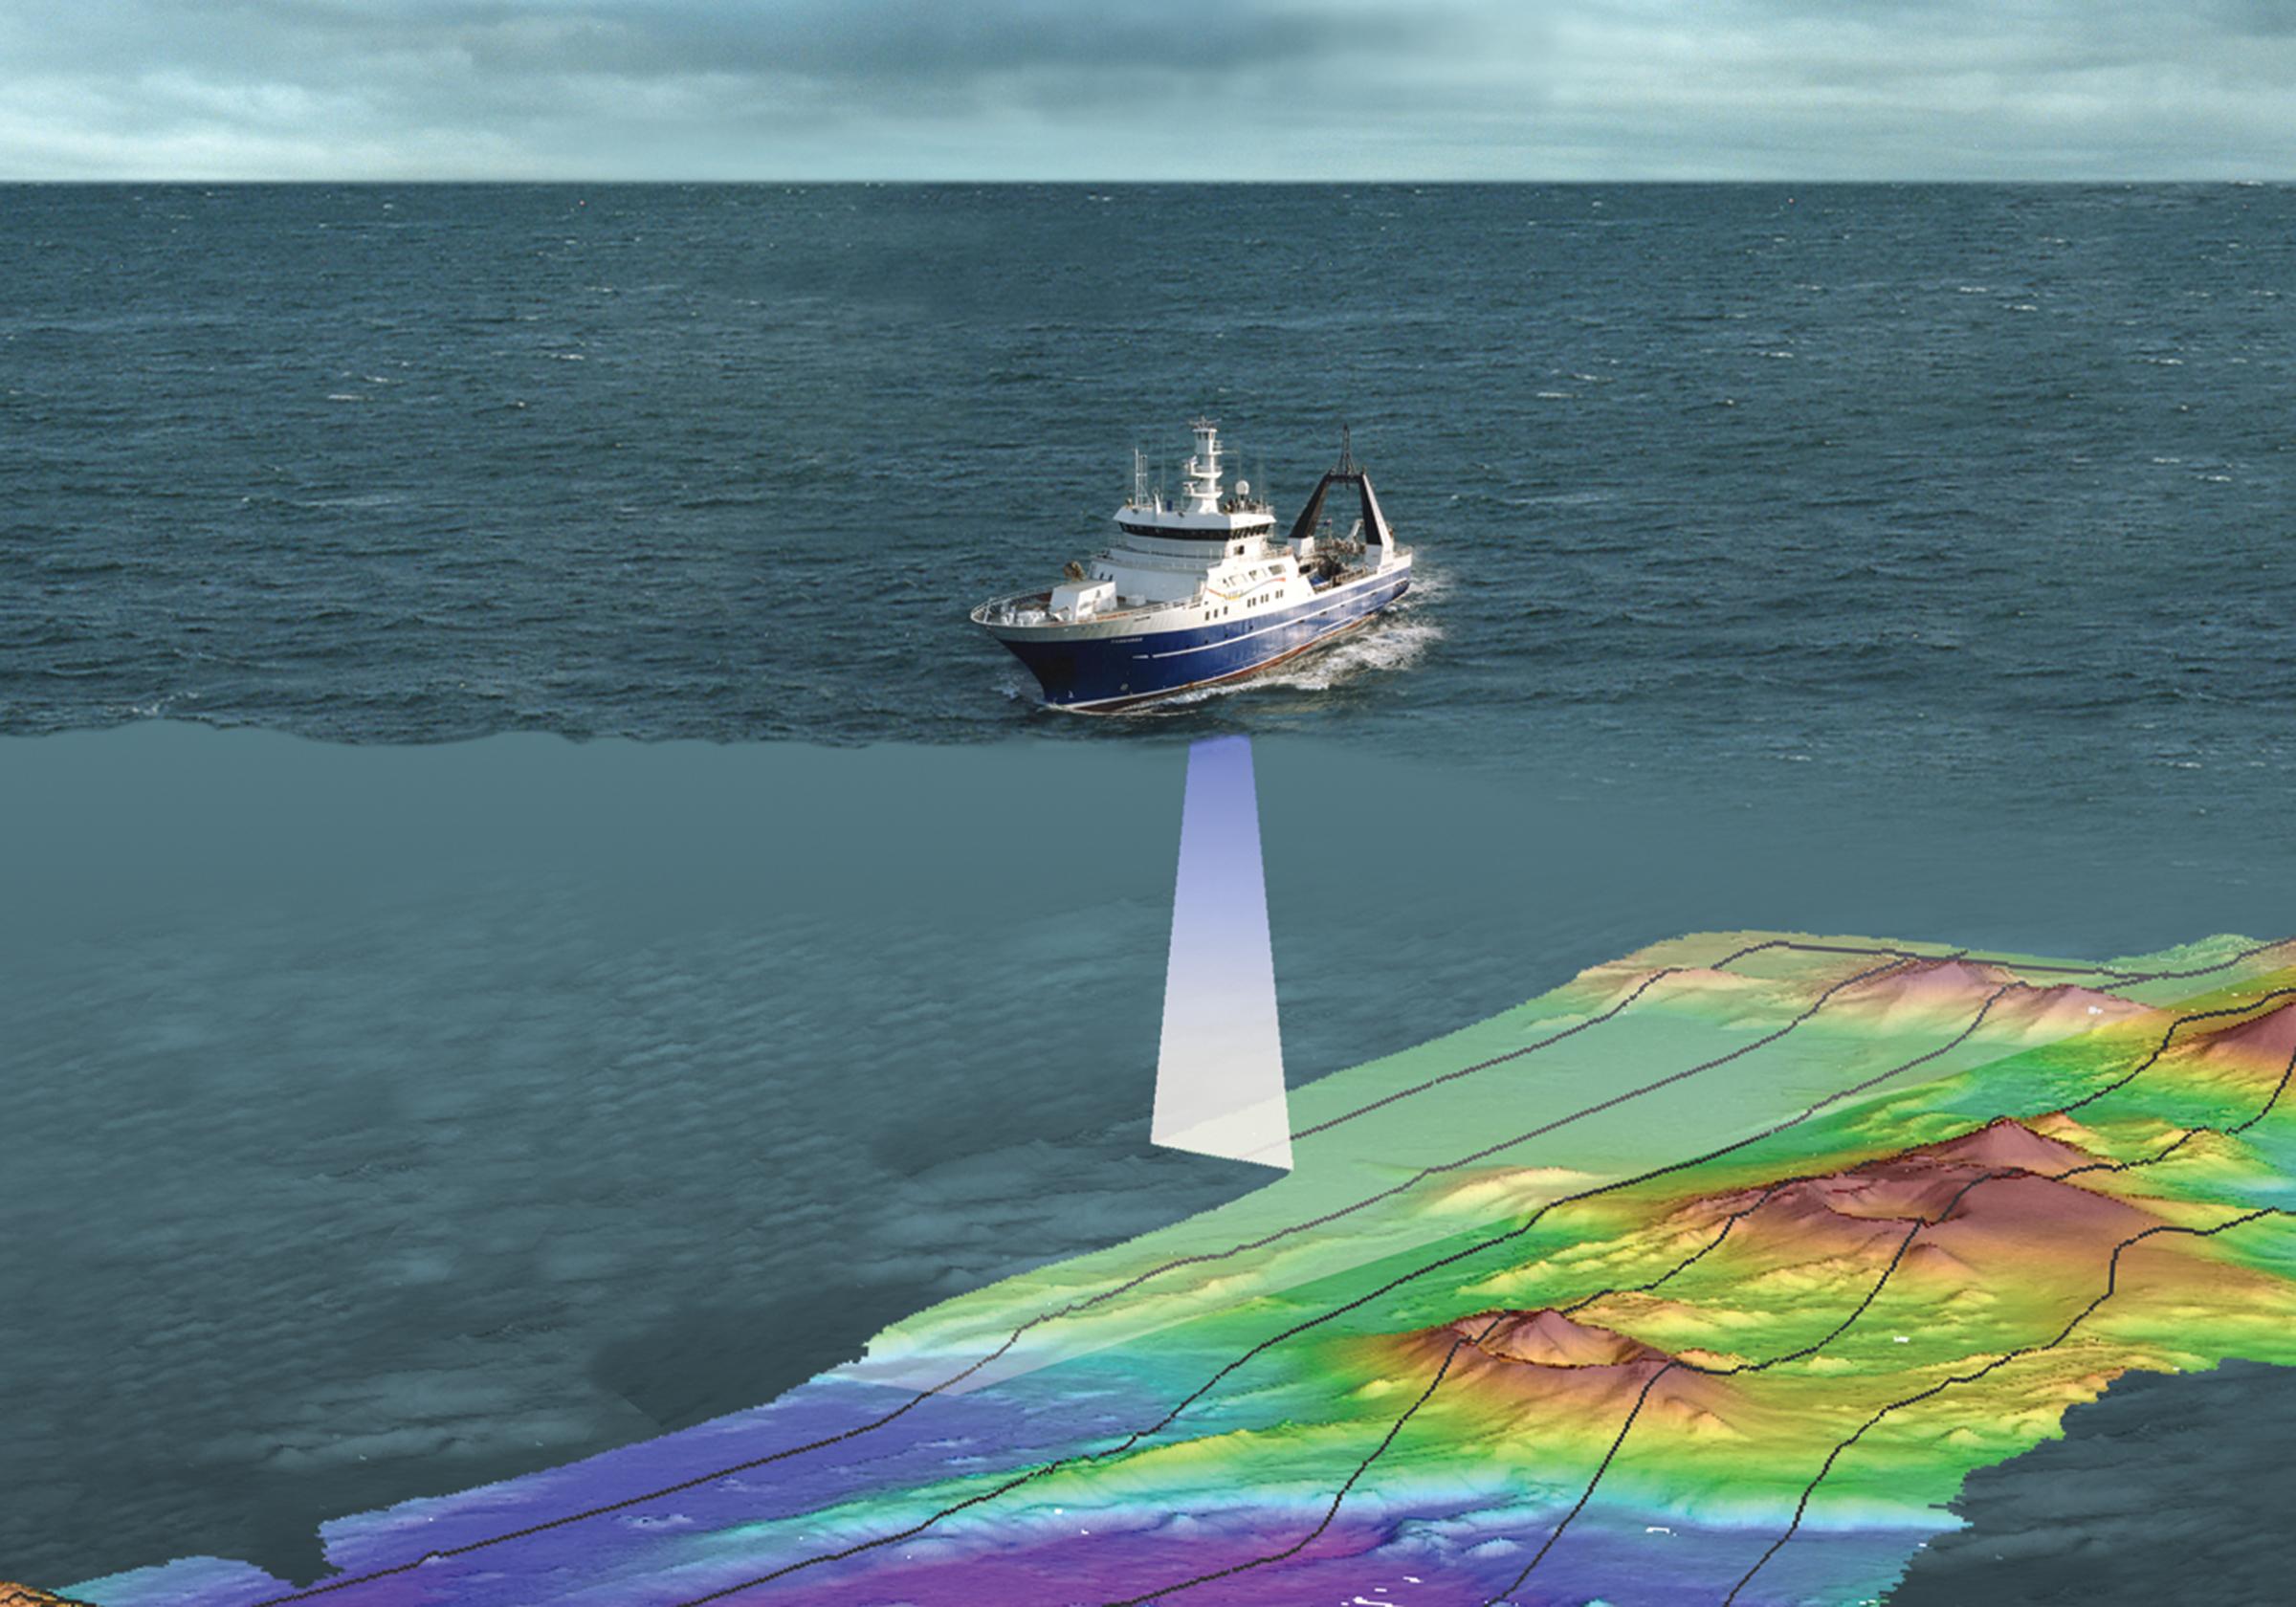
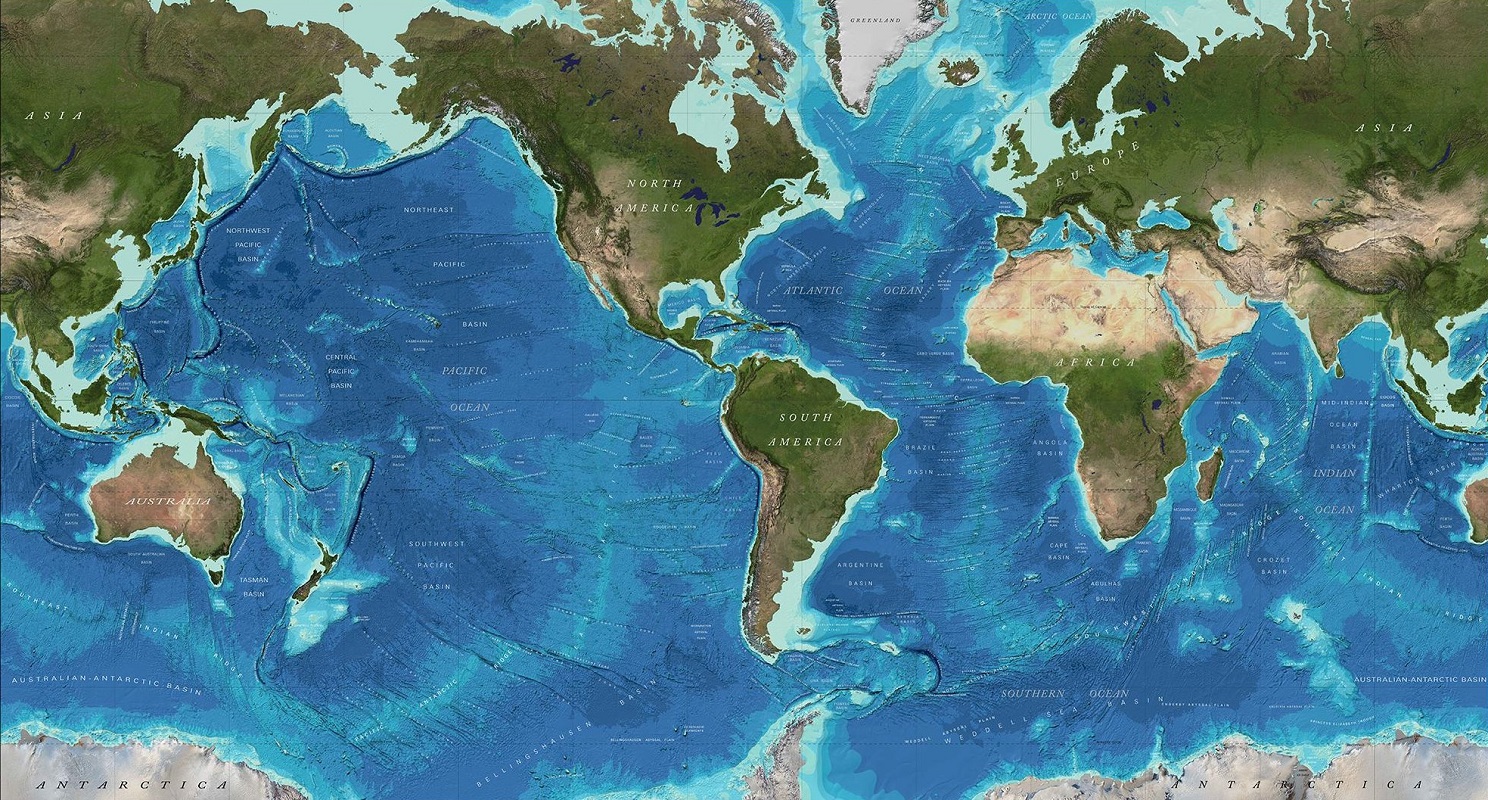
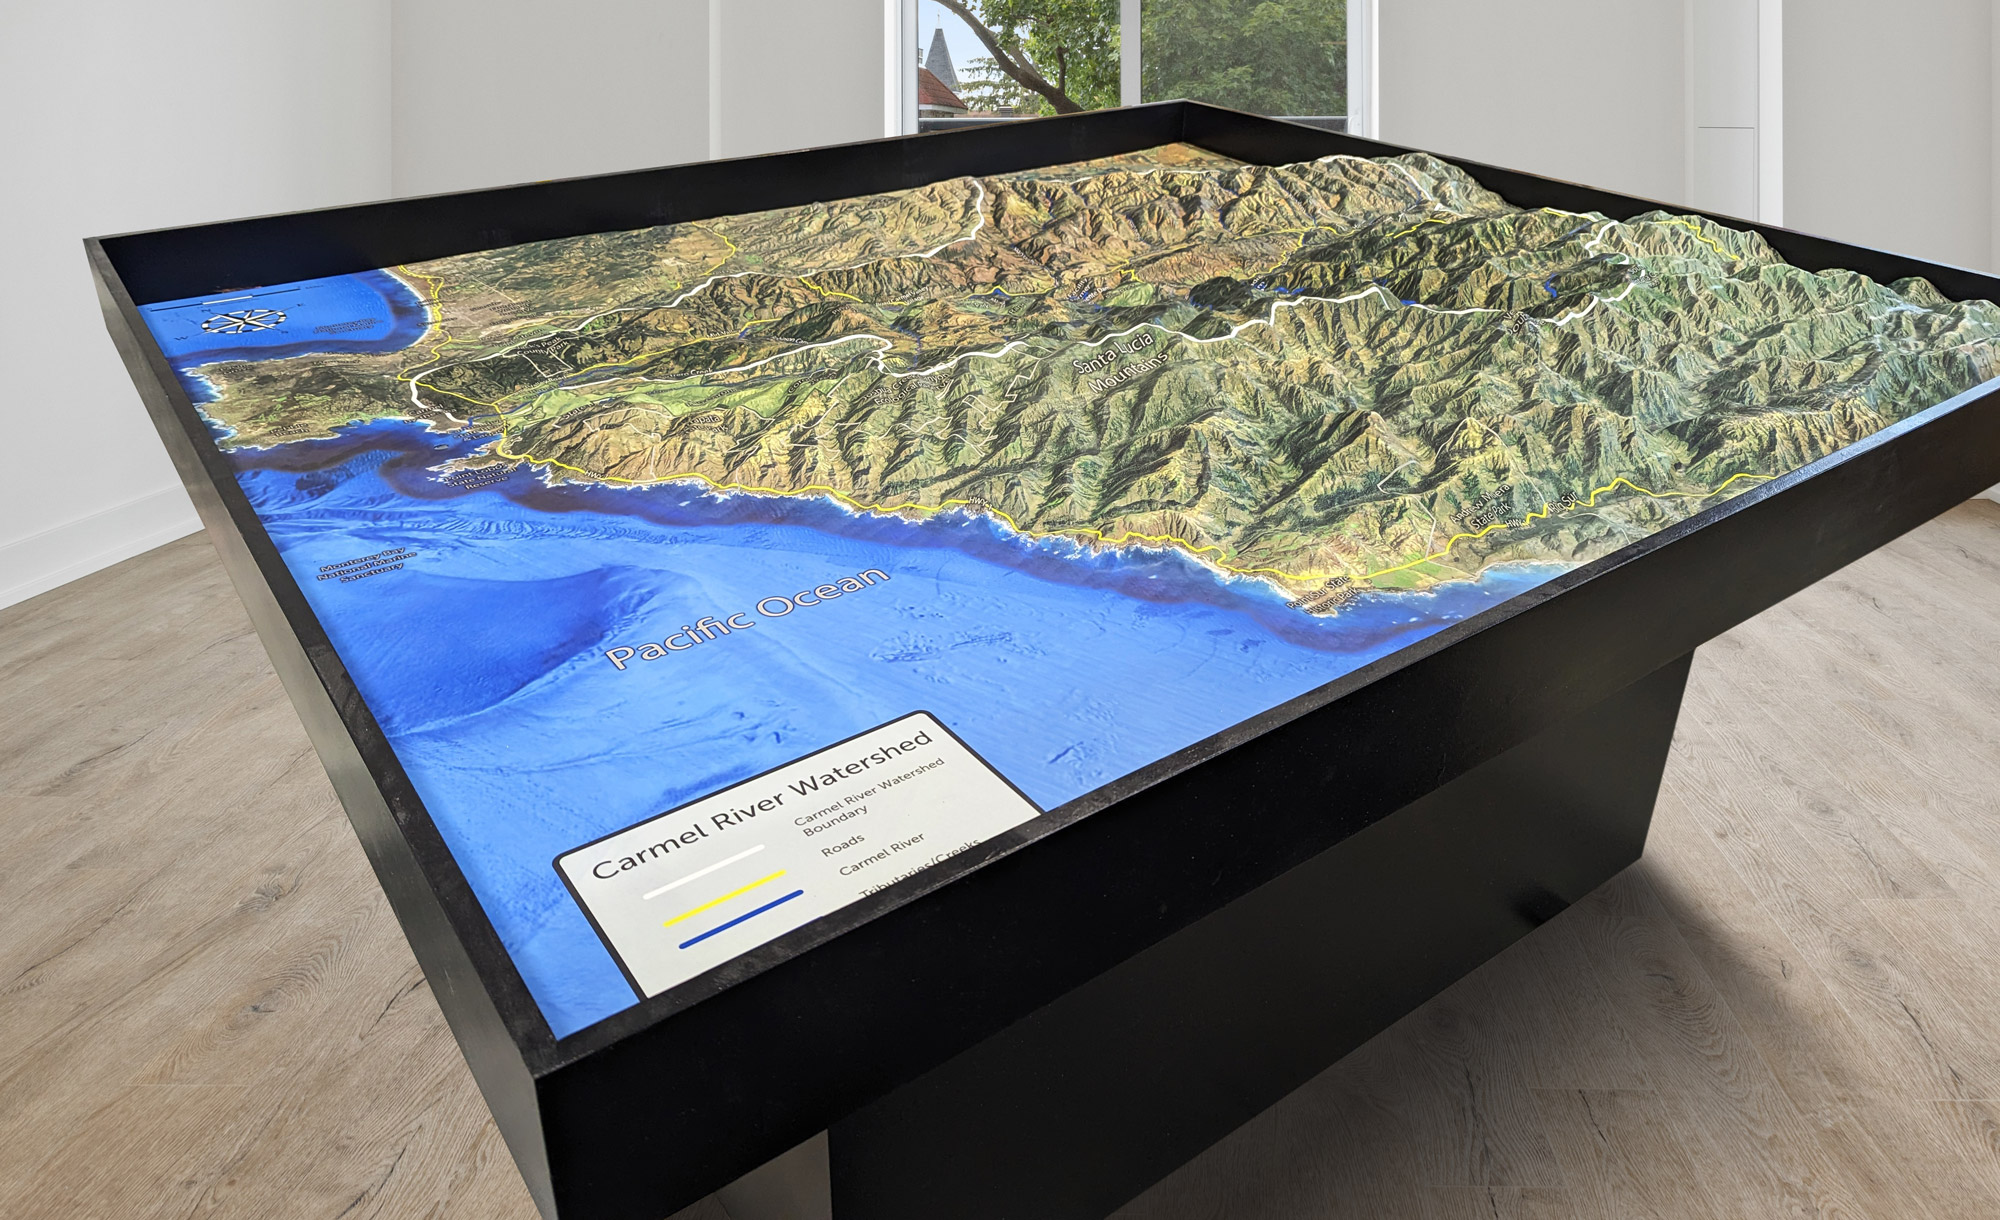
A bathymetric map, also known as a seafloor map or depth chart, is a map that depicts the contours and features of the seafloor.  These maps use a variety of data sources, including sonar, satellite imagery, and oceanographic measurements, to accurately depict the depth and shape of the ocean floor.  They are crucial for a wide range of scientific and commercial applications, from oil and gas exploration to ocean conservation and mapping the seafloor for navigation.

But bathymetric maps are more than just practical tools.  They offer a glimpse into a world that is largely hidden from human eyes, revealing a diverse range of geological formations, including undersea mountains, canyons, and ridges, as well as habitats for an astonishing variety of marine life.  These maps can help us better understand the Earth’s tectonic plates and geology, as well as the behavior of ocean currents and marine ecosystems.

Beyond their scientific value, bathymetric maps have also captured the imaginations of artists, writers, and adventurers throughout history.  They have been the inspiration for countless works of fiction and non-fiction, from Jules Verne’s “Twenty Thousand Leagues Under the Sea” to Jacques Cousteau’s “The Silent World.”  They have also been the starting point for countless expeditions and voyages of discovery, pushing the boundaries of what is known about the ocean and the life that thrives within it.

In short, bathymetric maps are more than just technical documents.  They are gateways to an incredible and mysterious world that continues to fascinate us, inspiring us to explore, discover, and protect the wonders that lie beneath the waves.

As technology continues to advance, our ability to create detailed and accurate bathymetric maps is growing exponentially.  With high-resolution sonar systems and advanced satellite imagery, we can now create three-dimensional representations of the seafloor that allow us to explore the depths of the ocean with unprecedented clarity and detail.

Lake Erie-Bathymetric Maps

These maps have also become increasingly important in the study of climate change, as they help us better understand the impact of rising sea levels and changing ocean currents on marine ecosystems and coastal communities.  By mapping the seafloor and tracking changes over time, we can gain valuable insights into the complex and interconnected systems that shape our planet.

But despite all the advances in technology, the seafloor remains largely unexplored, with vast stretches of ocean floor still unknown and unmapped. This means that there is still much to discover and explore in this mysterious world beneath the waves.

Bathymetric maps are a powerful tool for exploring the world beneath the waves.  These maps provide a detailed look at the seafloor, revealing a wealth of information about the ocean’s topography, geology, and ecology. From helping to locate hidden shipwrecks to studying the impact of climate change on marine life, bathymetric maps have a wide range of applications across a variety of fields.

  • Navigation:  One of the most important uses of bathymetric maps is in ocean exploration and navigation.  By providing accurate depictions of the seafloor, these maps can help sailors and researchers safely navigate through the world’s oceans.  They can also be used to identify potential hazards, such as underwater volcanoes or seamounts, that could pose a threat to ships and submarines.
  • Oil and Gas Exploration:  Another important use of bathymetric maps is in oil and gas exploration.  These maps can help identify potential sites for drilling and can also help to identify geological formations that may contain valuable resources.  By providing a detailed look at the seafloor, bathymetric maps can help to minimize the risk of drilling in areas that are likely to be unproductive.

Lake Huron-Bathymetric Maps

  • Study of Marine Ecology:  Bathymetric maps are also useful for studying marine ecology.  By mapping the seafloor and identifying key habitats, researchers can gain a better understanding of the complex web of life that exists in the ocean.  These maps can also help to identify areas that are particularly vulnerable to human activities, such as fishing or oil drilling, allowing policymakers to make informed decisions about how to protect these important ecosystems.
  • Fisheries Management:  Fisheries management is another important use of bathymetric maps.  By mapping the seafloor, fisheries managers can identify areas where fish congregate, such as seamounts and underwater canyons.  This information can be used to manage fisheries more effectively, by setting catch limits and fishing quotas in areas where fish populations are concentrated.
  • Climate Change:  One area where bathymetric maps have had a particularly significant impact is in the study of climate change.  By mapping the seafloor and tracking changes over time, researchers can gain valuable insights into the impact of rising sea levels and changing ocean currents on marine ecosystems and coastal communities.  Bathymetric maps can also help to identify areas that are at risk of flooding or erosion, allowing policymakers to make informed decisions about how to adapt to the effects of climate change.
  • Environmental Management:  Bathymetric maps are also used for environmental management.  By mapping the seafloor and tracking changes over time, scientists can better understand the impacts of human activities on the ocean.  For example, maps can identify areas where pollution is concentrated, allowing authorities to take action to protect the environment.
  • Scientific Research:  Bathymetric maps are an essential tool for scientific research.  They provide researchers with detailed information about the seafloor, which can be used to study everything from the geology of the ocean to the behavior of marine animals.  By knowing the depth and shape of the seafloor, scientists can plan research expeditions and design experiments more effectively.
  • Military Applications:  Bathymetric maps are also used by the military for a variety of applications.  For example, the maps can be used to plan submarine operations, identify potential landing sites for amphibious assaults, and avoid underwater hazards.  The maps can also be used to identify potential locations for undersea cables and other infrastructure.

Sample 2D Bathymetric Maps

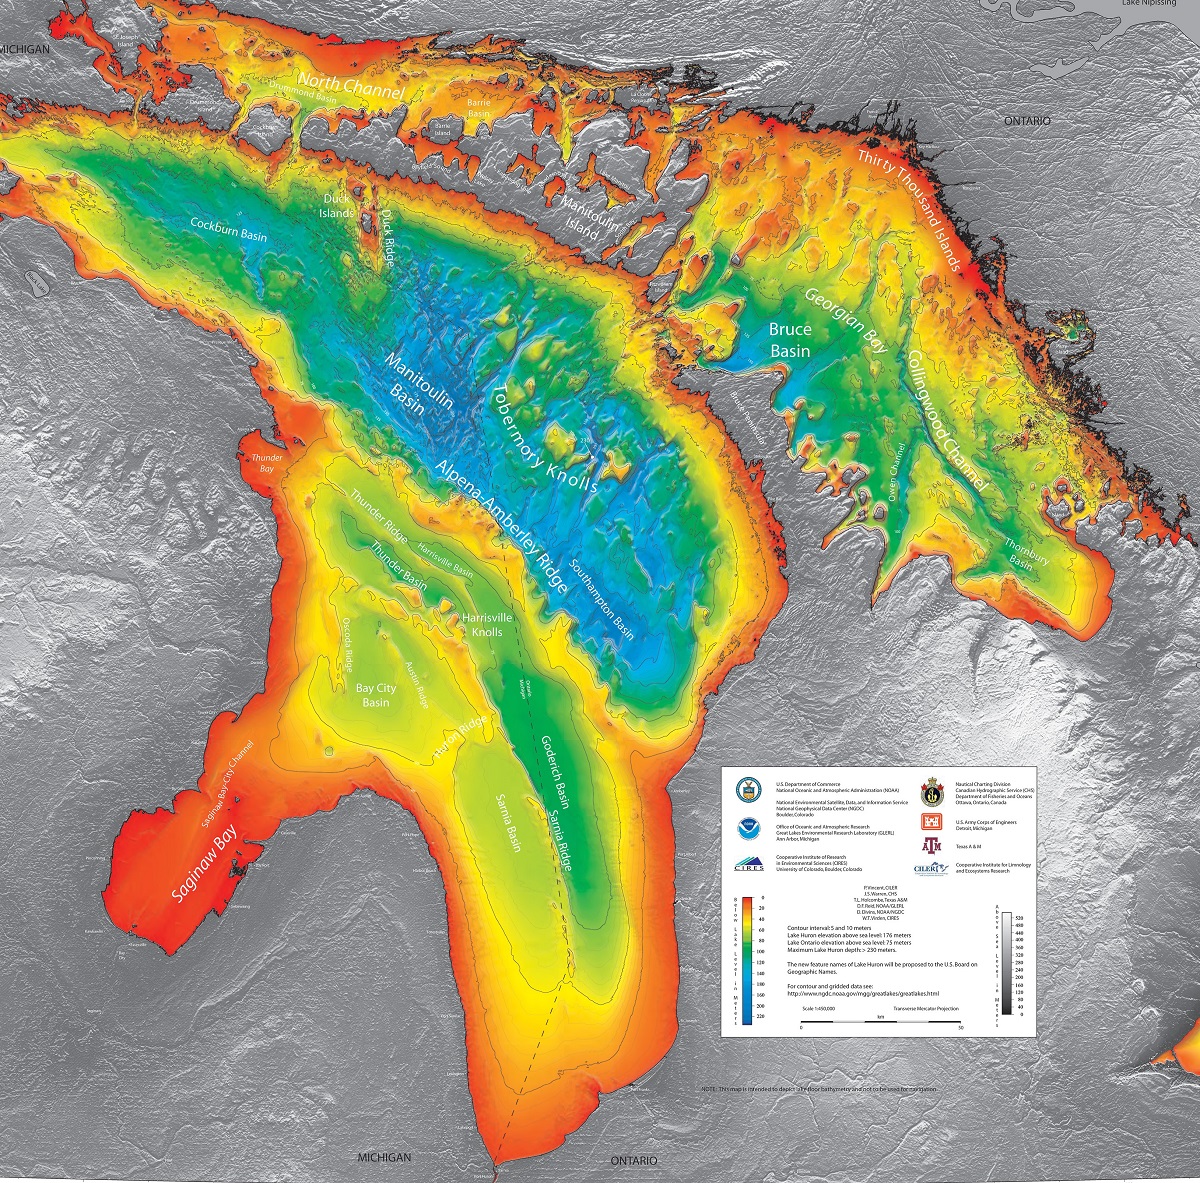
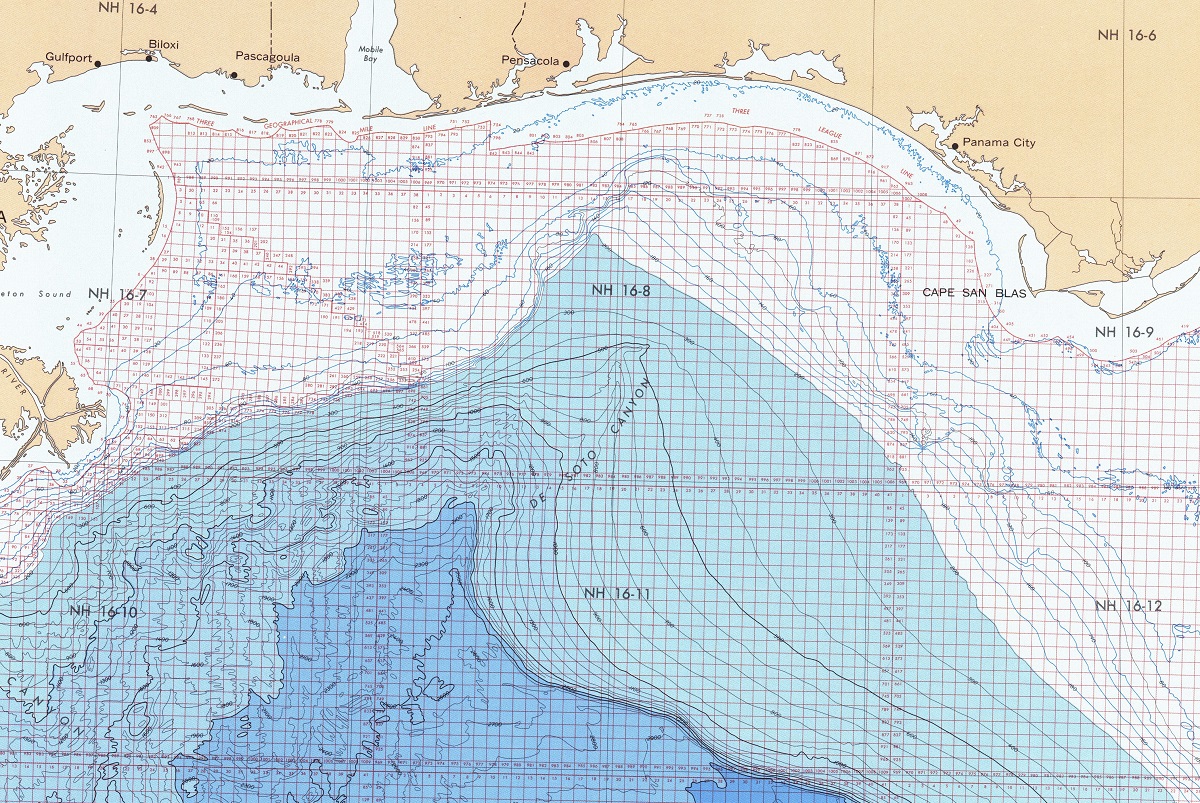
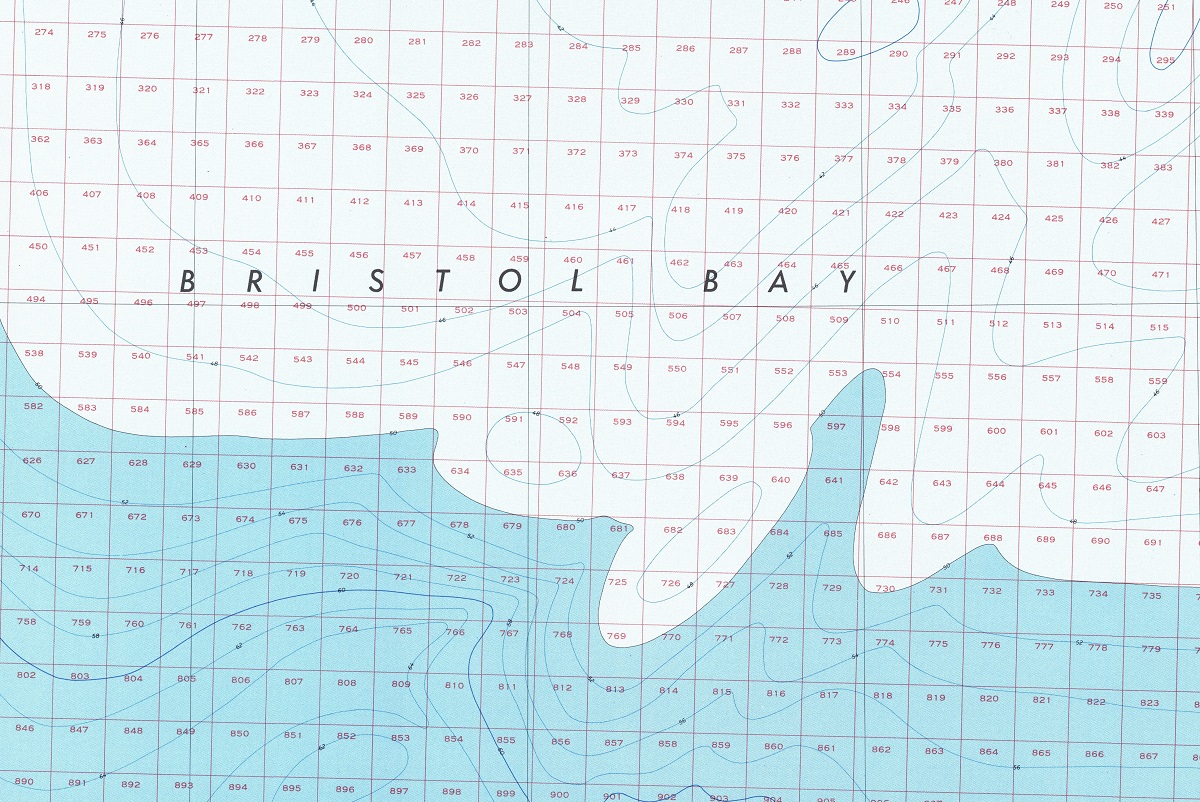
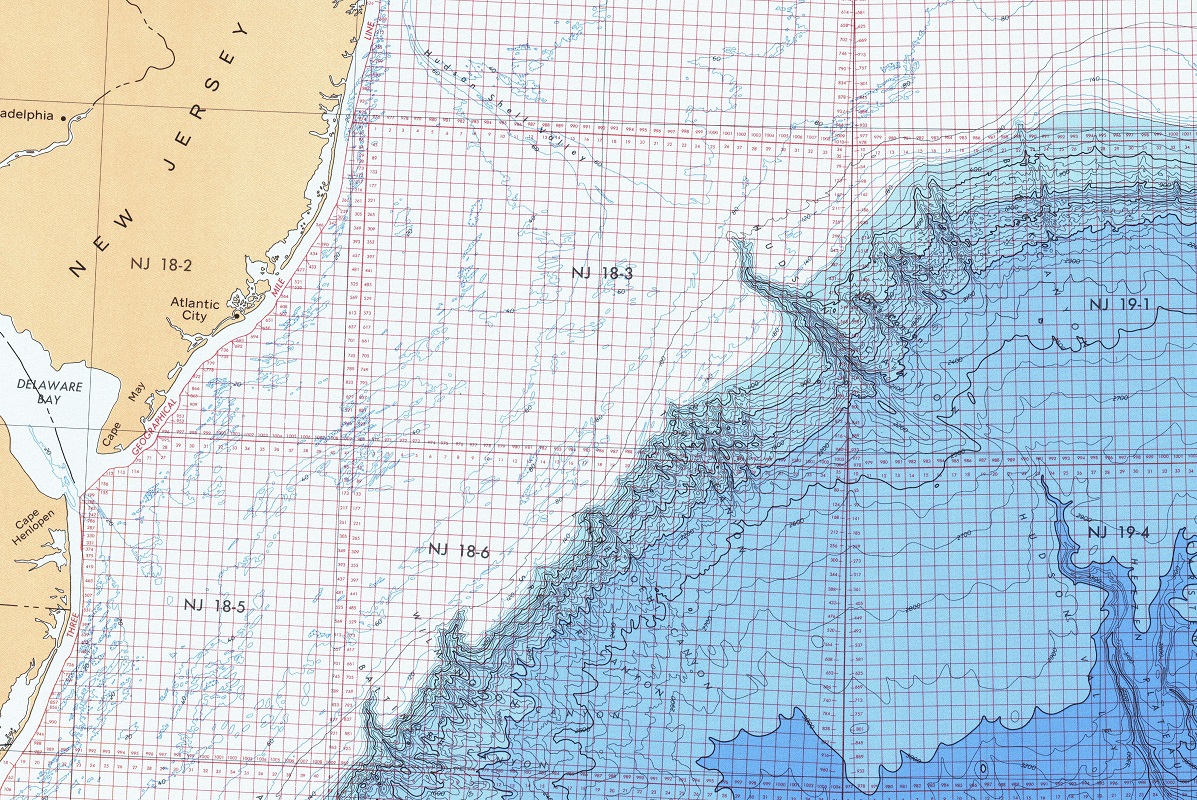
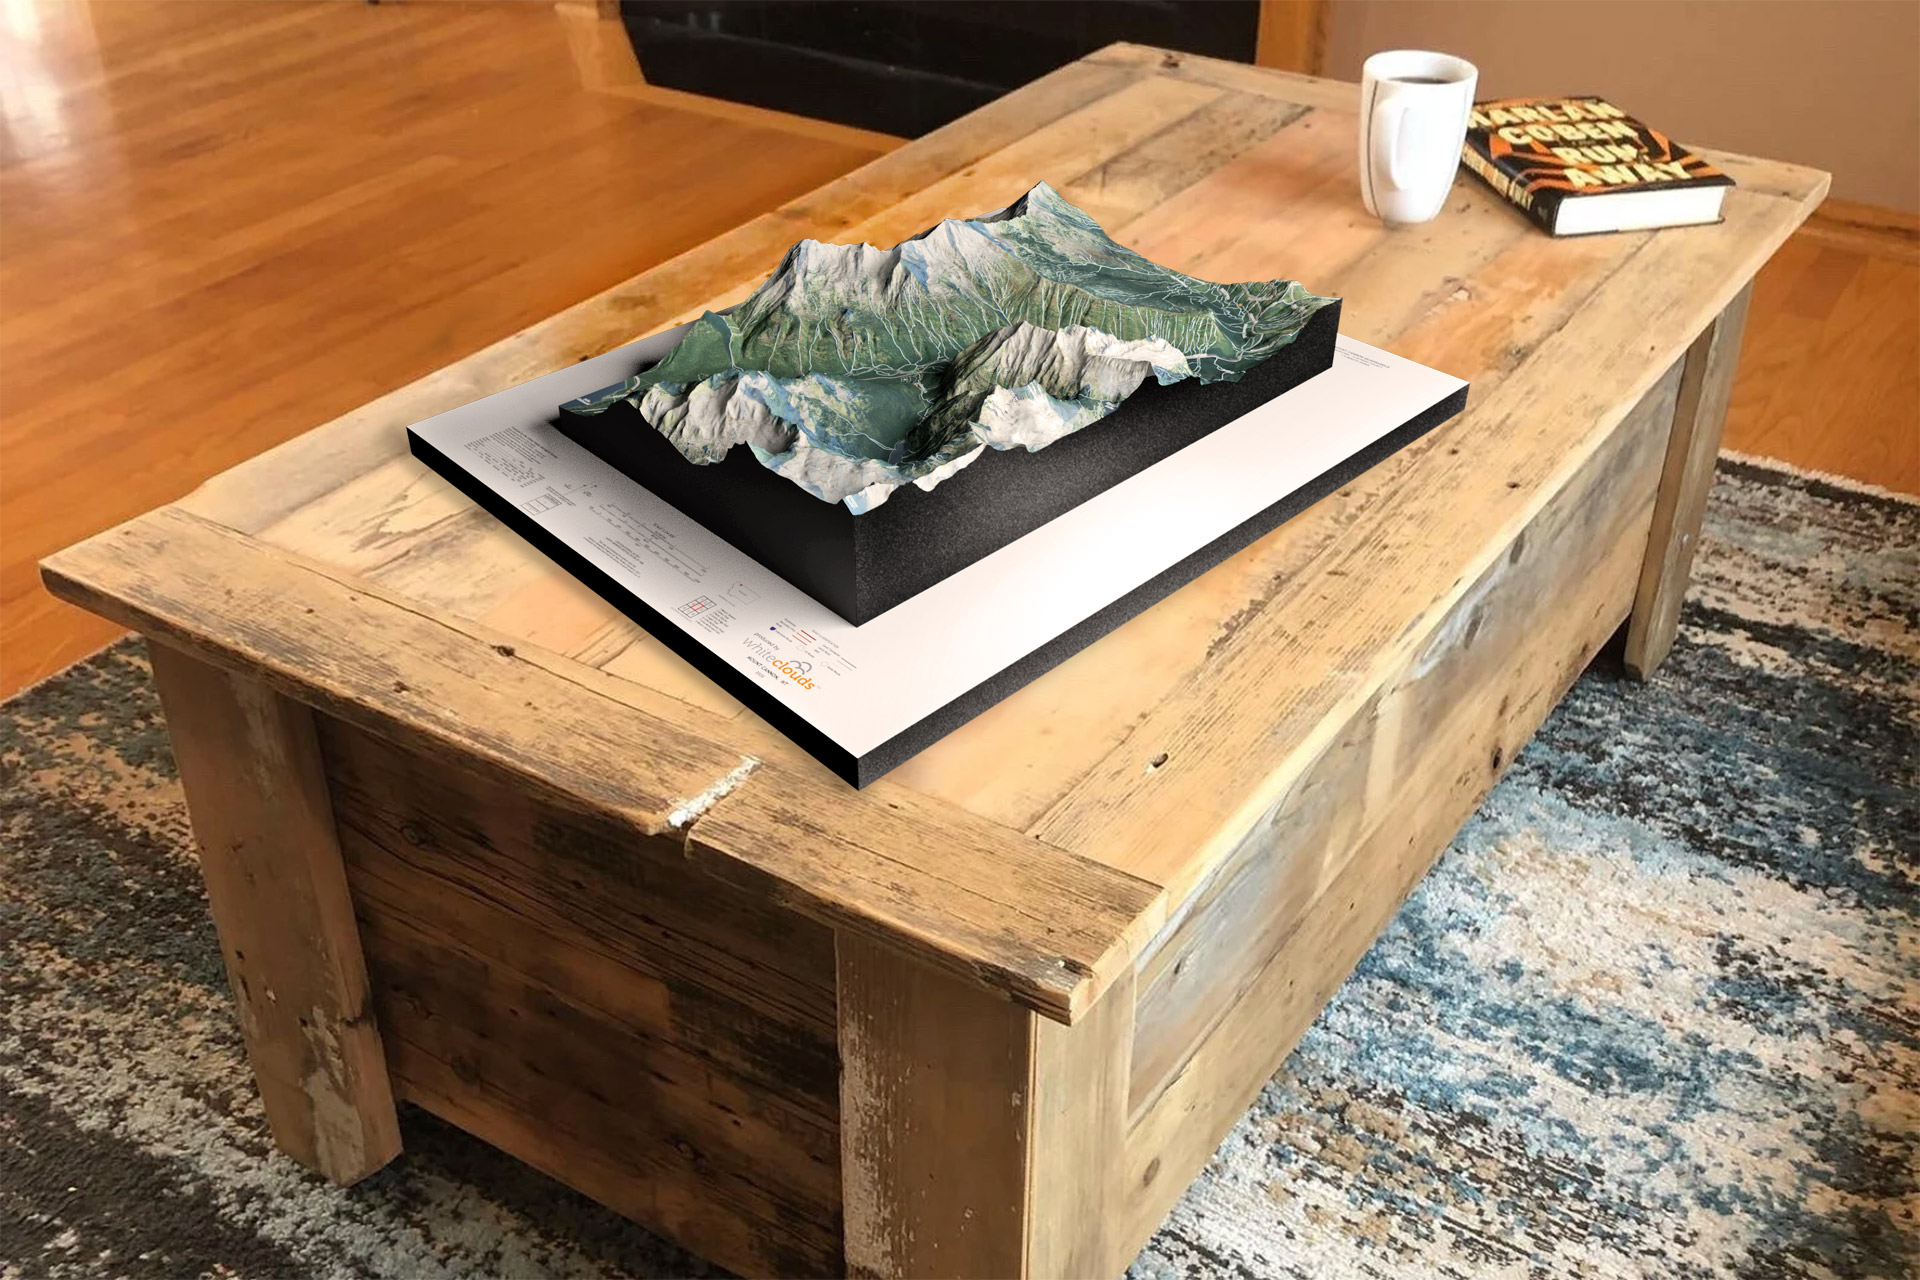
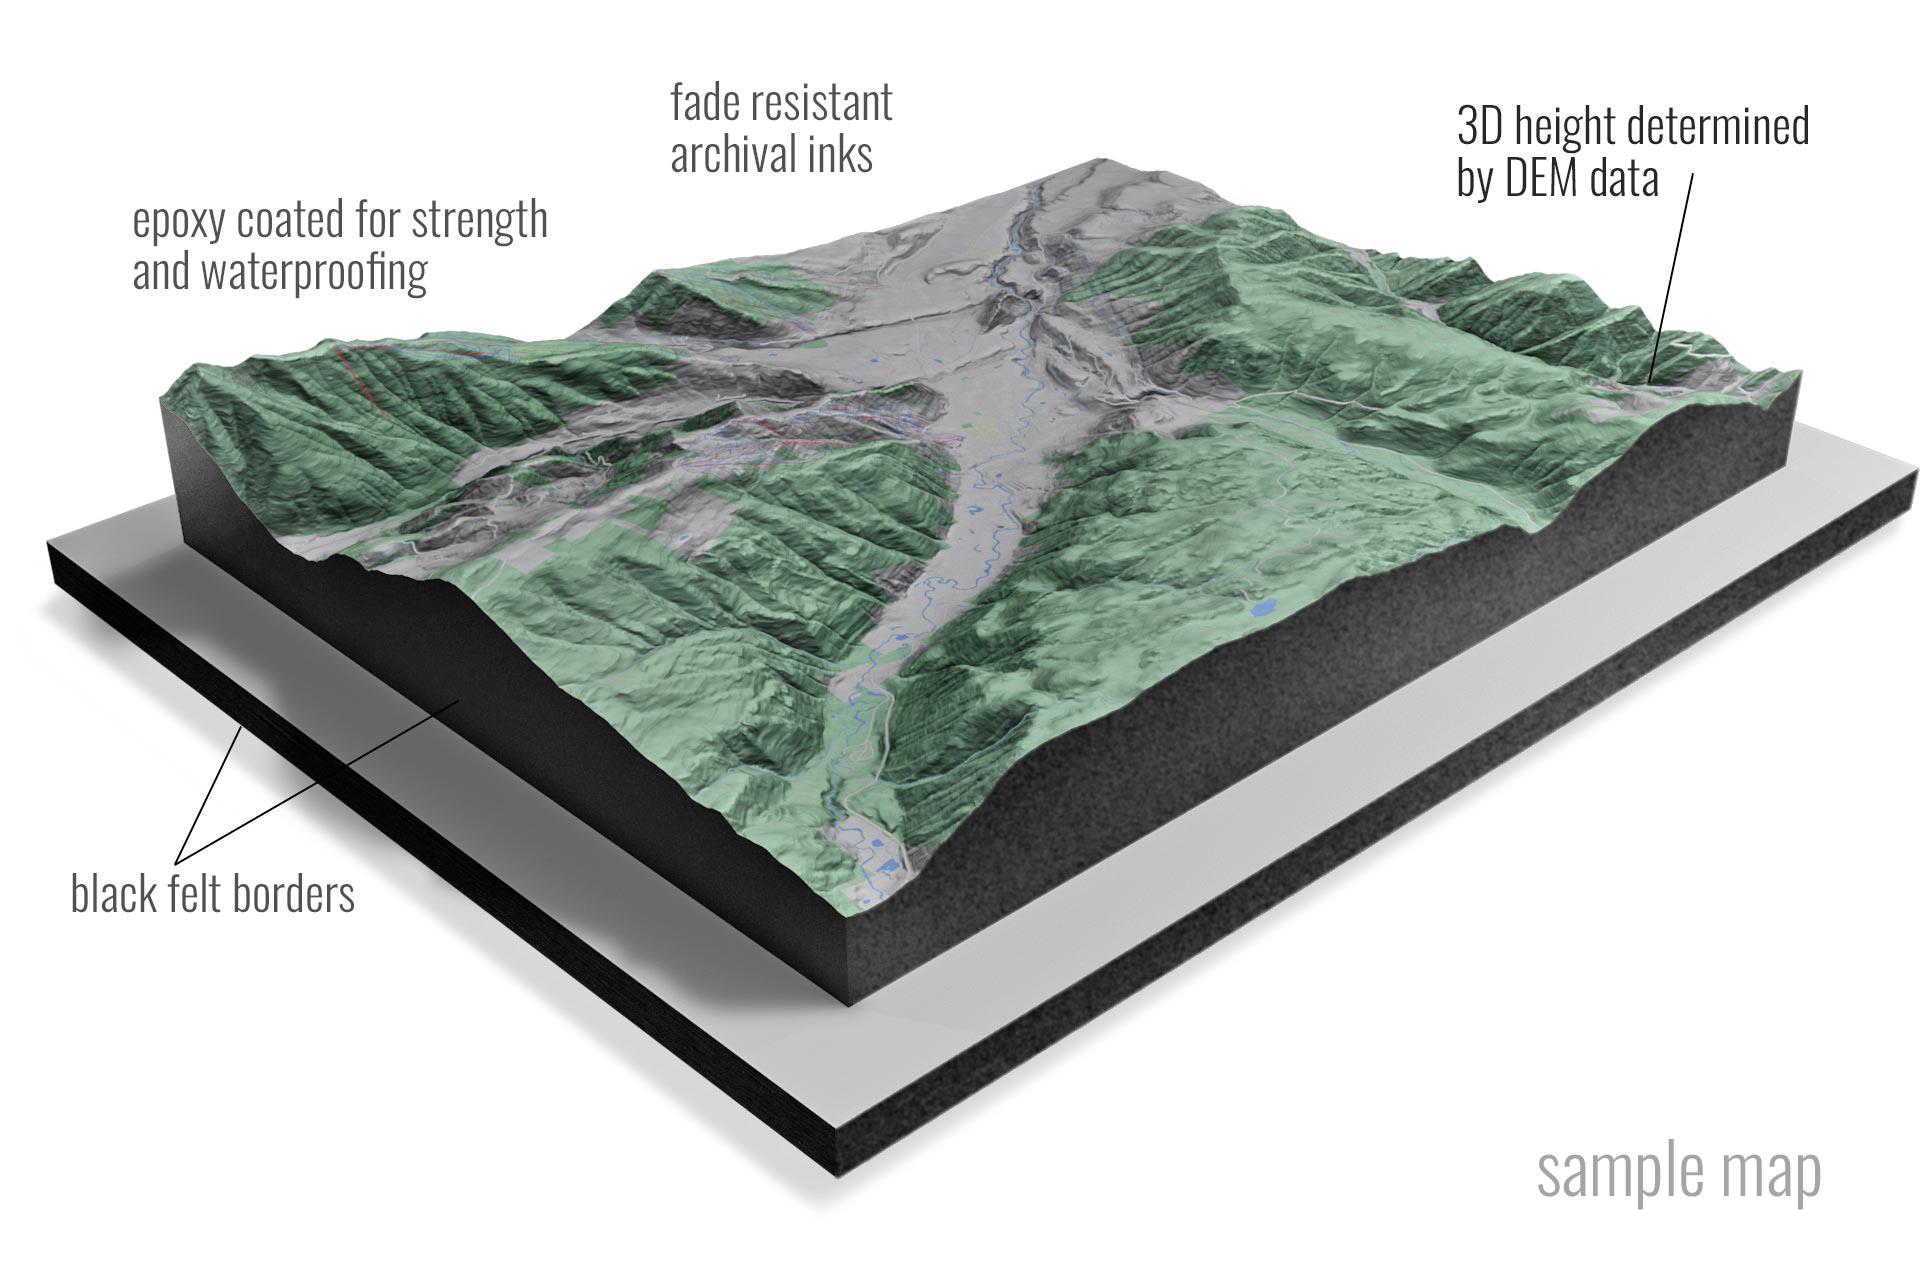
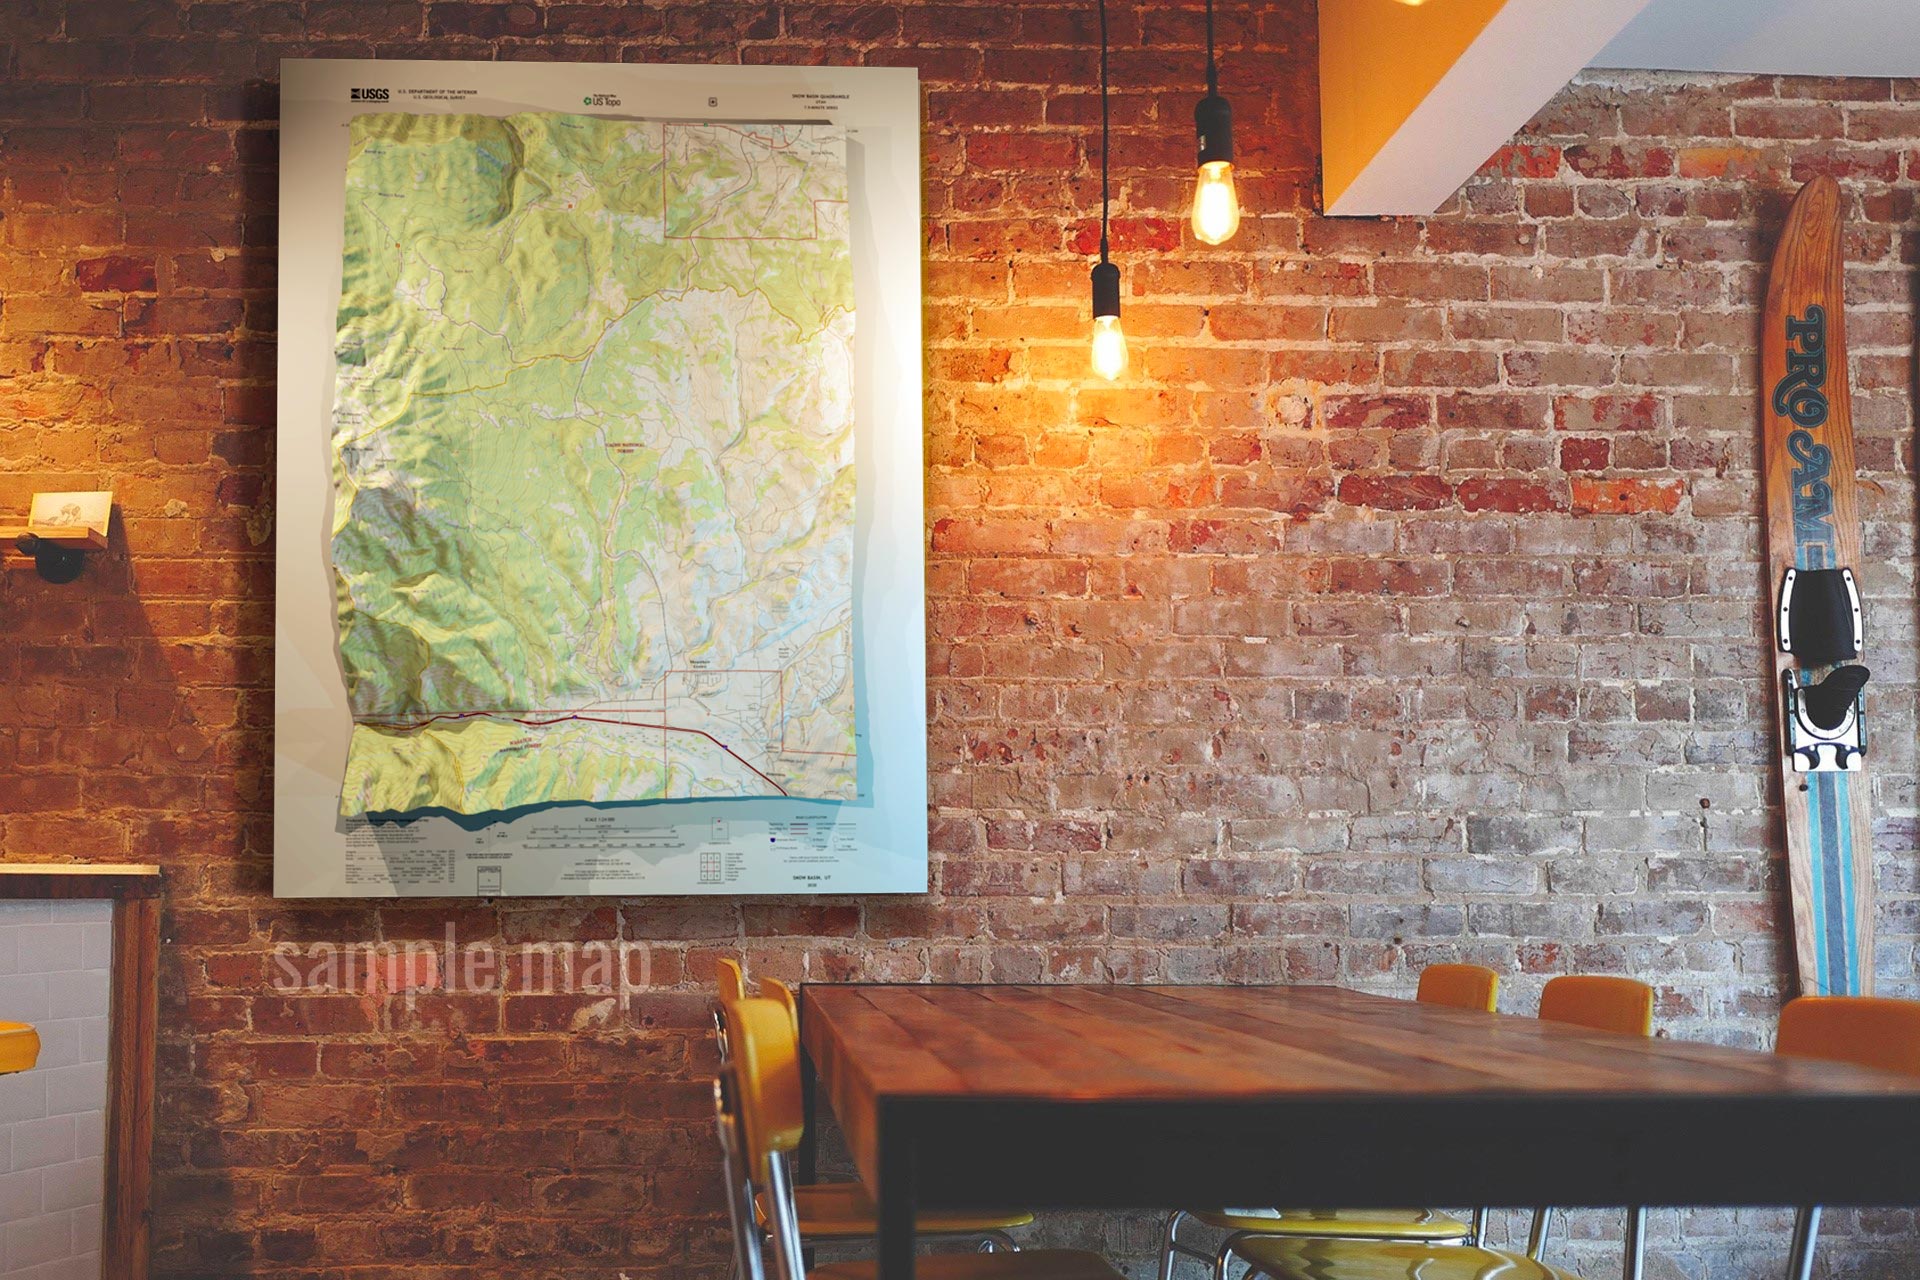
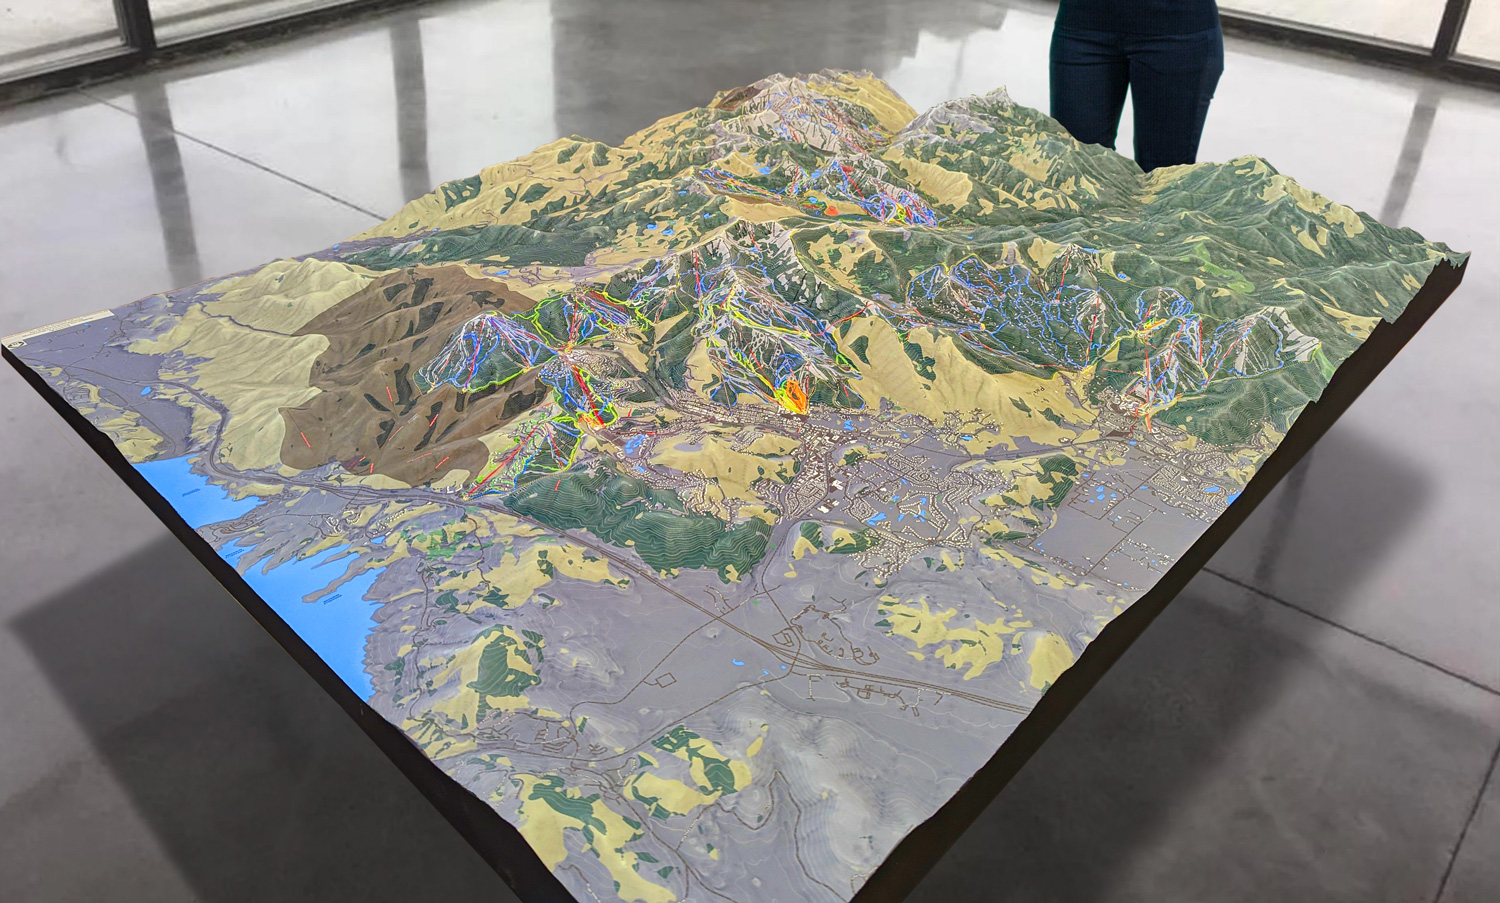
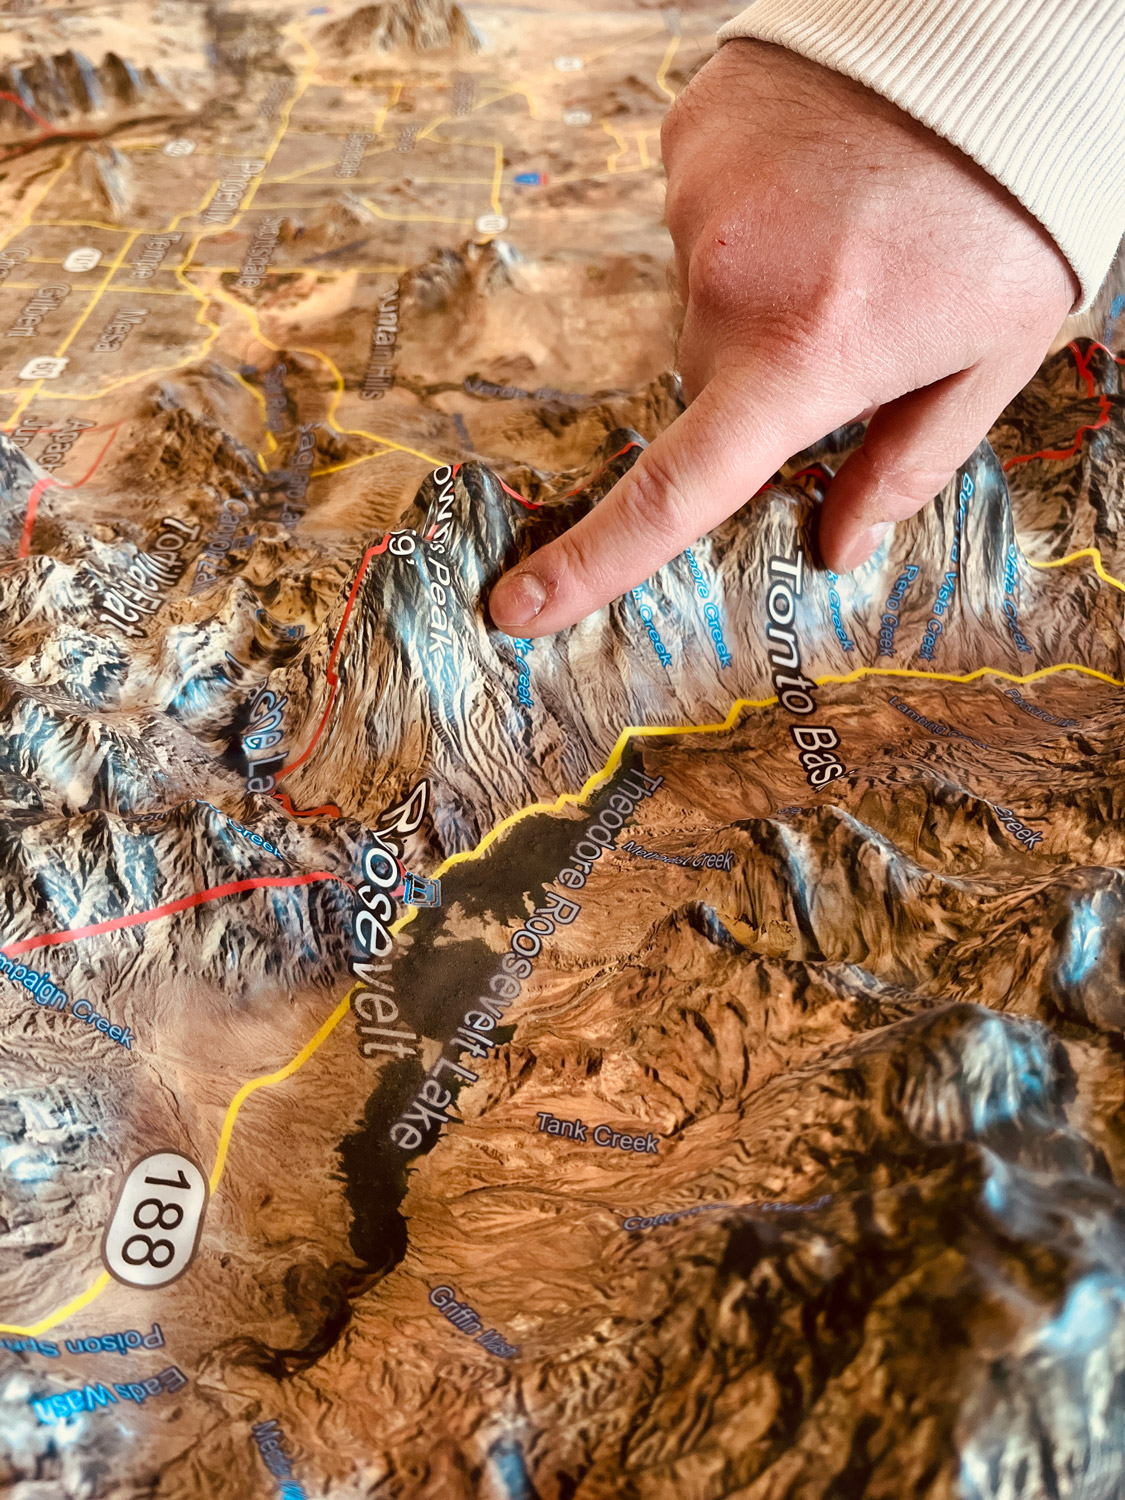
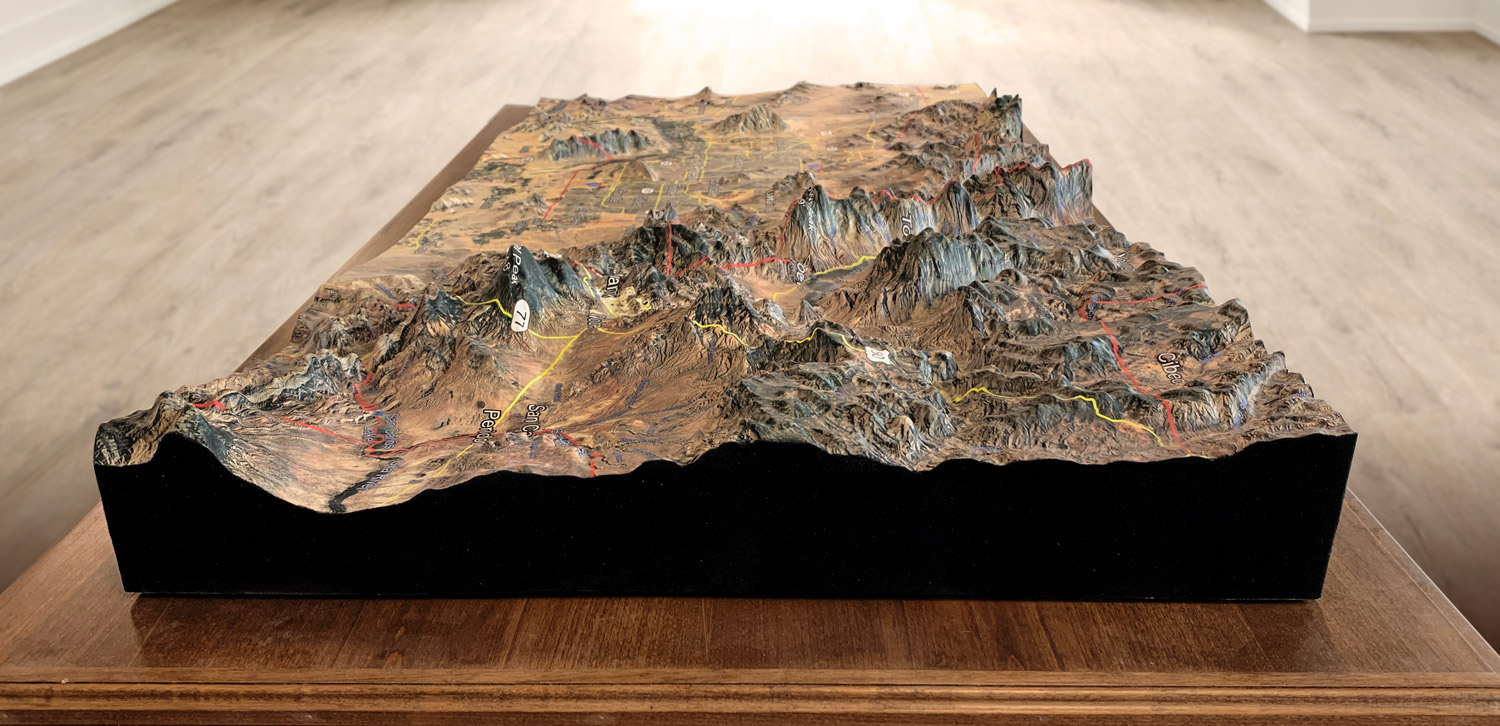
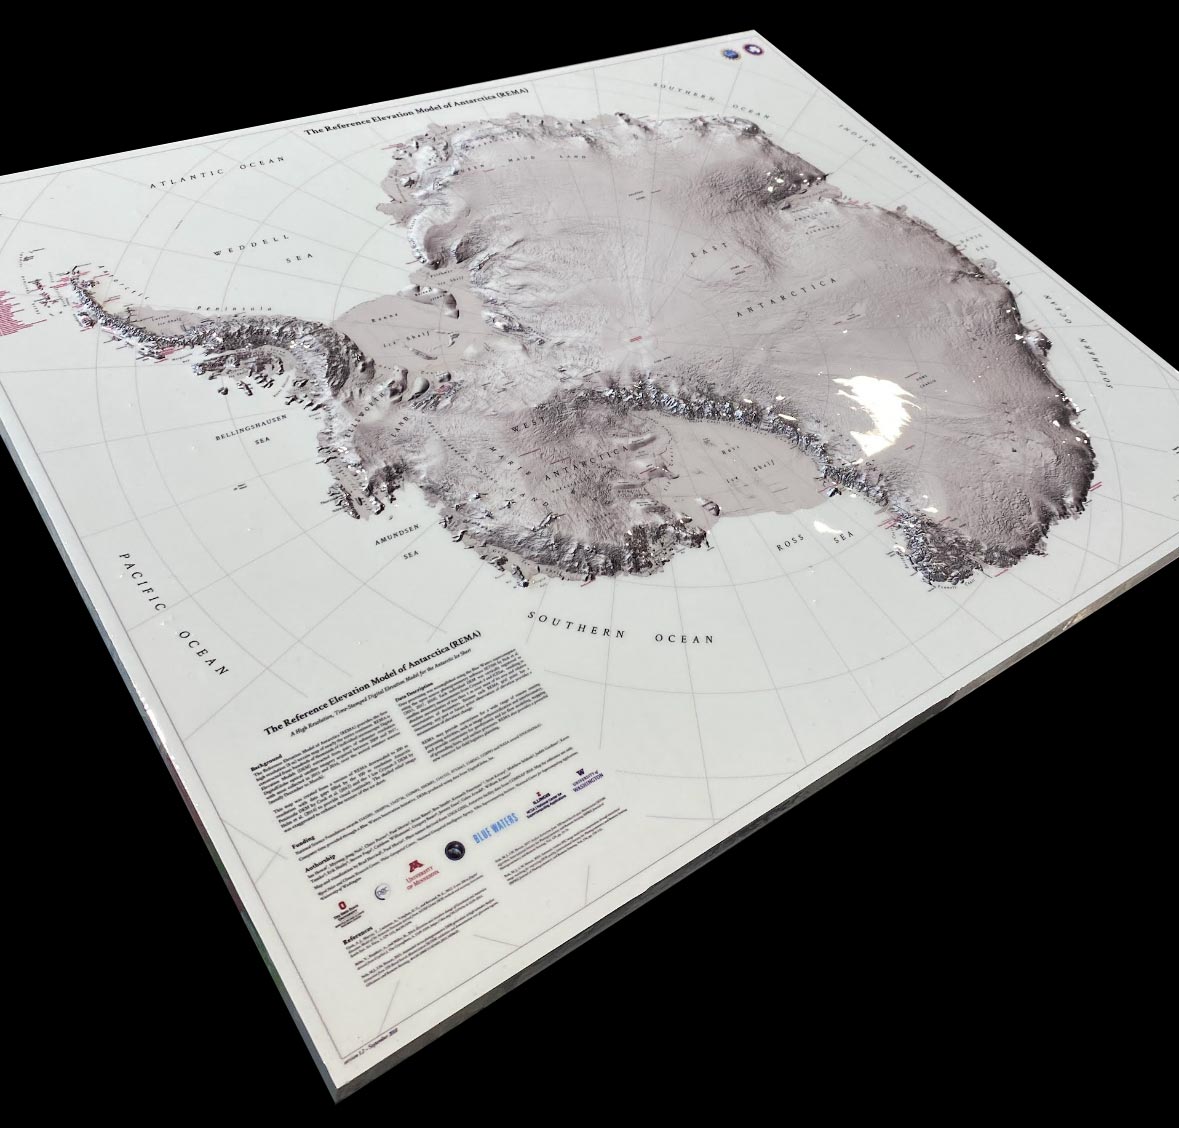
Bathymetric maps are unique maps that reveal the topography of the ocean floor, providing insights into the ocean’s depths that were previously unknown.  These maps are created using a combination of technologies that measure the depth and shape of the seafloor, allowing us to understand its complex features and the fascinating geological processes that shape our oceans. Here are some of the features of bathymetric maps that make them such a valuable tool for marine exploration and research.

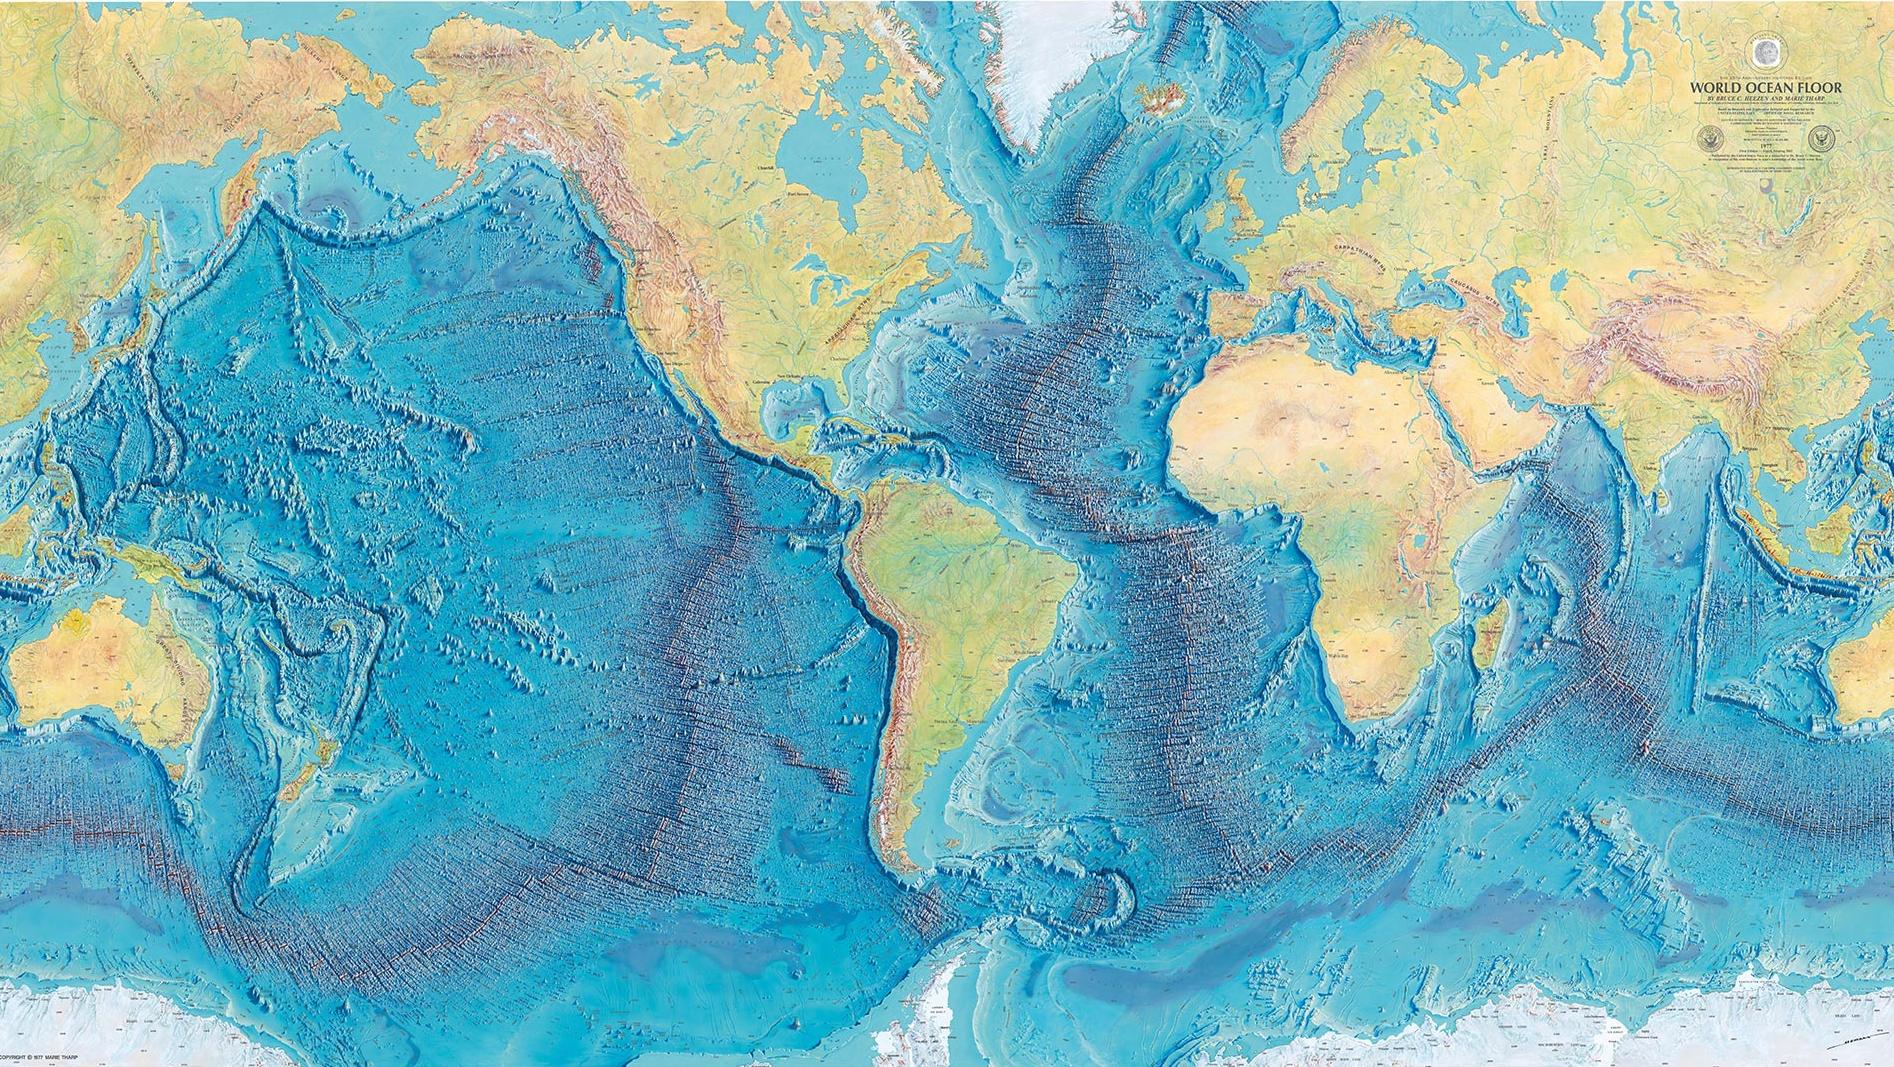
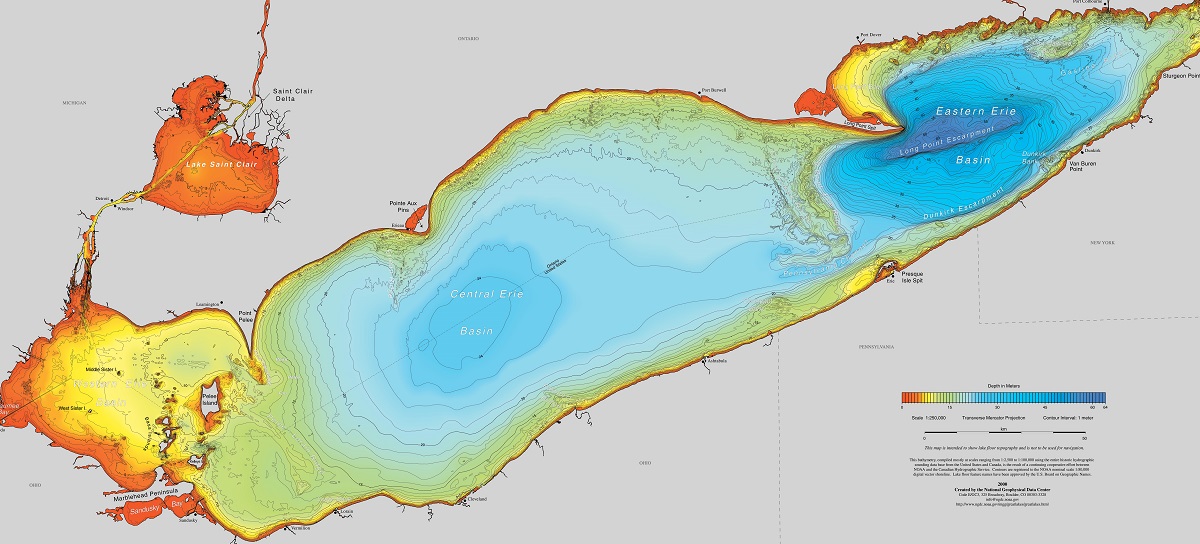
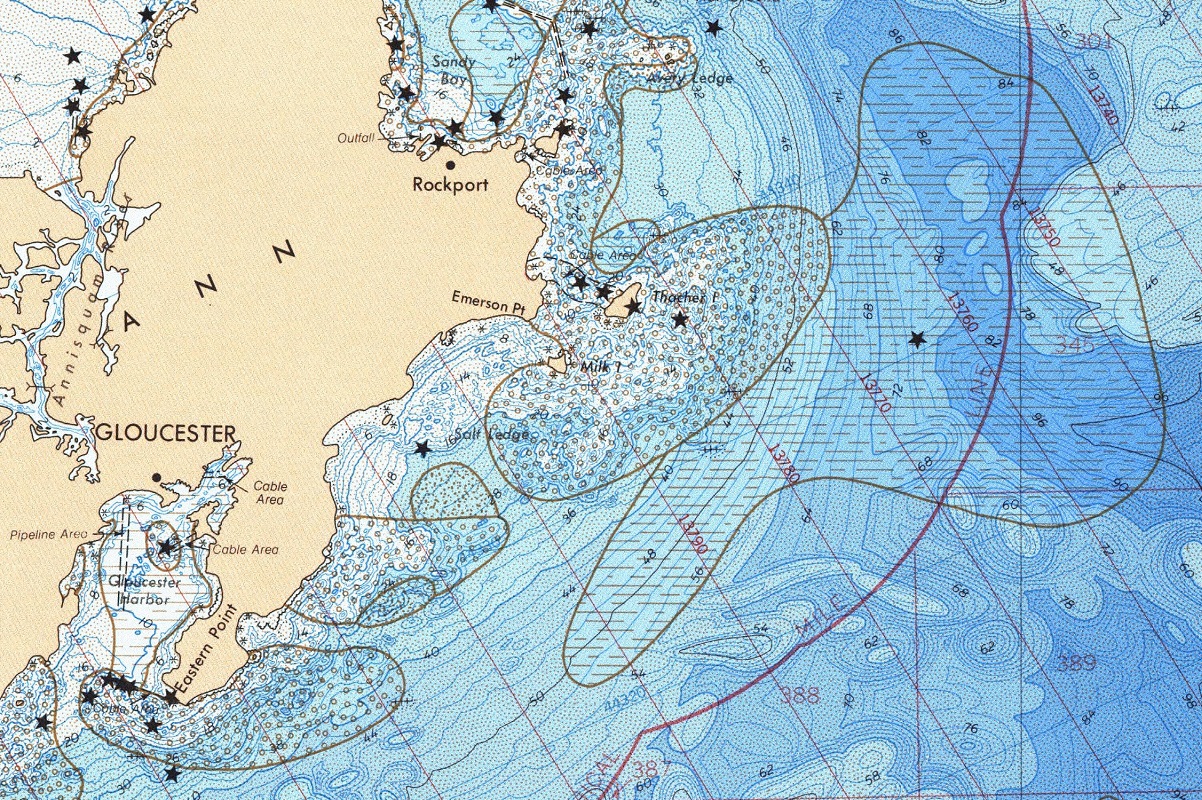
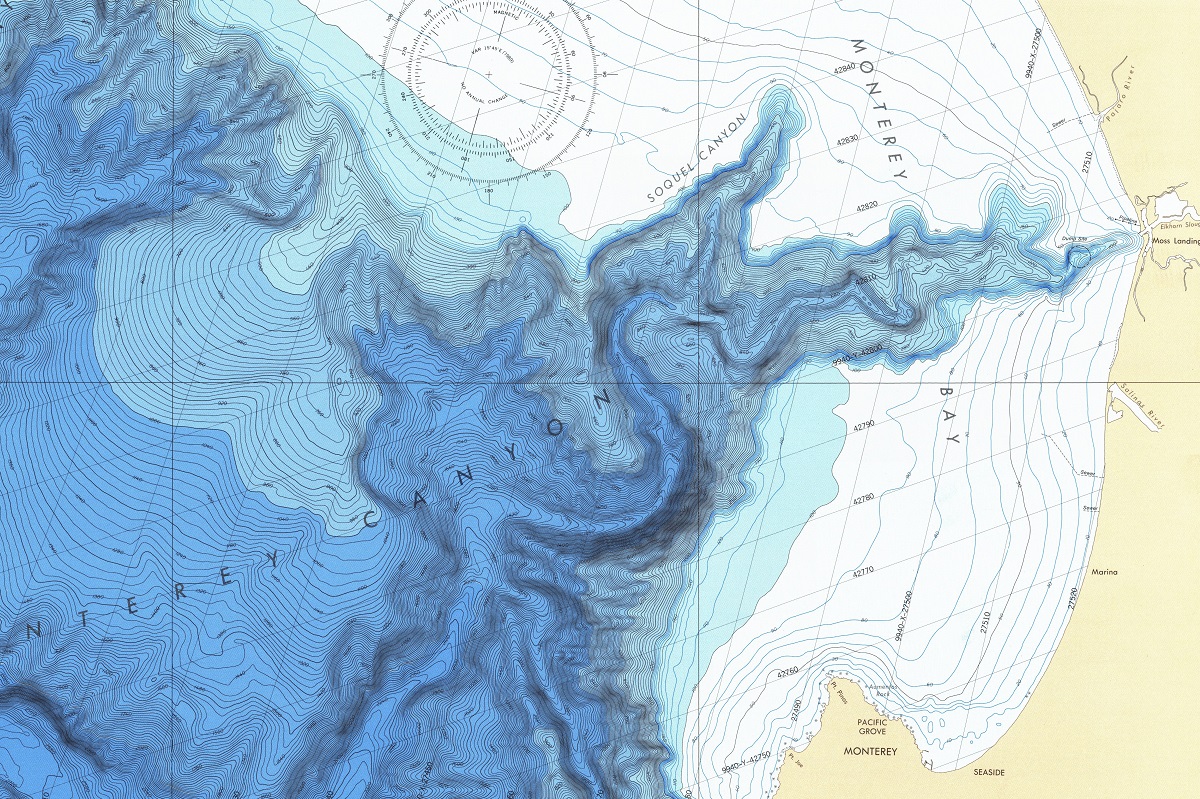
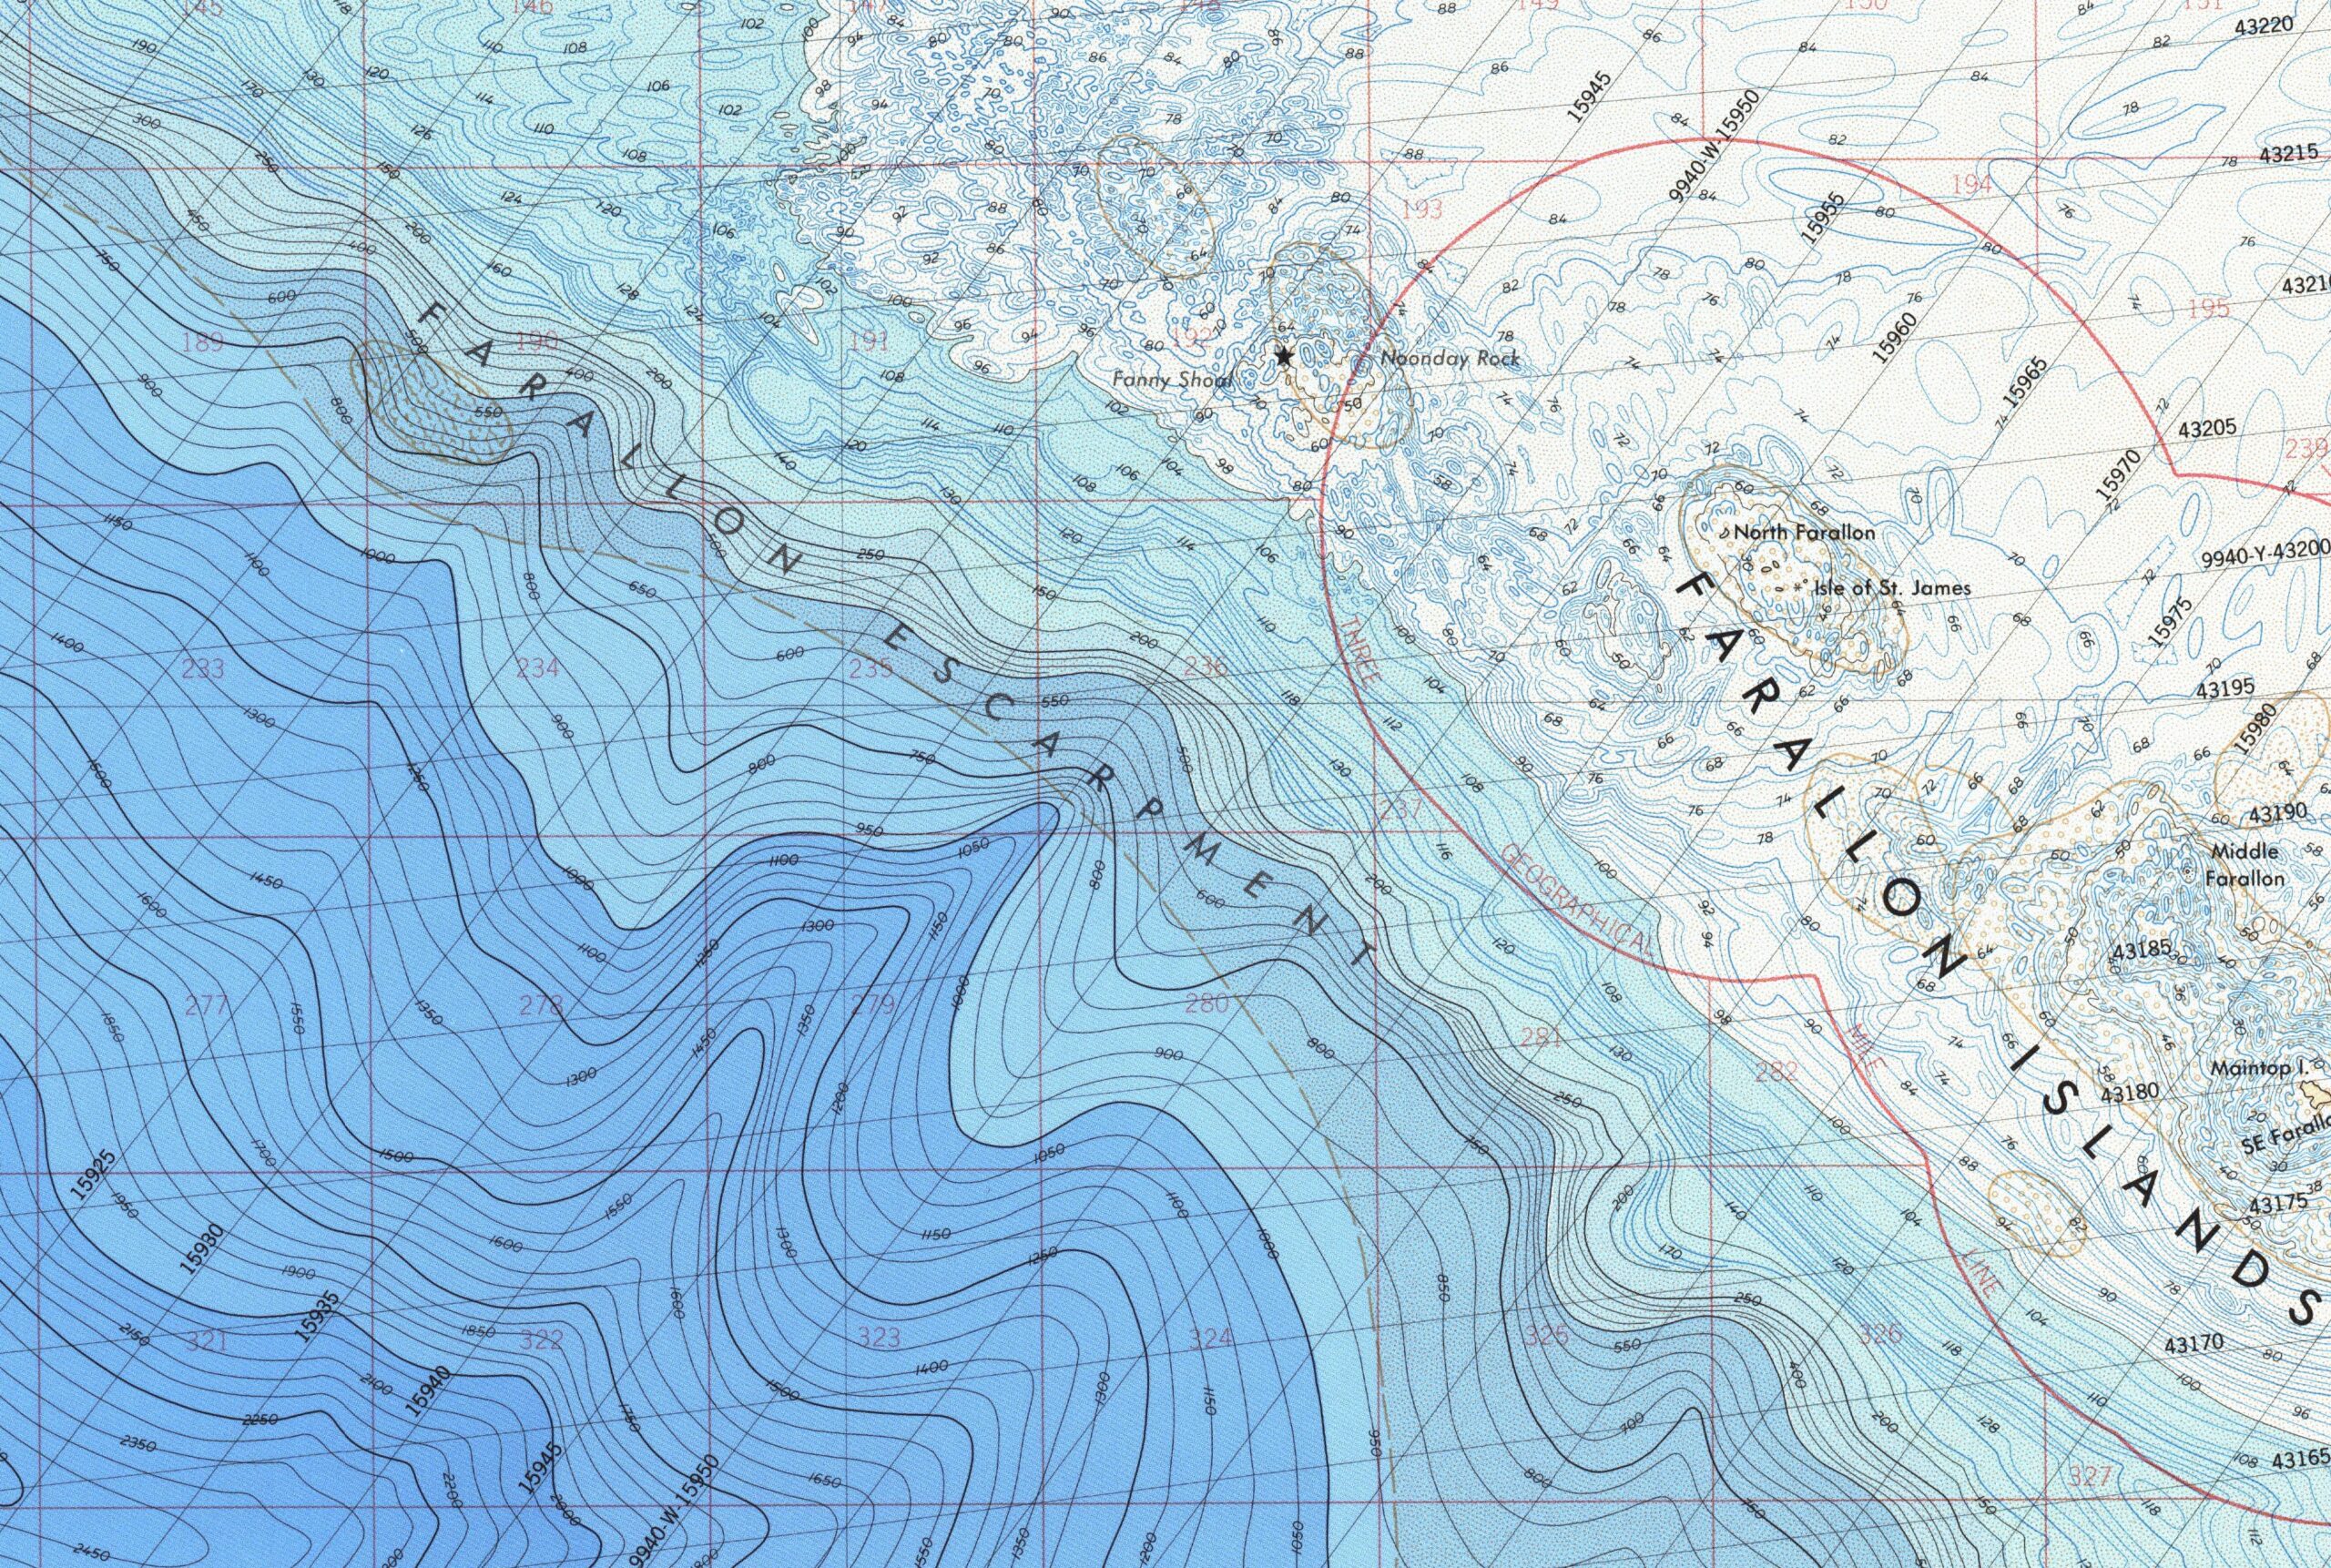
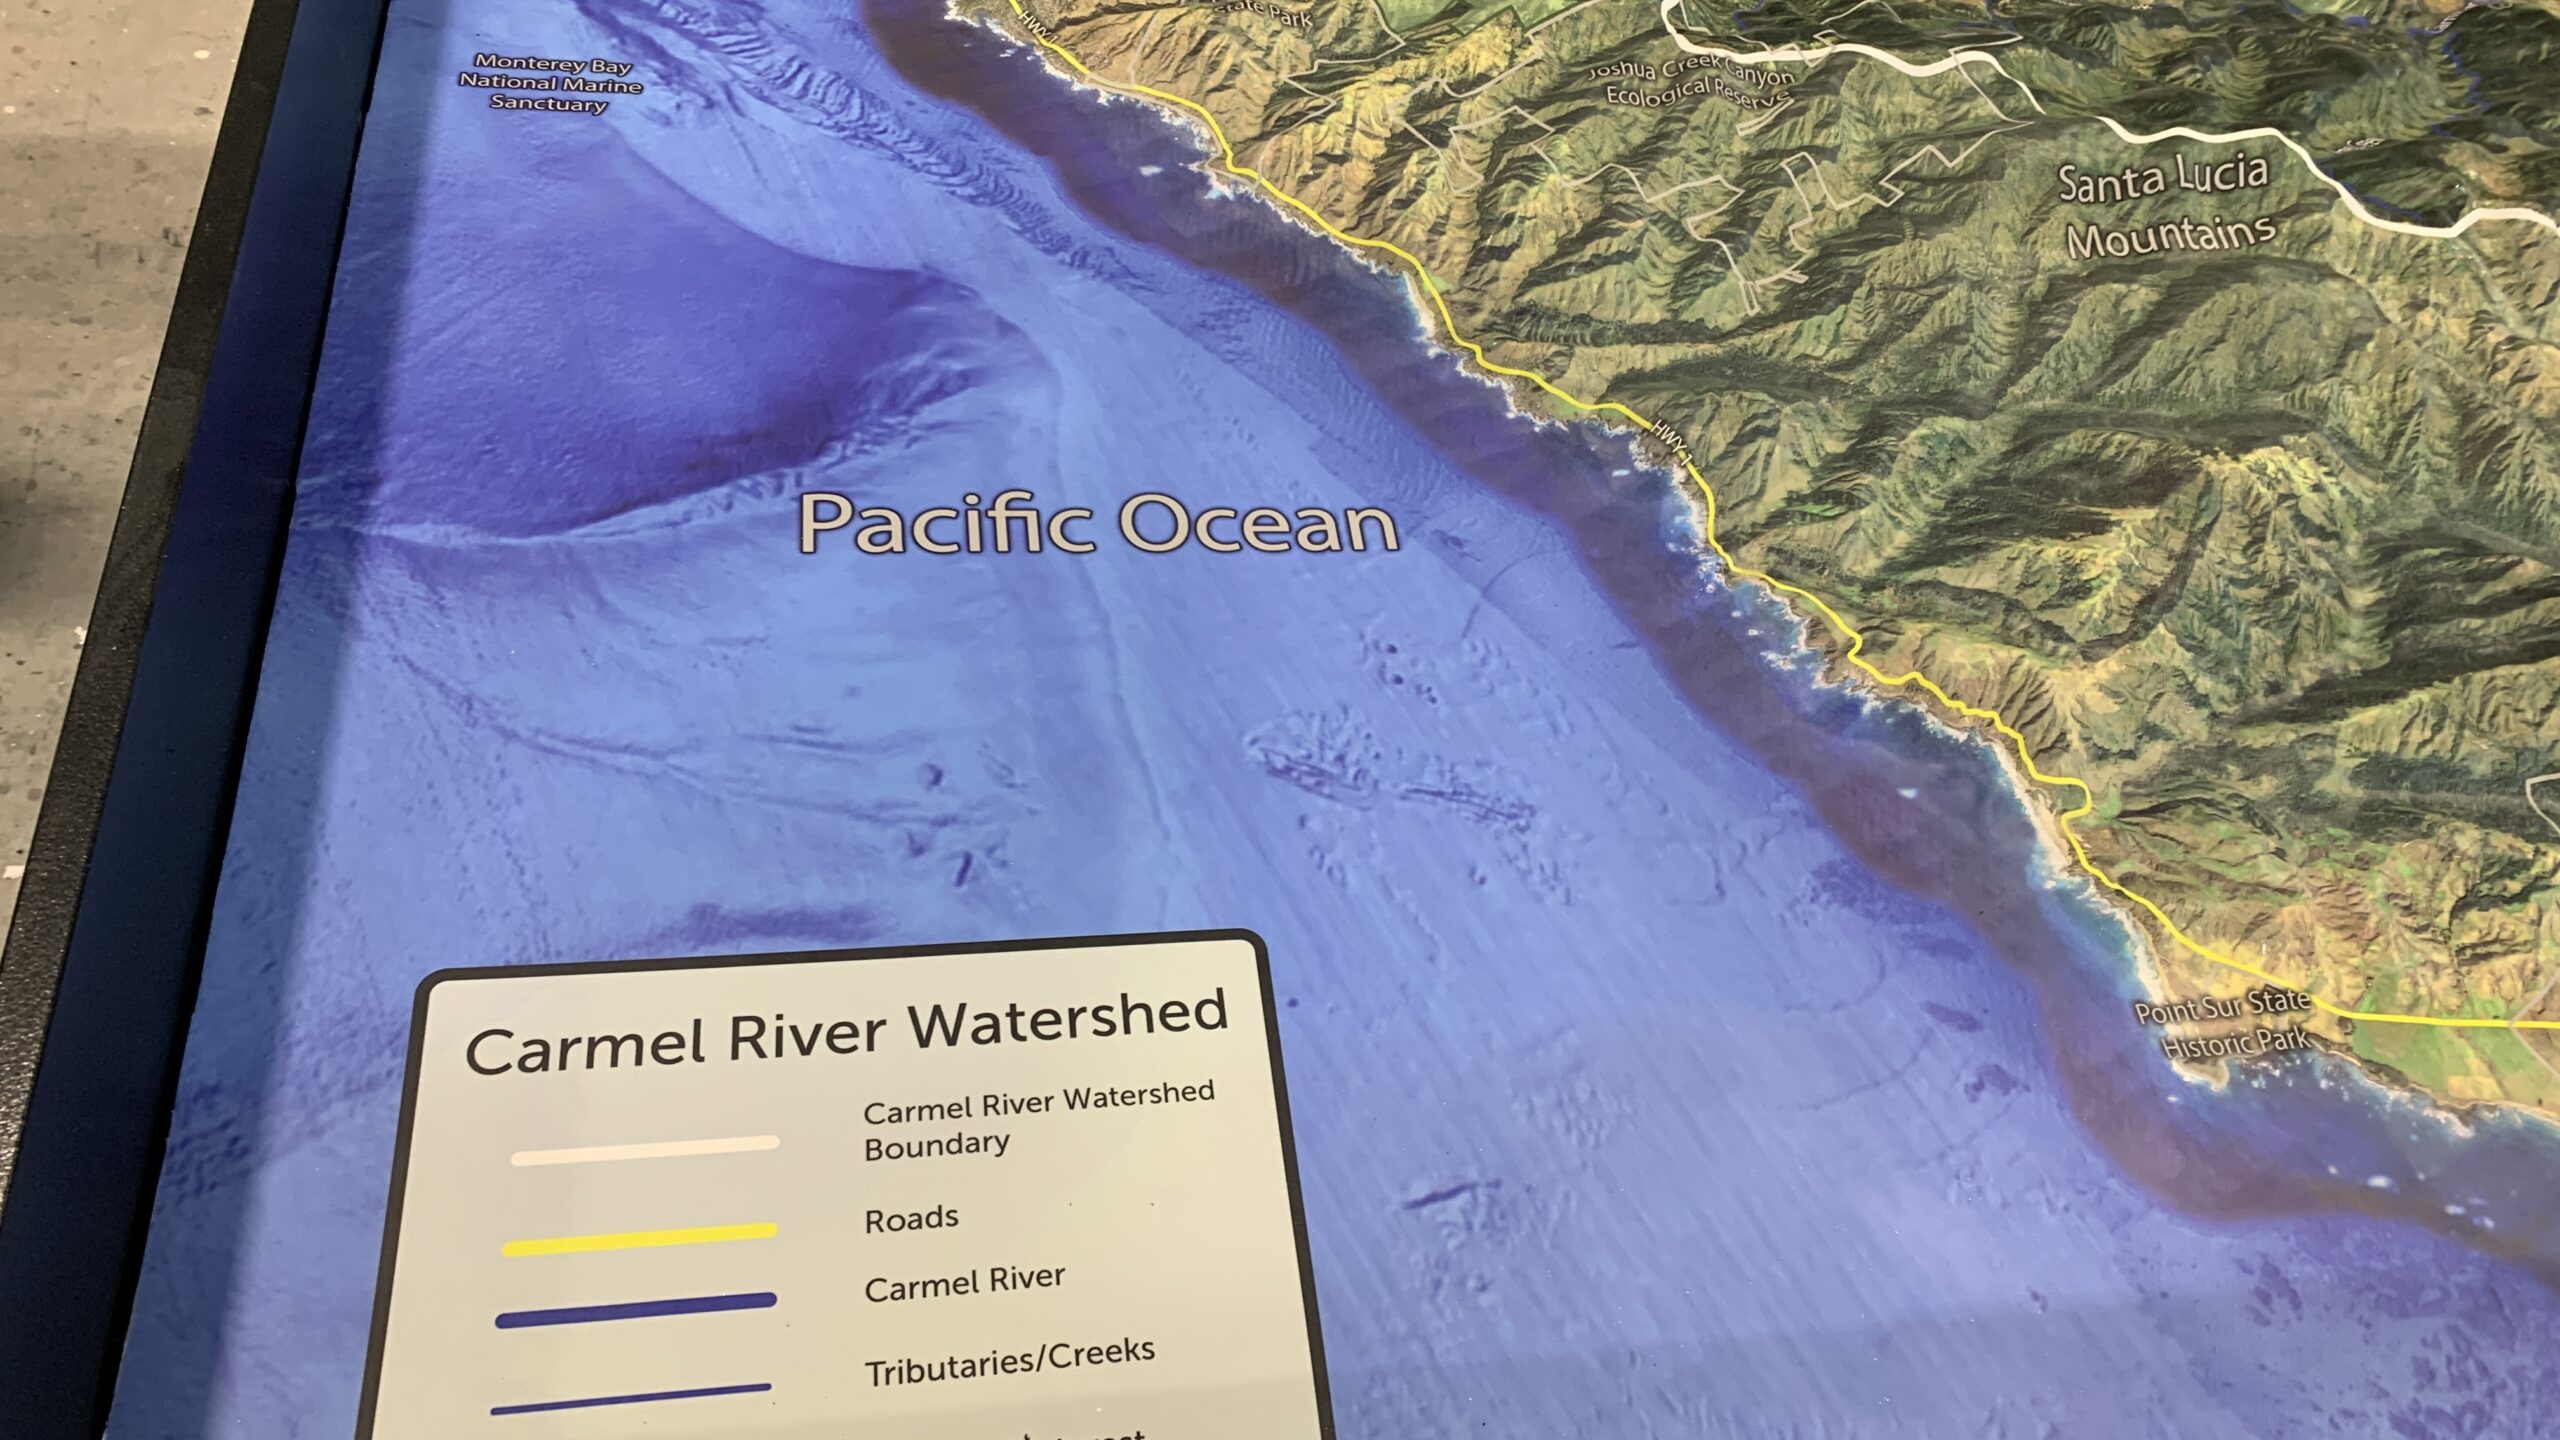
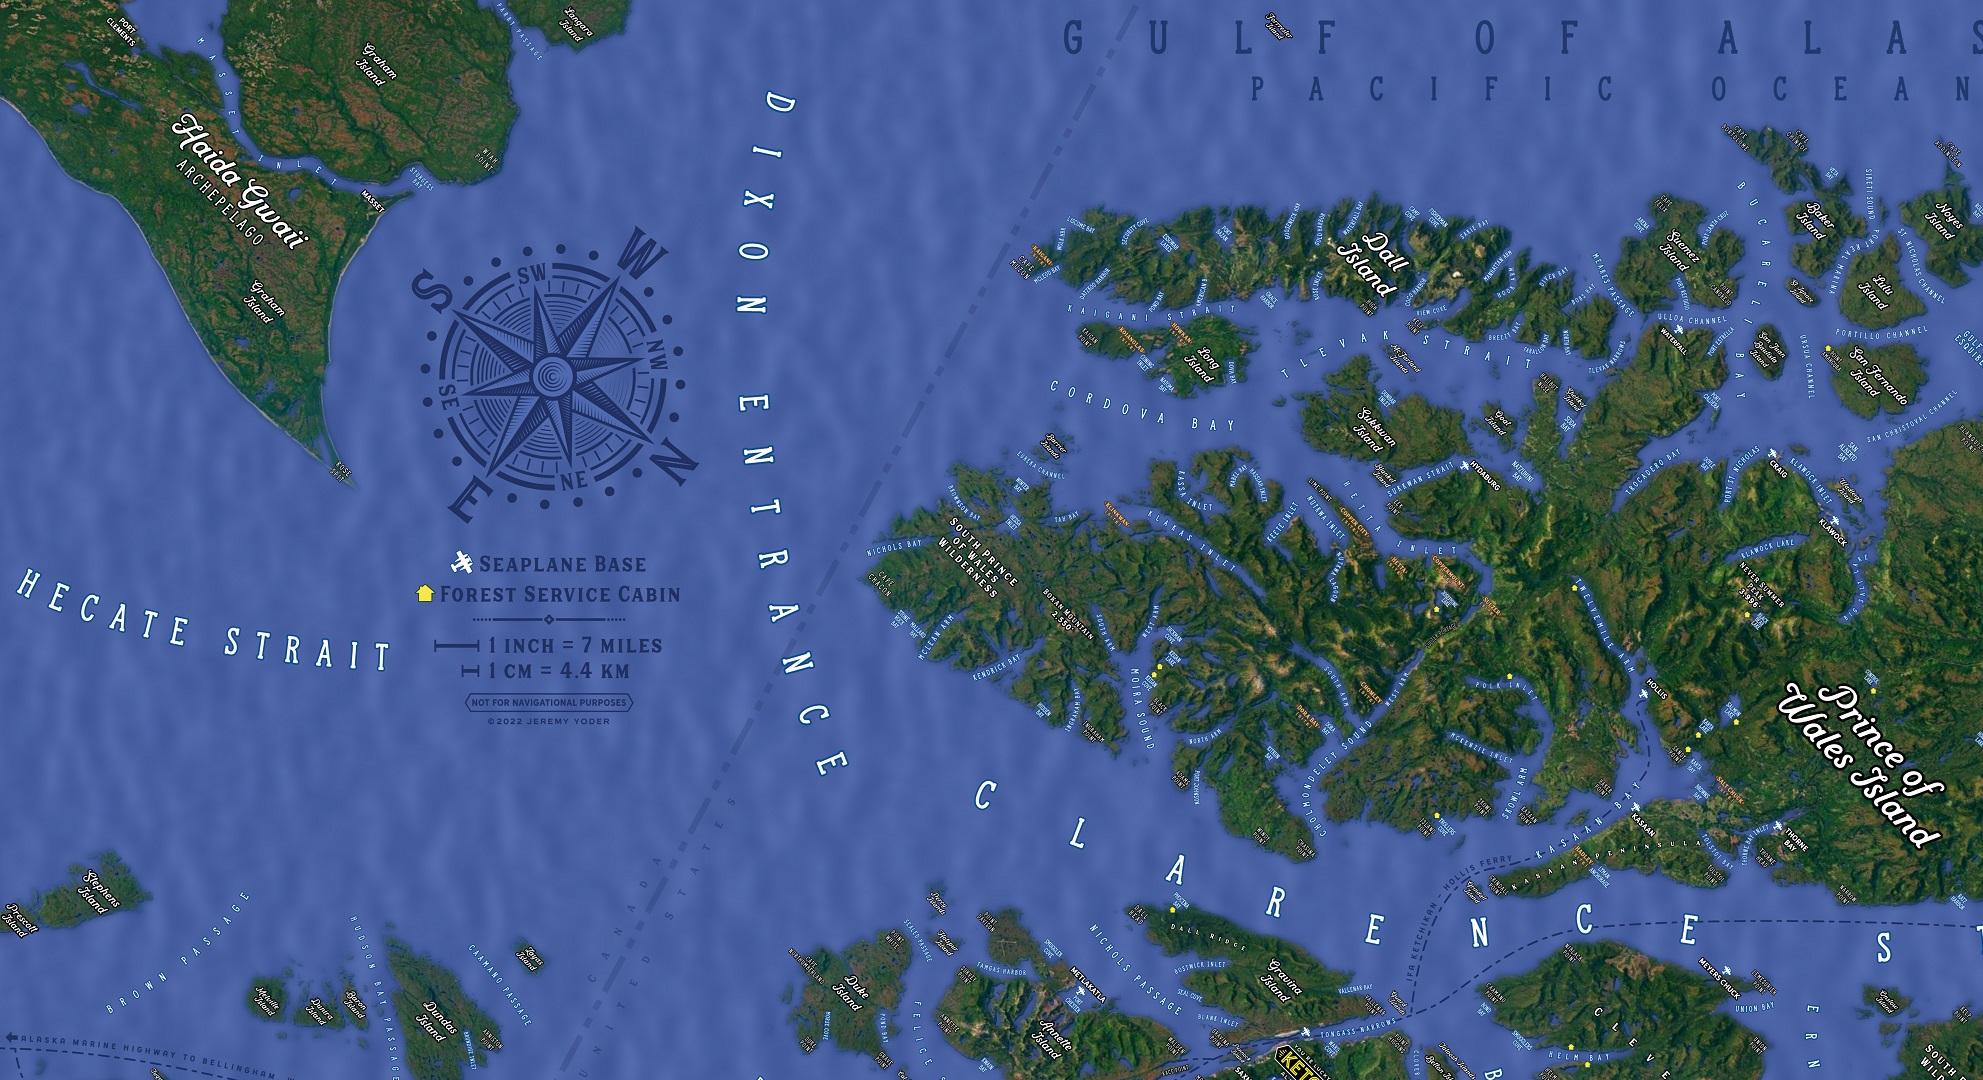
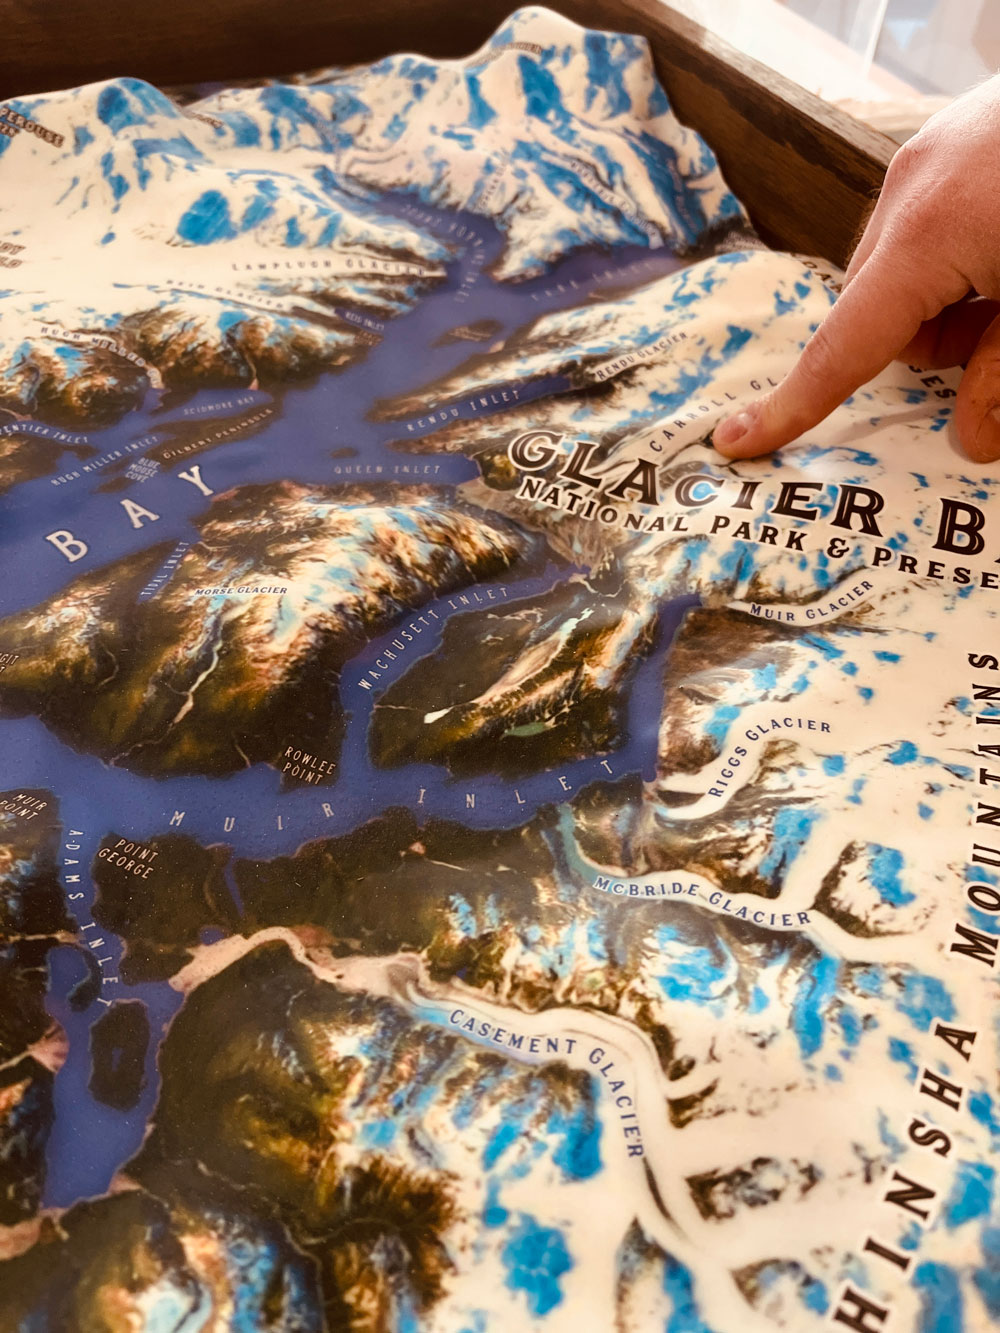
Contours:  One of the most distinctive features of bathymetric maps is their contour lines.  These lines connect points of equal depth, revealing the shape and structure of the seafloor.  The contour lines can be closely spaced in areas of steep topography, such as underwater canyons or ridges, or widely spaced in areas of gentle slopes.  By examining these contours, scientists can identify key features such as underwater mountains, valleys, and trenches.

Hypsometric Tinting:  Hypsometric tinting is another feature of bathymetric maps that provides valuable information about the seafloor.  This technique uses different colors to indicate different depths, allowing viewers to easily distinguish between shallow and deep areas.  Hypsometric tinting can also be used to highlight areas of interest, such as underwater volcanoes or seamounts.

Bathymetric Map-World

Shaded Relief:  Shaded relief is a technique that creates a three-dimensional representation of the seafloor. By combining contour lines with shading, bathymetric maps can provide a more detailed and realistic view of the underwater environment.  Shaded relief can help researchers visualize underwater features such as cliffs, valleys, and canyons, and can also reveal the behavior of ocean currents and tides.

Bathymetric Profile:  A bathymetric profile is a cross-sectional view of the seafloor, showing the depth of the water at different points along a specific line.  These profiles can provide valuable information about the topography of the seafloor, including the height and shape of underwater mountains and ridges, as well as the depth and width of underwater canyons.

Ocean Floor Textures:  Another feature of bathymetric maps is their ability to reveal the texture of the ocean floor.  By using different shading and coloring techniques, bathymetric maps can highlight areas of the seafloor that are composed of different materials, such as sand, mud, or rock.  This information can help scientists understand the composition and structure of the ocean floor, which in turn can provide insights into the geological processes that shape our planet.

Data Points:  Bathymetric maps are also characterized by the data points used to create them.  These data points come from a variety of sources, including satellites, ships, and autonomous underwater vehicles (AUVs). Each data point represents a measurement of the depth and shape of the seafloor at a specific location, and when combined, these data points create a detailed and accurate representation of the ocean floor.

Sample 3D Bathymetric Maps

Bathymetric maps are essential tools for marine exploration and research, providing valuable insights into the topography, geology, and ecology of the ocean floor.  These maps are created using a variety of technologies, including sonar, satellite imagery, and other remote sensing techniques, which allow us to explore the depths of our planet’s oceans in ways that were previously impossible.

Understanding Ocean Geology:  One of the primary benefits of bathymetric maps is that they provide scientists with a detailed understanding of the geology of the ocean floor.  By examining the contours, profiles, and textures of the seafloor, researchers can identify key features such as underwater mountains, ridges, and canyons, which can provide valuable insights into the geological processes that shape our planet.  This information can help scientists better understand plate tectonics, volcanic activity, and other geologic phenomena that affect the planet.

Mapping Ocean Ecosystems:  Another benefit of bathymetric maps is their ability to map ocean ecosystems. By identifying the depths, shapes, and contours of the ocean floor, scientists can better understand the distribution and abundance of marine life in different regions of the ocean.  This information can be used to develop strategies for protecting and conserving marine ecosystems, as well as to identify areas of high biodiversity that may require special conservation measures.

Improving Navigation and Safety:  Bathymetric maps also play an important role in improving navigation and safety in the ocean.  By providing accurate information about water depths, currents, and underwater hazards, these maps can help ships and other vessels navigate safely through the ocean.  In addition, bathymetric maps can be used to identify areas of the seafloor that are prone to earthquakes, landslides, and other hazards, allowing for better planning and disaster preparedness.

Supporting Resource Exploration:  Bathymetric maps are also valuable tools for supporting resource exploration in the ocean.  By identifying areas of the seafloor that are rich in minerals or other resources, these maps can help guide mining and exploration efforts.  In addition, bathymetric maps can be used to identify areas where fishing is likely to be successful, helping to support sustainable fisheries management practices.

Advancing Ocean Research:  Finally, bathymetric maps are essential for advancing ocean research in a wide range of fields.  From climate science to oceanography, these maps provide critical information about the ocean’s physical and biological characteristics, allowing scientists to better understand the complex systems that drive our planet’s ocean.  With the help of bathymetric maps, researchers are making new discoveries every day, uncovering hidden ecosystems and deep-sea wonders that were previously unknown.

Bathymetric maps are an essential tool for exploring and understanding the ocean.  With their ability to map ocean ecosystems, improve navigation and safety, support resource exploration, and advance ocean research, these maps are playing a critical role in helping us better understand and protect our planet’s oceans.  As we continue to explore the depths of the ocean, bathymetric maps will be an indispensable tool for unlocking the mysteries of the deep and revealing the wonders that lie beneath the waves.

We meld top-of-the-line technologies with professional cartography resources to create stunning bathymetric maps and models.  Our expertise in 3D printing enables us to allow more markets to benefit from purchasing durable, portable, and affordable models. 


Gallery of eCommerce 3D USGS Topographic Maps and 2D Canvas Prints

Shop WhiteClouds 3D USGS Topographical Maps with 65,240 three-dimensional maps to choose from.  There are also 361,902 3D USGS Historical Topographical Maps to choose from.  These maps are not flat. They are three-dimensional, with the height being determined by Digital Elevation Model (DEM) data. These 3D maps are built by combining satellite imagery data from the USGS and DEM data. Make a statement with these beautiful 3D map images from every part of the United States.

Shop WhiteClouds 2D USGS Topographical Canvas Print Maps with 427,142 maps to choose from.  These canvas print maps have both current and historical USGS topographic maps (from 1882 to present).  There are also satellite and terrain canvas print maps that use the USGS coordinates.  


Gallery of Custom 3D Map Projects

How 3D Bathymetric Maps are Made

There are several techniques used to create bathymetric maps, and the process can vary depending on the scale and complexity of the map.  However, the basic steps involved in making a bathymetric map are as follows:

  1. Create a base map. The first step in making a bathymetric map is to create a base map of the area. This can be done using imagery from a standard two-dimensional map, aerial photographs, satellite images, or WhiteClouds can do it for you.
  2. Determine the design style of the map. There are over 40 styles to choose from.  Popular ones include satellite, terrain, topography, raised relief, and satellite hybrid.
  3. Add any special design features not included in the source map, such as special features, landmarks, legends, roads, cities, symbols, etc.
  4. Add elevation data. The next step is to add elevation data to the map. This can be done using a variety of techniques, such as contour lines, shading, or digital elevation models (DEMs).
  5. Print the Map Overlay.  Latex vinyl materials are used for the map details and colors.
  6. Create the 3D physical map. Once the elevation data has been added to the map, a physical 3D structure is created that replicates the topography of the area. This can be done using 3D printed plastic or thermoformed molding/casting.  Either approach is combined with the Vinyl overlay.
  7. Finish the map.  This is where any excess materials are cutaway.  Any special sealers, matte finishes, hardeners, or UV protection is applied.  Wood, metal or plastic bases are built and border flocking may be applied.


Features & Benefits of Bathymetric Maps

  • Remarkably Strong:  You can drive a 1-ton truck over our bathymetric maps.
  • Precision:  We print our physical maps to scale as accurately as are the original files and images.
  • Excitement:  It is much easier to get excited about 3D views of your ski runs or trails than flat printed maps.
  • Stain and Water Resistance:  Spills are easy to wipe up.
  • Communication:  Bathymetric maps are simple to understand with a quick glance.
  • Affordability:  Our 3D technologies allow you to order custom 3D maps for a reasonable price.
  • Testability:  3D technologies are affordable enough to test designs, such as several versions of planned work.
  • Consistency:  Using modern print and casting technologies, you can easily recreate identical 3D maps.
  • Portability:  We use lighter materials than what was available in the past, making our bathymetric maps easy to transport.

Videos of 3D Maps

Map Design Styles of Bathymetric Maps

Many design styles, or base maps, serve as a starting point for your bathymetric map. We source and create our base maps using the same digital tools that expert cartographers use to create maps. Once you have selected your base map, everything else is fully customizable. We can layer informational text (such as landmarks or other points of interest) and even change the colors to suit your preferences.

Complex layers can be added such as streams and lakes, terrain, roads, and even more detail like political boundaries, religious, and other population-based demographics.  Multiple layers can also be added to the same physical map. For example, community developers and city planners can benefit from a 3D map with layers that include parcel lines, existing building footprints, and utility lines. Take a look at the map style categories below for inspiration.

Technology and Materials Used in Bathymetric Maps

  • With 3D printing technology, you are not limited to straight lines and boxes. The curves and cliffs are captured accurately and beautifully in astonishing detail.
  • Your vision of the final 3D map determines which materials we will choose to produce the best results. We help you to determine the materials that best suit your project.
  • We use fabrication technologies such as 3D printing, CNC cutting, and molding/casting.
  • Bathymetric maps show incredible detail.
  • Our maps are printed in full color (with over 17 million variations of color) for awe-inspiring presentations and displays. No painting required!
  • Typically, we use a special process for finishing the sides of the raised relief maps in a suede-like material, similar to the finish of a jewelry box.
  • Our in-house paint booth gives us flexibility in different types and grades of paint and finishing capabilities; we can provide UV-resistant coatings to protect the coloration of your 3M map for many years.
  • We also offer customized additions to our 3D maps and models. Our in-house carpentry shop will build elegant bases, tables, or cabinetry to display any map you choose. Worried about dust? We can customize a case to protect your display as well. Our skilled artisans can hand-paint details to make your map a true work of art. 

WhiteClouds Marscapes: A Captivating Collection of 3D Raised Landscape Art for Home or Office Decor

Pricing of Custom Bathymetric Maps

The price of 3D maps and models are generally based on your size requirements, specific design needs, and the amount of work it will take to produce. Each map is custom-built and charged for accordingly. The best way to determine cost is to email us, call us at 385-206-8700, or fill out the form below and let us bid on your project.

Get a Free Price Estimate for a Custom Bathymetric Map

Custom Fabrication Workflow

Common Questions & Answers

  • What is the largest map you can fabricate?  There is no limit to the size of a map we can build.  There are practical limits that will impact shipping and installation, but we work closely with our customers on these special requirements.
  • What type of 3D maps can you fabricate?  All types.  Satellite Maps, Terrain MapsTopographical MapsRaised Relief MapsUSGS MapsContour Maps, and many more.
  • Can you fabricate with different technologies and materials?  Yes.  Our most common fabrication technology is 3D Printing, but we can also build 3D Maps with CNC Cutting, 3D Foam, Molding/Casting, Thermoforming, and Sculpting.
  • What materials can you 3D print in?  We match the correct material and fabrication process to your requirements in terms of presentation, size, and transportability.  We can 3D print in PLA, FDM, Full-Color Sandstone, UV-cured resin, plastic, rubber-like, acrylic, and nylon – as well as combining multiple technologies.
  • Can you sign a Non-disclosure Agreement that you supply?  Yes.
  • How long will it take to create my map?  That depends on the design and size of the map.  A more complex or detailed map will take longer than a simple map, we can’t really say exactly how long it will take until we have the chance to understand what type of map you want fabricated.  Generally, smaller standard maps can be a couple of weeks and large museum exhibition maps can be 6 months.
  • What do you need from me to start the map fabrication?  Boundaries are a good place to start.  Determining map styles, sizes, height (may be exaggerated), and cabinetry needs are all part of the process.  Special design features can also be added.
  • Can you add homes, buildings, swimming pools, arbors, hardscaping features, etc.?  Yes.  We can 3D print many of these items and include them in our maps.  We refer to these more complex maps as architectural dioramas.
  • What is a bathymetric map?  A bathymetric map is a type of map that shows the underwater topography or depth of a body of water, such as an ocean, lake, or river.  Bathymetric maps are created using specialized equipment, such as sonar and echo sounders, to measure the depth of the water at various points.  The depth data is then used to create a 3D model of the underwater terrain, which is represented on the map through contours, shading, and color coding.

    Bathymetric maps are commonly used in marine navigation, oceanography, and fisheries management. They can provide valuable information about the location of underwater features such as canyons, seamounts, and ridges, which can have important ecological and geological significance.  Bathymetric maps can also be used to identify potential hazards for navigation, such as shoals or shipwrecks, and to plan the placement of underwater infrastructure, such as pipelines or cables.

  • What does a bathymetric map show?  A bathymetric map shows the depth of a body of water, such as an ocean, lake, or river.  This type of map provides information about the underwater topography or terrain of a particular area.  The map uses a variety of visual cues, such as contours, shading, and color coding, to represent the depth of the water at different points.

    Bathymetric maps are created using specialized equipment, such as sonar and echo sounders, to measure the depth of the water.  This depth data is then used to create a 3D model of the underwater terrain, which is represented on the map.

    Bathymetric maps are commonly used for marine navigation, oceanography, and fisheries management. They can help identify underwater features such as canyons, seamounts, and ridges, which can have important ecological and geological significance.  Bathymetric maps can also be used to identify potential hazards for navigation, such as shoals or shipwrecks, and to plan the placement of underwater infrastructure, such as pipelines or cables.

  • What is on a bathymetric map?  A bathymetric map displays the underwater topography or depth of a body of water, such as an ocean, lake, or river.  The map uses a variety of visual cues, such as contours, shading, and color coding, to represent the depth of the water at different points.

    The primary feature of a bathymetric map is the contour lines, which represent the depth of the water at specific intervals.  These contour lines are similar to those found on a topographic map, which shows the elevation of the land.  On a bathymetric map, the contour lines connect points of equal depth and show the shape of the seafloor.

    In addition to contour lines, a bathymetric map may include shading or color coding to further represent the depth of the water.  For example, deeper water may be shaded in darker colors, while shallow water may be shown in lighter colors.

    Bathymetric maps may also include other features, such as labels for important underwater features, like canyons, ridges, or seamounts.  They may also show locations of shipwrecks, navigational hazards, or underwater infrastructure like pipelines or cables.

  • How are bathymetric maps made?  Bathymetric maps are made using specialized equipment, such as sonar and echo sounders, to measure the depth of the water and create a 3D model of the underwater terrain.

    Sonar, which stands for Sound Navigation And Ranging, works by sending out sound waves that bounce off the seafloor and return to the sonar receiver.  By measuring the time it takes for the sound waves to travel and return, sonar can calculate the depth of the water.  Modern sonar equipment is highly advanced, using multibeam sonar systems to provide highly accurate depth measurements.

    Echo sounders work in a similar way to sonar, but they are typically used for shallower waters.  Echo sounders send out a sound pulse that travels to the seafloor and bounces back to the echo sounder. By measuring the time it takes for the sound pulse to travel and return, echo sounders can calculate the depth of the water.

    Once the depth data has been collected, it is used to create a 3D model of the underwater terrain.  This model is then used to create the bathymetric map, which shows the depth of the water using contour lines, shading, or color coding.

    In addition to sonar and echo sounders, bathymetric maps can also be created using satellite altimetry, which measures the height of the sea surface to infer the depth of the water below.

  • How do scientists collect data for bathymetric maps?  Scientists collect data for bathymetric maps using a variety of specialized equipment, such as sonar, echo sounders, and satellite altimetry.

    Sonar and echo sounders are two of the most common tools used for collecting bathymetric data. These instruments work by sending out sound waves that travel through the water and bounce off the seafloor, allowing scientists to measure the depth of the water.   Modern sonar systems use multiple beams of sound to provide highly accurate depth measurements.

    Satellite altimetry is another method used to collect bathymetric data.  This technique involves using satellites to measure the height of the sea surface, which can be used to infer the depth of the water below.  Satellite altimetry is particularly useful for mapping large areas of the ocean, but it is less accurate than sonar or echo sounders.

    In addition to these techniques, scientists may also use other instruments, such as submersibles or remotely operated vehicles (ROVs), to collect bathymetric data in specific areas or for targeted research projects.

    Once the bathymetric data has been collected, it is processed and analyzed to create a 3D model of the underwater terrain.  This model is then used to create the bathymetric map, which shows the depth of the water using contour lines, shading, or color coding.

  • How does an echo sounder create a bathymetric map?  An echo sounder is a device used to create a bathymetric map by measuring the depth of the water using sound waves.  The device sends out a sound pulse that travels to the seafloor and bounces back to the echo sounder.  By measuring the time it takes for the sound pulse to travel and return, the echo sounder can calculate the depth of the water.

    To create a bathymetric map using an echo sounder, scientists will typically use a vessel equipped with the device to survey a given area.  The echo sounder sends out a continuous series of sound pulses as the vessel moves through the water, creating a swath of depth measurements along the survey line.

    Once the depth data has been collected, it is processed and analyzed to create a 3D model of the underwater terrain.  This model is then used to create the bathymetric map, which shows the depth of the water using contour lines, shading, or color coding.

    Modern echo sounders use advanced technology to provide highly accurate depth measurements.  For example, some devices use multiple sound beams that can cover a wider area and provide more detailed measurements of the seafloor.  Others use sensors that can detect the composition of the seafloor, providing additional information about the underwater environment.

  • How do I create a bathymetric map?  These are the steps to create a bathymetric map.
  1. Acquire Bathymetric Data:  The first step in creating a bathymetric map is to acquire the data.  This can be done by using specialized equipment such as sonar, echo sounders, or satellite altimetry, as described earlier.  Alternatively, you may be able to obtain publicly available bathymetric data from sources such as government agencies or scientific institutions.
  2. Process the Data:  Once you have acquired the bathymetric data, you will need to process it to create a 3D model of the underwater terrain.  This can be done using software programs such as ArcGIS or QGIS, which are commonly used for geographic data analysis.
  3. Create the Map:  With the 3D model of the underwater terrain, you can create a bathymetric map using mapping software or graphic design tools.  The map can be created with contour lines, shading, or color coding to represent the depth of the water in different areas.
  4. Interpret and Analyze the Data:  After creating the bathymetric map, you can analyze and interpret the data to gain insights into the underwater environment. For example, you may be able to identify areas of high or low relief, underwater features such as canyons or ridges, or locations of interest for marine biology or geology research.  Creating a bathymetric map requires specialized equipment and expertise, and it is typically done by trained professionals in the field of oceanography or hydrography. However, if you are interested in creating a bathymetric map as a personal project, there are several steps you can follow:
  • How are islands differentiated from seamounts on bathymetric maps?  Islands and seamounts can be differentiated on bathymetric maps based on their height relative to the surrounding seafloor.  Islands are typically elevated landforms that rise above the water surface, while seamounts are underwater mountains or hills that do not reach the surface.

    On a bathymetric map, islands are typically depicted as elevated land areas with contours indicating the height of the land above sea level.  In contrast, seamounts are shown as underwater mountains or hills with contours indicating their height above the surrounding seafloor.

    In addition to their height, islands and seamounts can also be distinguished based on their location and geological origin.  Islands are typically formed by volcanic activity or the movement of tectonic plates, while seamounts can also be formed by volcanic activity or may be remnants of ancient mountains that have sunk below the surface of the ocean.

  • Who uses bathymetric maps?  Bathymetric maps are used by a wide range of professionals and individuals who have an interest in understanding the underwater environment.  Here are some of the groups who commonly use bathymetric maps:

    Oceanographers:  Oceanographers use bathymetric maps to study the physical and geological characteristics of the ocean floor, including features such as underwater canyons, seamounts, and ridges. This information can be used to better understand ocean currents, marine habitats, and the geologic history of the ocean.

    Navigators:  Navigators, including sailors, fishermen, and other mariners, use bathymetric maps to safely navigate the waters around shorelines, islands, and other underwater hazards.  The maps provide critical information about the depth and shape of the seafloor, which can help avoid accidents and collisions.

    Geologists:  Geologists use bathymetric maps to study the tectonic activity and geologic history of the seafloor.  These maps can provide information about the location and movement of tectonic plates, as well as the history of volcanic activity in the ocean.

    Engineers:  Engineers may use bathymetric maps to plan and design underwater structures, such as pipelines, cables, and offshore platforms.  The maps provide information about the depth, slope, and terrain of the seafloor, which can be critical in determining the feasibility and safety of these structures.

    Recreational users:  Bathymetric maps are also used by recreational users, such as divers and snorkelers, to explore and enjoy the underwater environment. These maps can provide information about the location and depth of interesting underwater features, such as reefs and wrecks.

  • What does a bathymetric map depict?  A bathymetric map is a type of map that depicts the depth and shape of the underwater environment, including the seafloor and other underwater features.  Bathymetric maps use contour lines to represent changes in water depth, similar to the way that topographic maps use contour lines to represent changes in elevation.

    The contour lines on a bathymetric map connect points of equal water depth, allowing the user to visualize the shape of the seafloor and other underwater features such as ridges, canyons, and seamounts.  In addition to contour lines, bathymetric maps may also include other features such as labels indicating the names and locations of underwater features, as well as color shading to highlight changes in depth or other characteristics of the seafloor.

    Bathymetric maps can be created using a variety of techniques, including acoustic soundings, satellite imagery, and sonar technology.  These maps are used by a variety of professionals, including oceanographers, geologists, engineers, and navigators, to better understand the underwater environment and safely navigate the waters.

  • How do I draw a bathymetric map?  Drawing a bathymetric map requires specialized knowledge and tools.  It is typically a task that is carried out by trained professionals, such as oceanographers, geologists, or cartographers, using specialized software and equipment. However, here is a general overview of the process involved in creating a bathymetric map:

    Acquire data:  The first step in creating a bathymetric map is to acquire data about the seafloor.  This data can be obtained using a variety of techniques, including echo sounders, sonar, or satellite imagery.

    Process the data:  Once the data is acquired, it needs to be processed to remove noise, correct for errors, and interpolate missing data.  This process typically involves the use of specialized software and can be time-consuming.

    Generate a grid:  The processed data is typically used to generate a grid of points, where each point represents a specific depth measurement.

    Create contours:  Using the grid of points, contour lines can be generated to represent changes in depth. The spacing of the contour lines can be adjusted to highlight specific features or characteristics of the seafloor.

    Add additional information:  Depending on the purpose of the map, additional information such as labels, symbols, and color shading can be added to highlight specific features or characteristics of the seafloor.

    Finalize the map:  Once the bathymetric map is complete, it should be reviewed and finalized to ensure accuracy and clarity.  The map can then be printed or used in digital form for further analysis and interpretation.

    It’s important to note that drawing a bathymetric map requires specialized knowledge and expertise, and it’s not something that can be easily done by a layperson.  If you need a bathymetric map for a specific purpose, it’s recommended that you consult with a professional who has experience in creating these types of maps.

  • What can you learn from a bathymetric map?  A bathymetric map can provide a wealth of information about the underwater environment, including:

    Seafloor topography:  Bathymetric maps provide a detailed picture of the shape and features of the seafloor, including underwater mountains, ridges, valleys, and canyons.  This information can be used to better understand the geologic history of the area, as well as the physical and biological processes that shape the seafloor.

    Oceanic currents:  Bathymetric maps can reveal information about the direction and speed of ocean currents.  This information is important for understanding the movement of water, as well as for predicting the distribution of marine organisms and pollutants.

    Marine habitats:  The features and characteristics of the seafloor can provide important information about the distribution and abundance of marine habitats, such as coral reefs, seagrass beds, and rocky outcrops.  This information is critical for effective marine conservation and management.

    Navigation:  Bathymetric maps are essential for safe navigation in deep water. They provide accurate information about the depth and shape of the seafloor, allowing ships to avoid underwater hazards and safely navigate through narrow channels and passages.

    Resource exploration:  Bathymetric maps can be used to identify potential sites for resource exploration, such as oil and gas deposits, as well as areas with high mineral or biological diversity.  This information can be used to guide scientific research and resource management.

Do you have a question we didn’t answer? Don’t hesitate to contact us at 1-385-206-8700 or [email protected].

Worldwide Delivery

WhiteClouds has delivered maps around the world.

History of Bathymetric Maps

Bathymetric maps have a fascinating history that spans centuries and involves some of the most innovative minds in science and technology.  

The first attempts to map the ocean floor date back to the 17th century when scientists began using weighted lines to measure water depth.  These early methods were crude and inaccurate, but they provided the foundation for later efforts to map the seafloor.

In the late 19th century, advancements in technology led to the development of more sophisticated methods for measuring water depth, including echo sounders and sonar.  These new technologies allowed scientists to create more accurate maps of the ocean floor and led to a revolution in our understanding of the seafloor.

One of the pioneers of modern bathymetric mapping was a scientist named John Murray, who led the first deep-sea exploration expedition in 1872. Murray and his team used dredging and trawling techniques to collect samples of the ocean floor and create the first detailed maps of the seafloor.  Their work was groundbreaking and set the stage for the development of modern bathymetric mapping.

In the early 20th century, a scientist named Marie Tharp began working with geologist Bruce Heezen to create the first comprehensive map of the Atlantic Ocean floor.  Tharp used sonar data to create a detailed map of the mid-Atlantic ridge, a massive underwater mountain range that stretches for thousands of miles.  Their work was a major breakthrough and led to a greater understanding of plate tectonics and the geology of the ocean floor.

In the decades that followed, advancements in technology continued to transform bathymetric mapping. In the 1950s, scientists began using multibeam sonar to create more detailed and accurate maps of the ocean floor.  This technology allowed researchers to create 3D images of the seafloor and provided new insights into the geology and ecology of the ocean.

In recent years, advancements in satellite technology and remote sensing have led to even greater breakthroughs in bathymetric mapping.  Satellite altimetry, for example, measures the height of the sea surface, which can be used to infer the shape of the seafloor.  This technology has led to the creation of more accurate and detailed maps of the ocean floor, even in remote and inaccessible regions of the ocean.

The history of bathymetric mapping is a testament to the human drive to explore and understand the world around us.  From the early attempts to measure water depth to the cutting-edge technologies used to map the seafloor today, bathymetric mapping has played a vital role in our understanding of the ocean and its place in the natural world.  As we continue to explore the depths of the ocean, bathymetric maps will remain an essential tool for unlocking the mysteries of the deep and uncovering the secrets of the ocean floor.

Bathymetric Map-Sir John Murray
The Oceans by Sir John Murray
Bathymetric Map-Marie Tharp
First Map of the Atlantic Ocearn Floor by Marie Tharp
Bathymetric Map-Mapping the Ocean Floor
Sonar Mapping Seafloor

Get a free quote

Get a Free Quote