USGS Historical Topographic Maps
What is a USGS Historical Topographic Map?
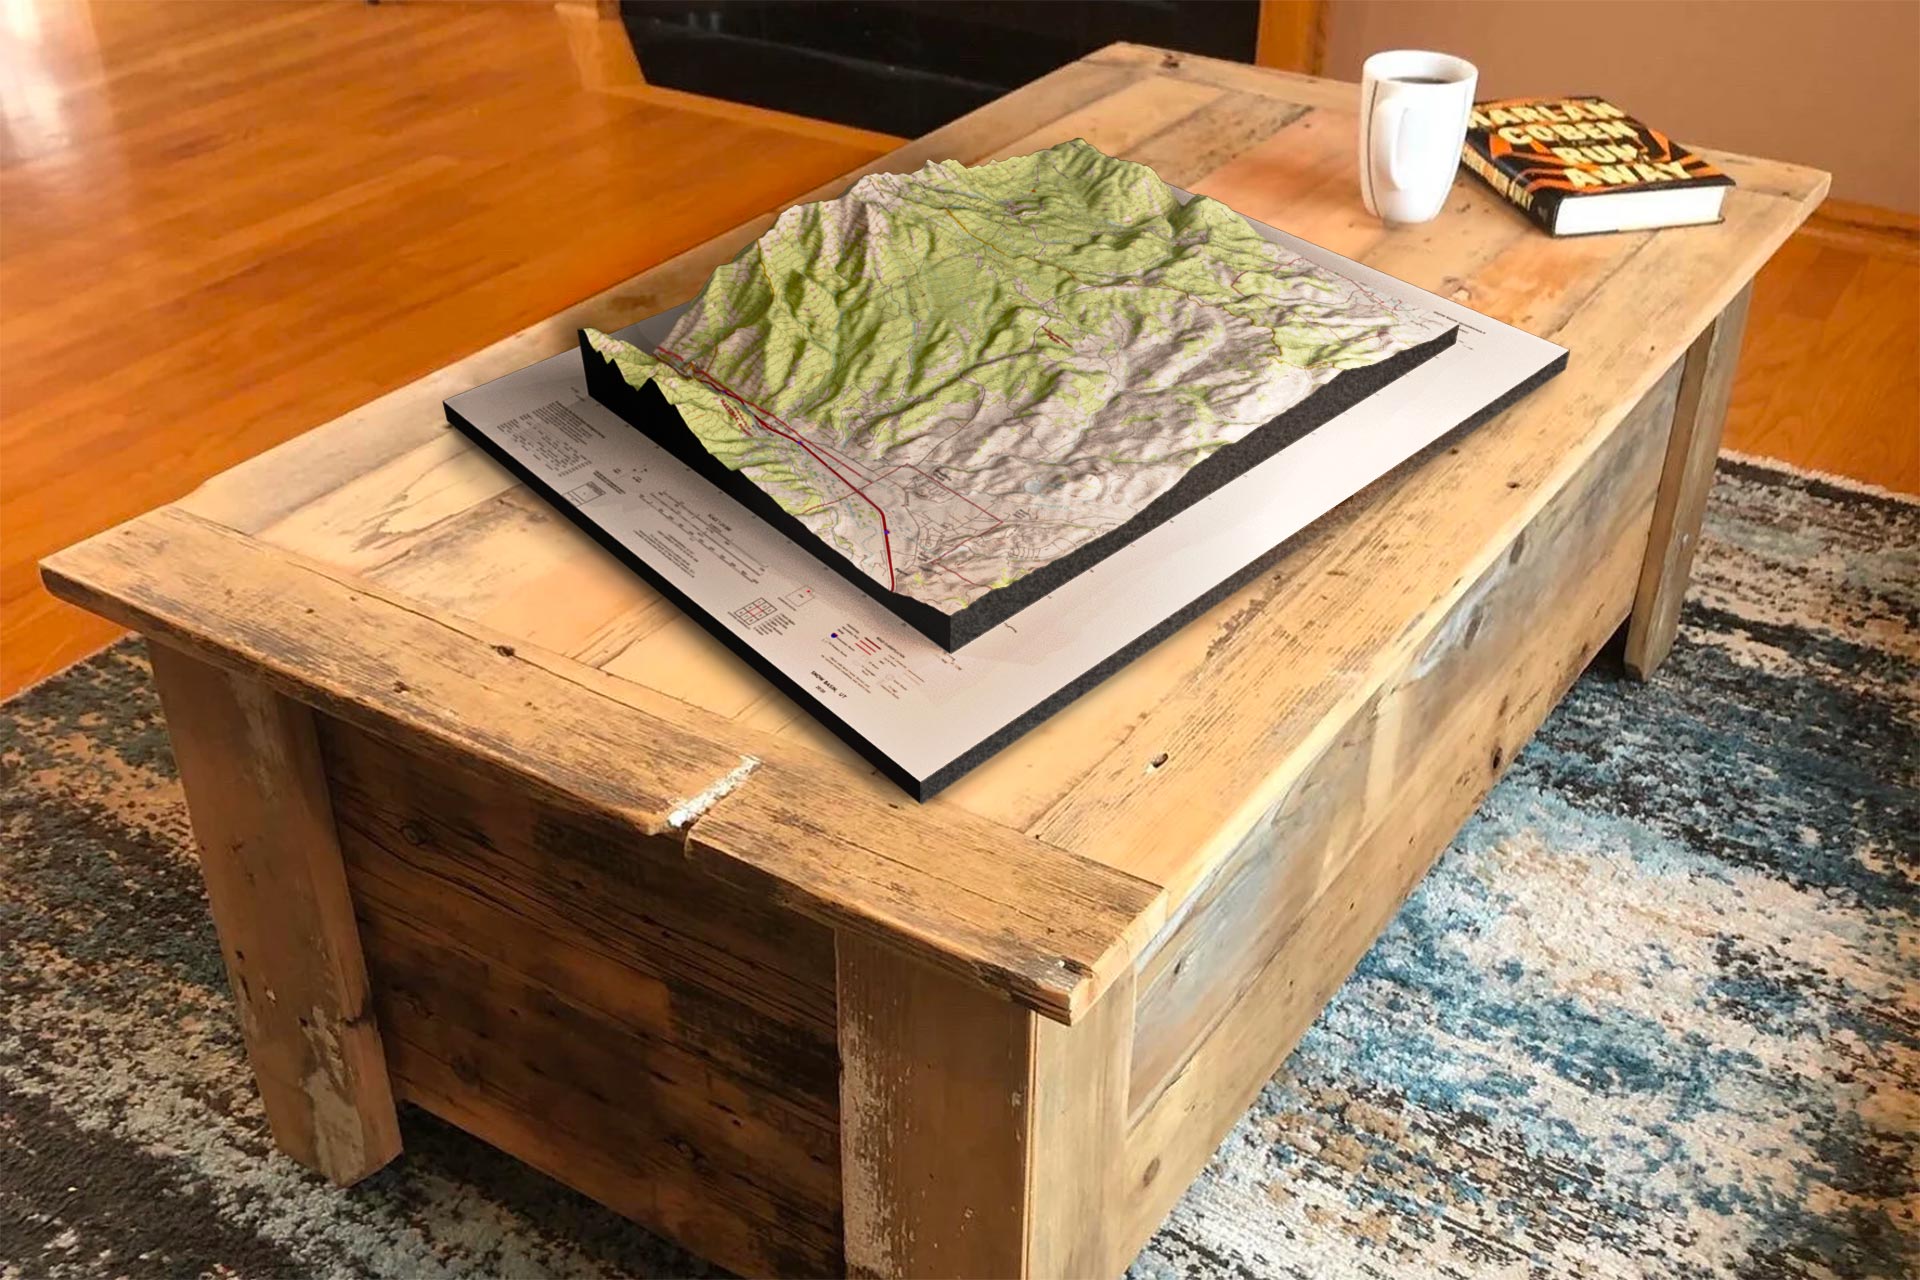
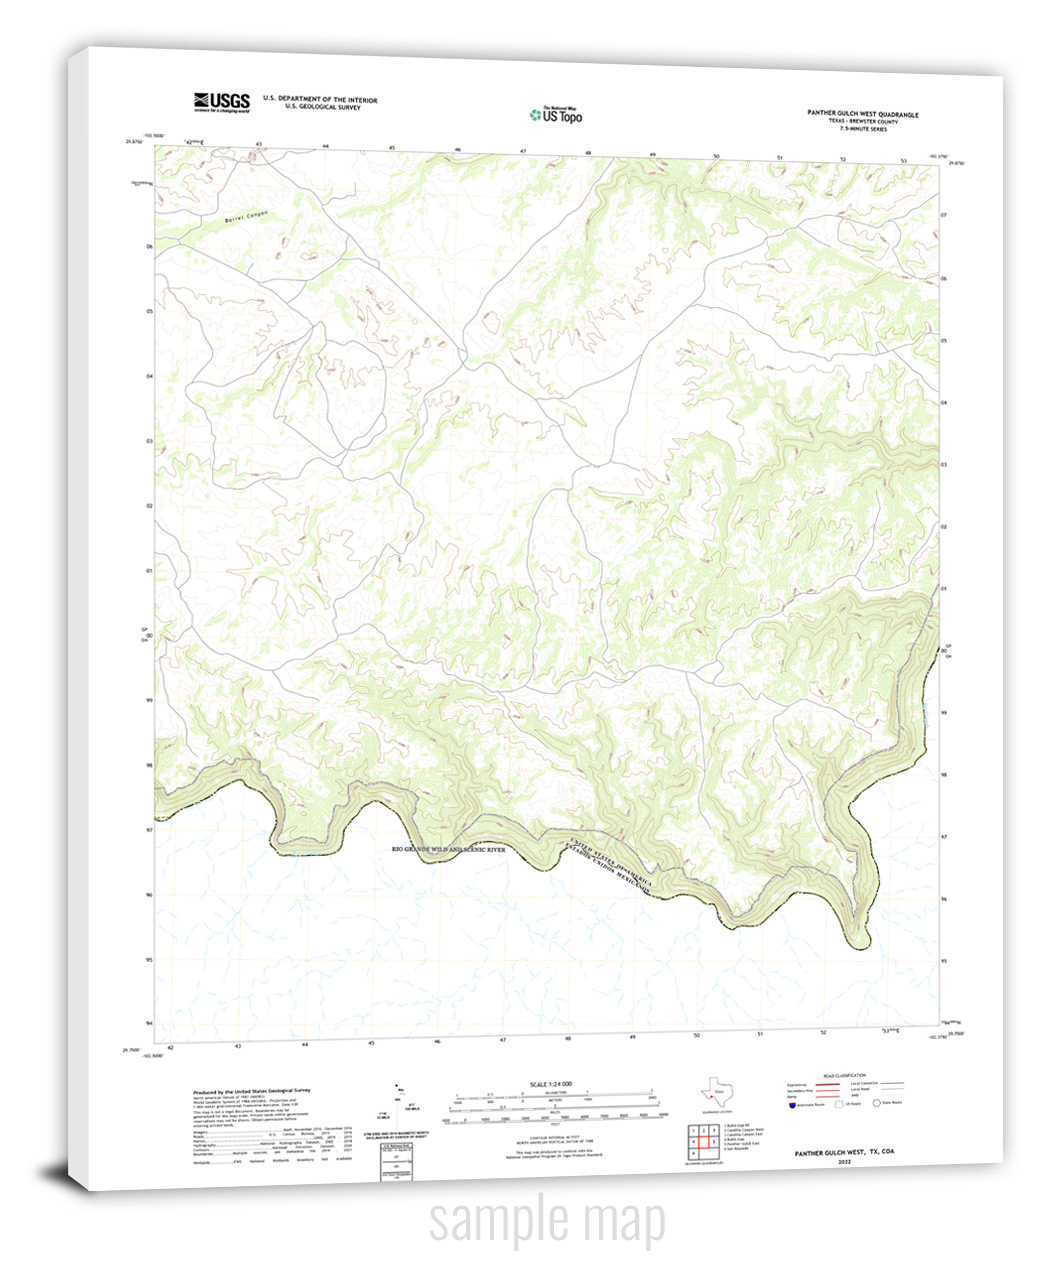
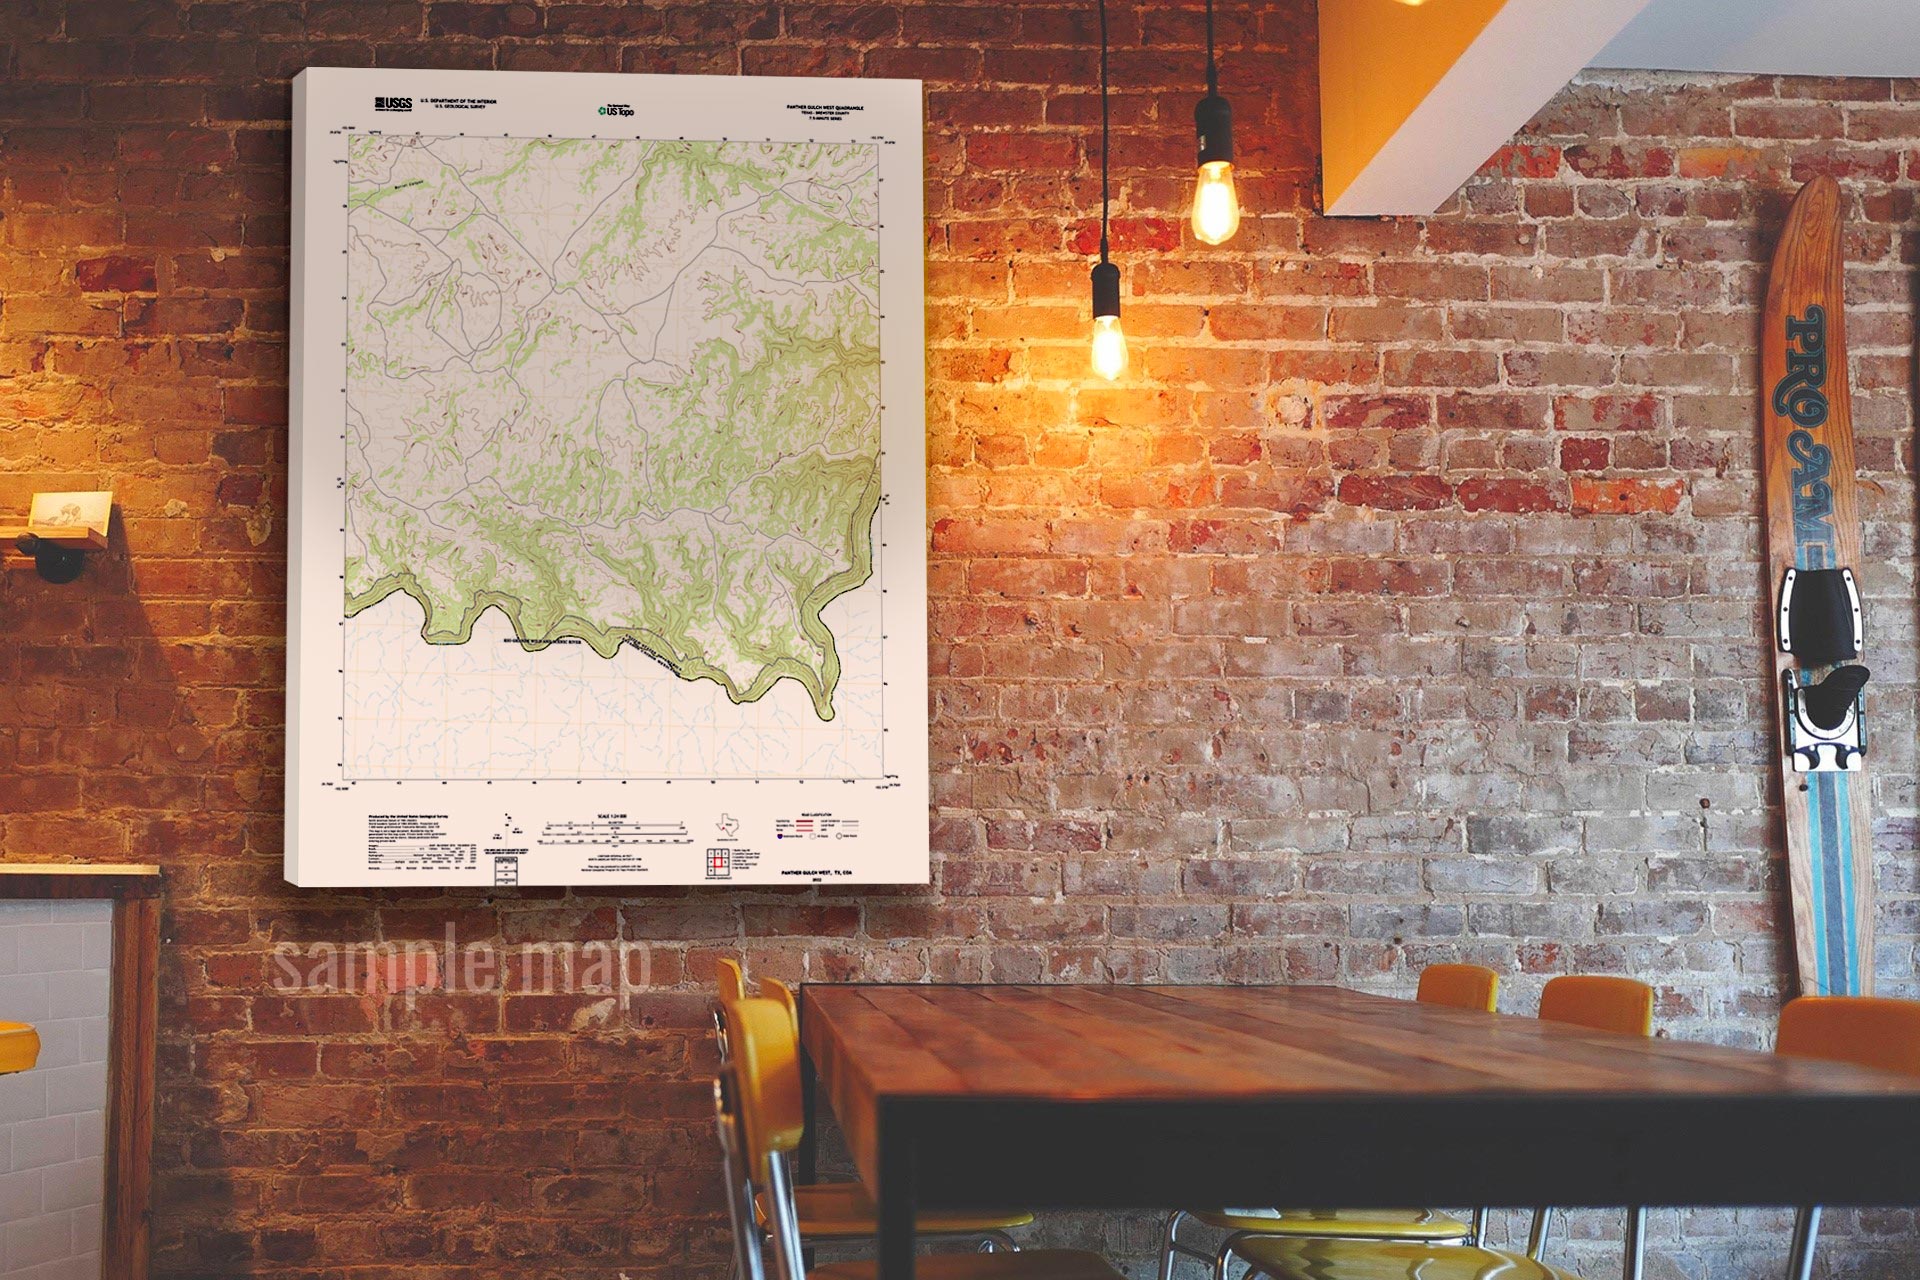
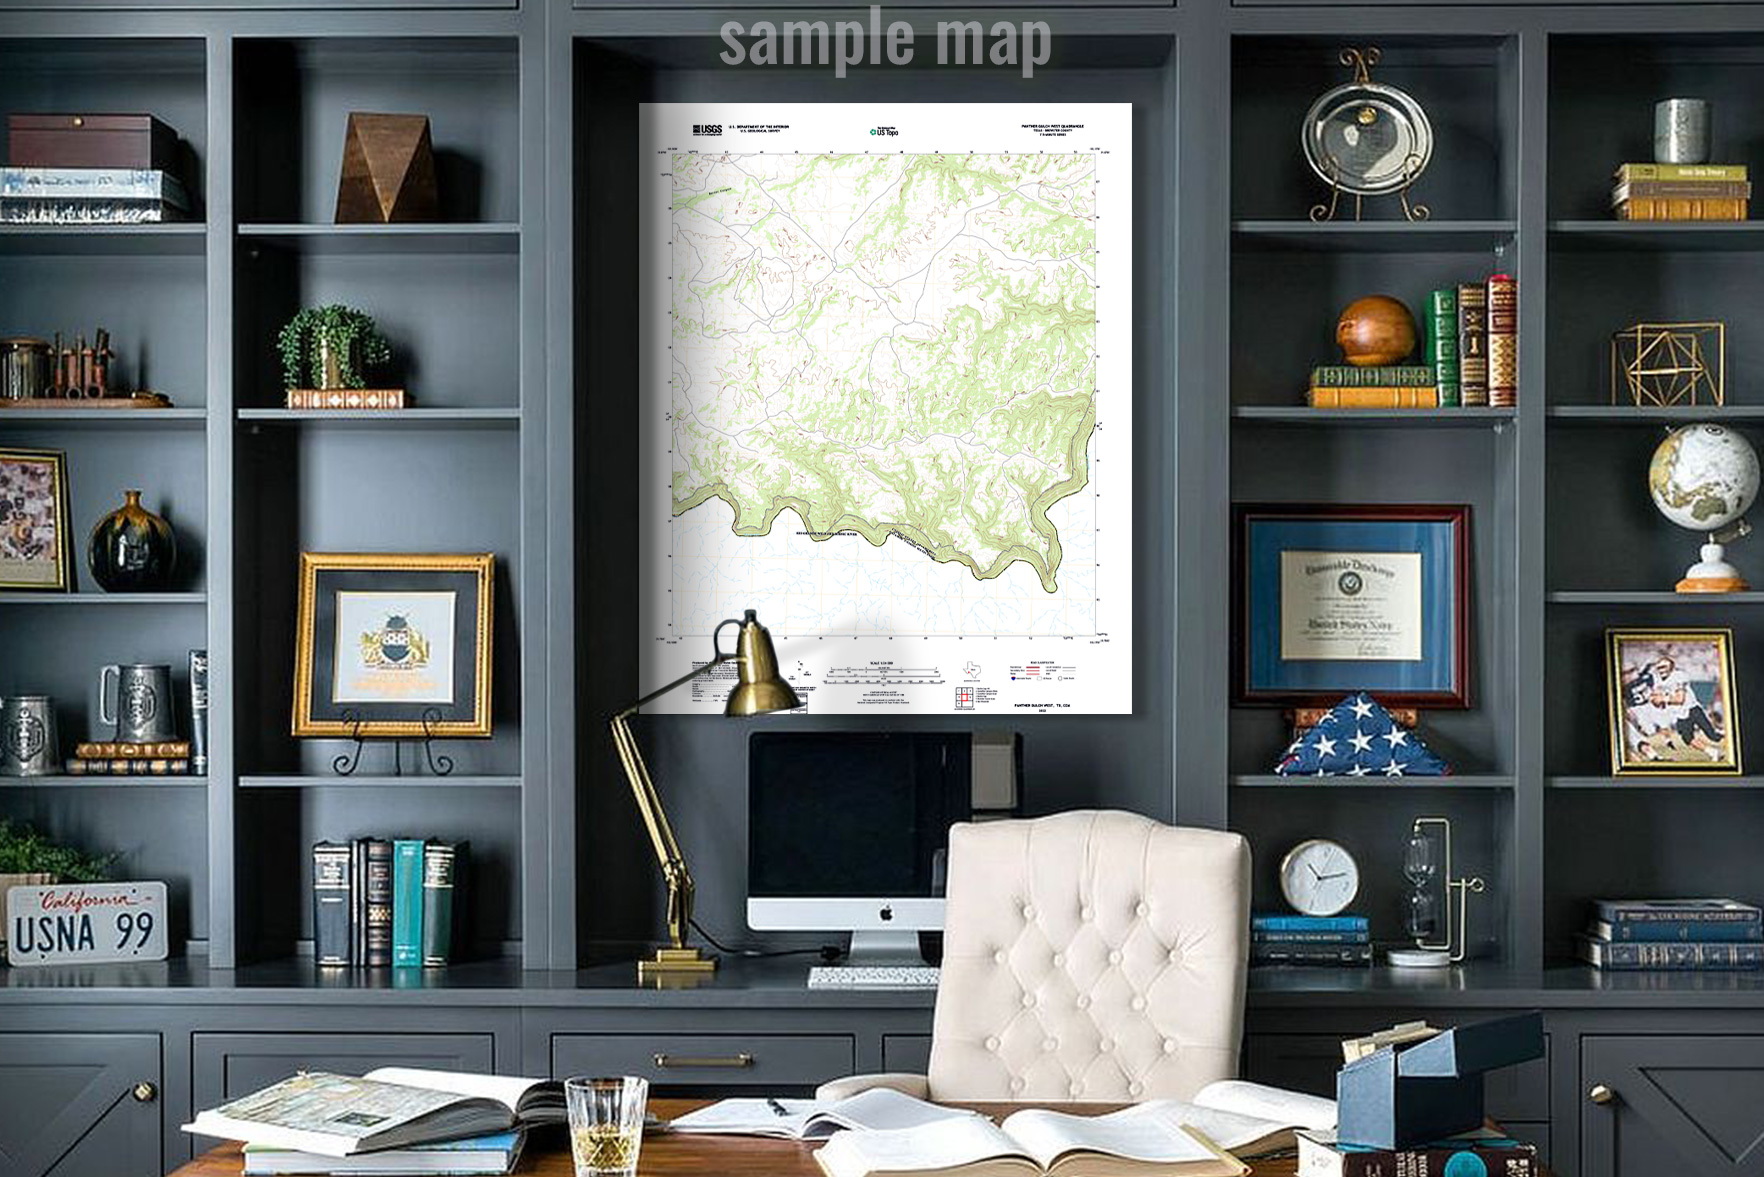
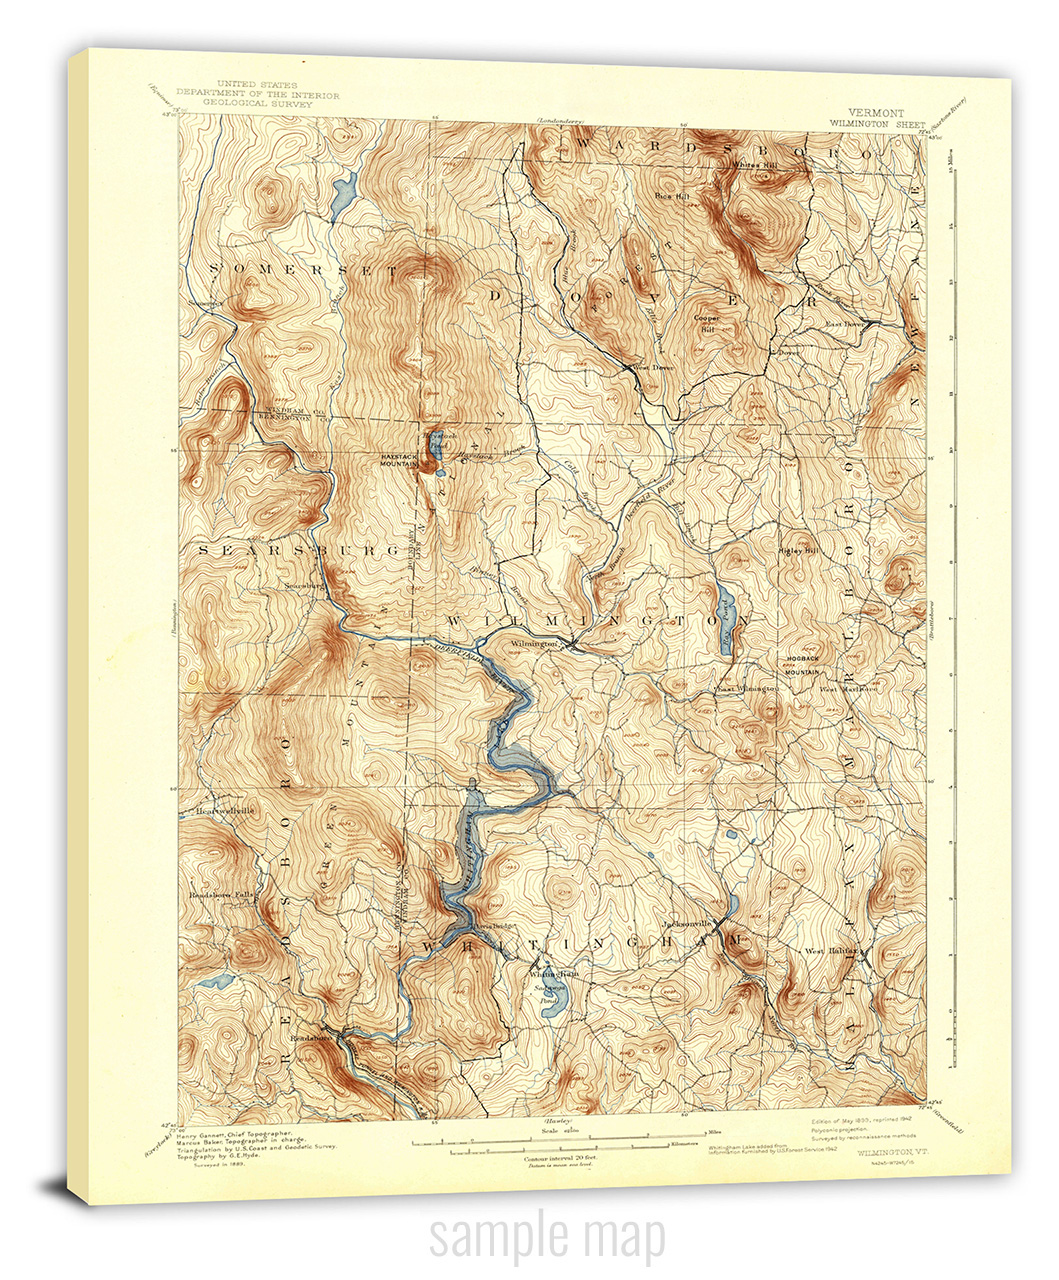
We build 2D and 3D USGS Historical Topographic Maps
Table of Contents
USGS Historical Topographic Maps
Get ready to embark on a thrilling journey through time as we uncover the fascinating history of USGS topographical maps! These maps are an absolute treasure trove of information, providing us with a window into how the United States has transformed over the years. Produced by the brilliant minds at the United States Geological Survey, USGS historical topographical maps offer us an incredibly detailed look at the physical geography of our country.
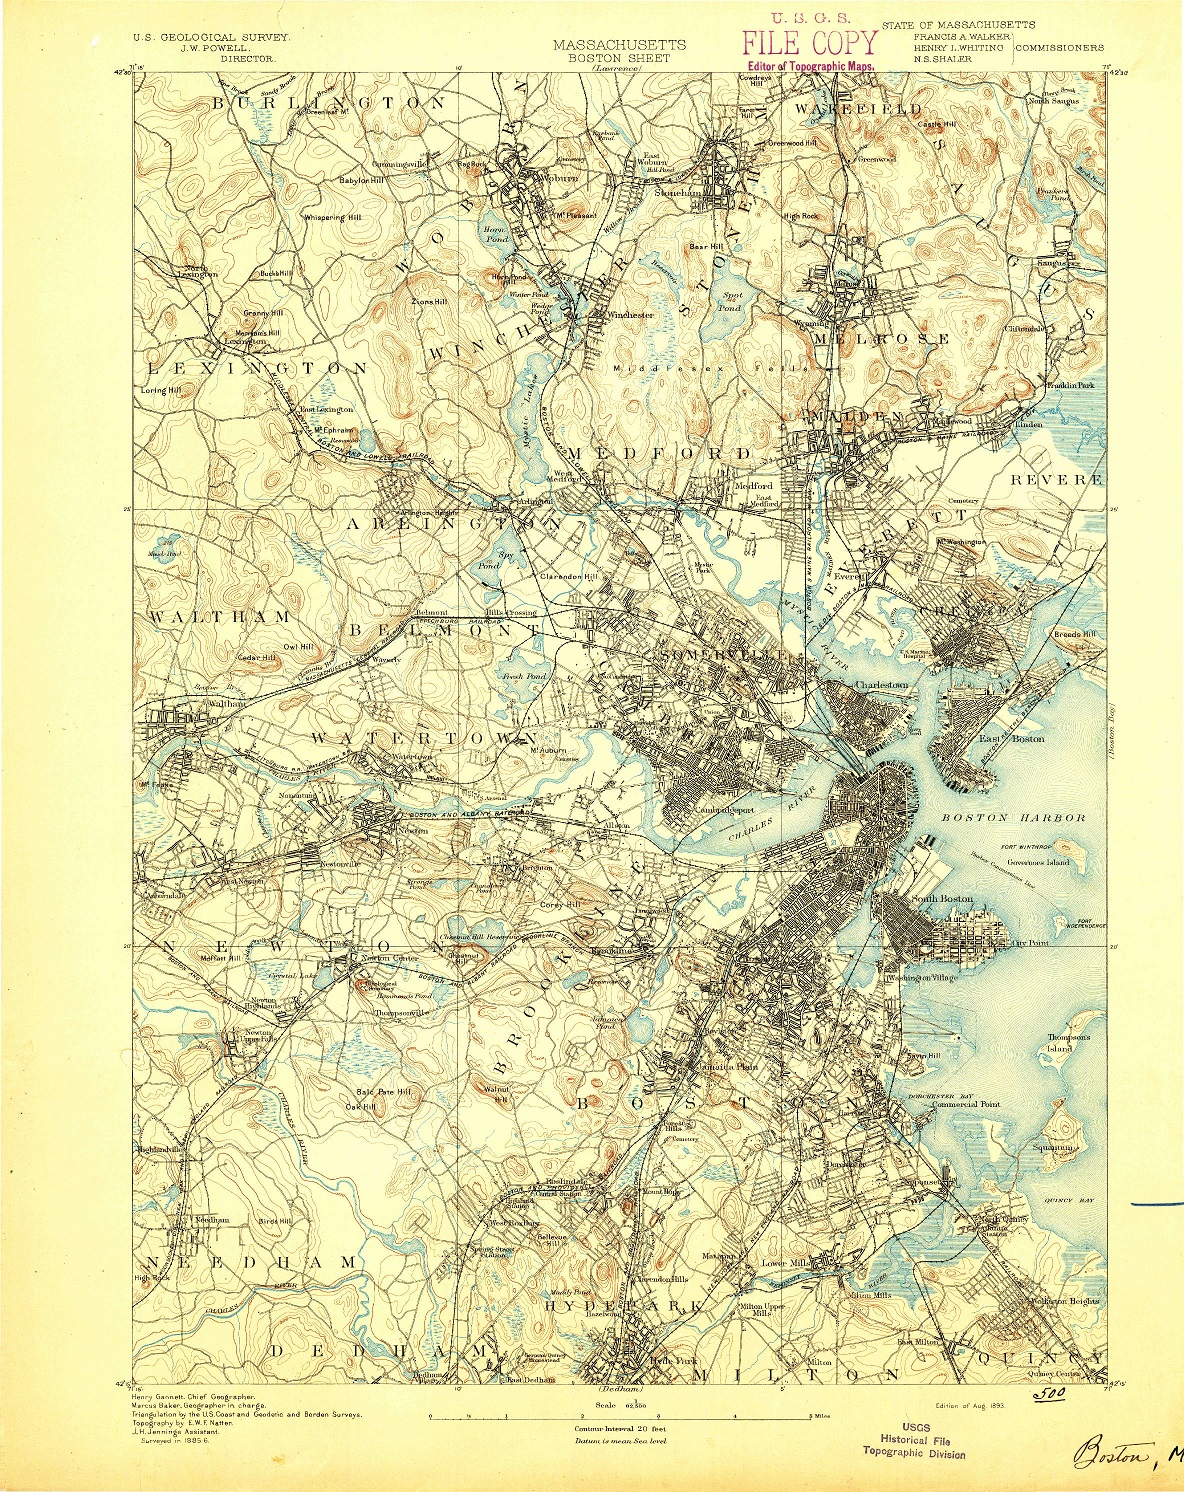
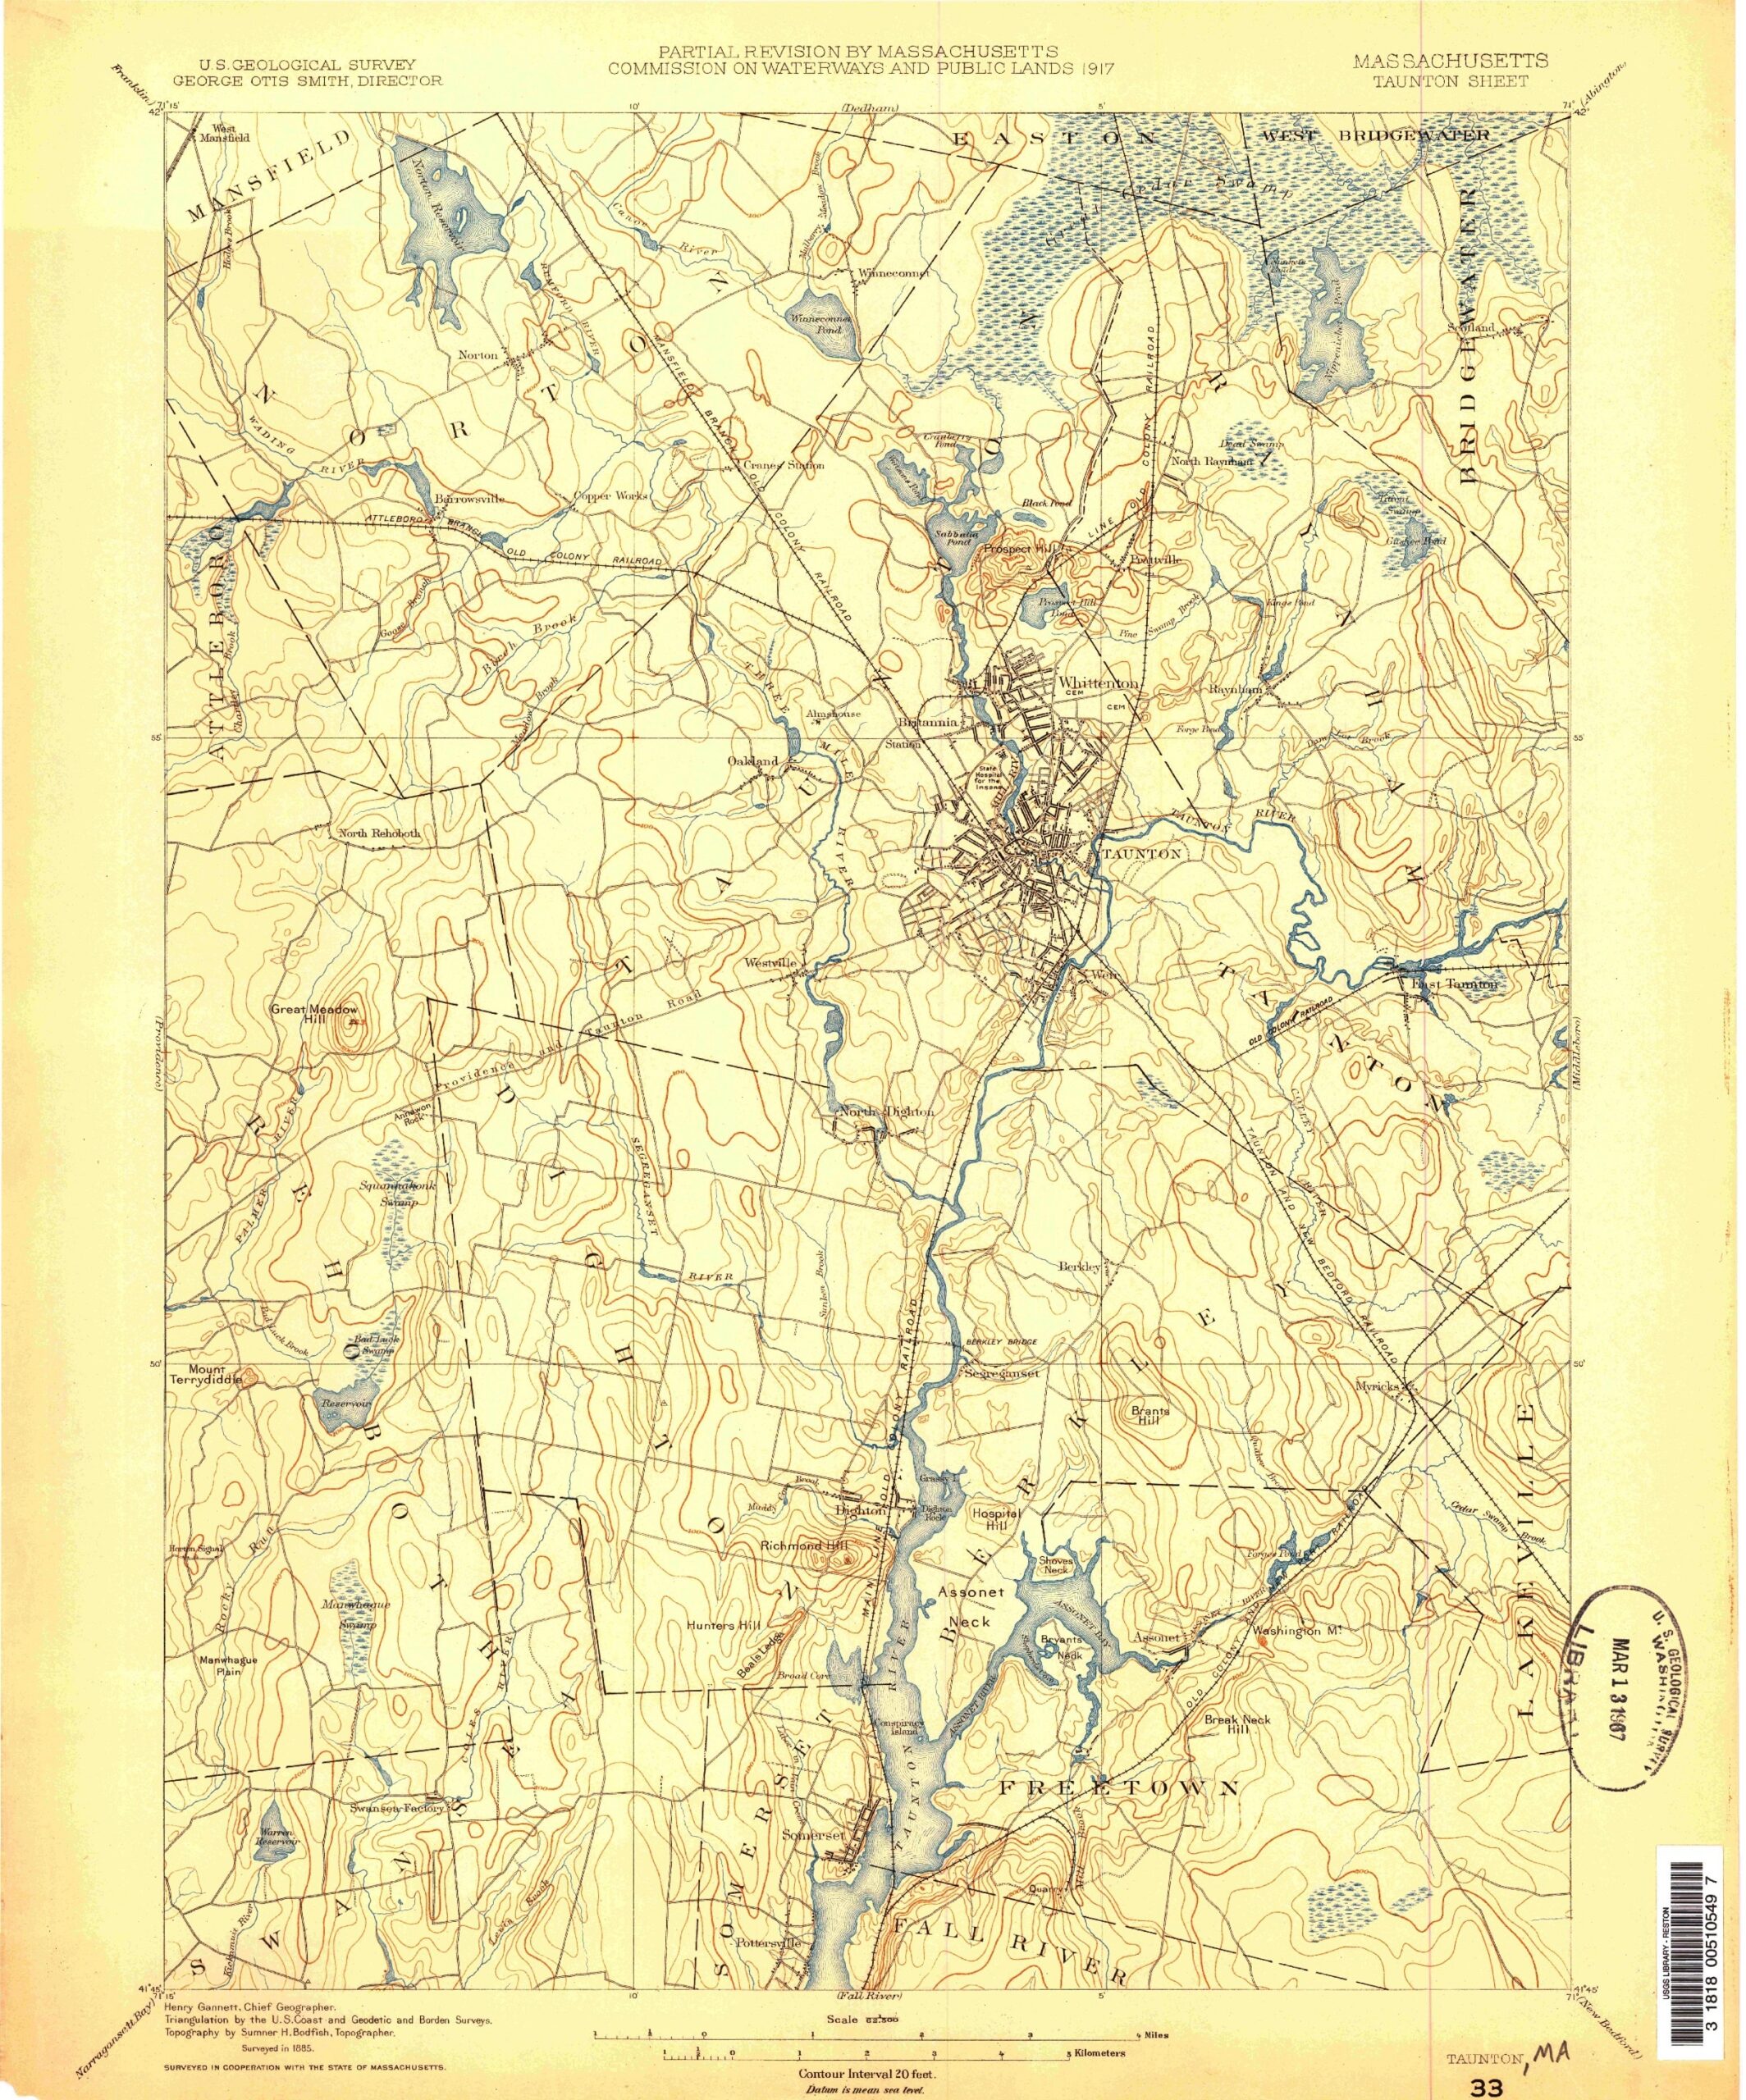
The USGS was established in 1879, with a bold mission to survey and map the natural resources of the United States. Their work spanned everything from geology and mineral resources to water supply and topography. In 1884, the very first USGS historical topographical map was brought to life, covering an area of 4 square miles around the town of Dighton, Massachusetts. It was published in 1985 – see image below. As technology advanced, the USGS continued to produce more topographical maps, expanding their coverage area and painting an increasingly vivid picture of our ever-changing nation.
In the early years, USGS historical topographical maps were produced using a combination of aerial photography, surveying, and hand-drawn cartography. The maps were typically produced at a scale of 1:62,500, meaning that one inch on the map represented 62,500 inches on the ground. This allowed for a high level of detail, with features such as roads, buildings, and landforms clearly depicted.
One of the key advantages of USGS historical topographical maps was their ability to show changes in the landscape over time. This was particularly useful for tracking the impact of human activity on the environment. For example, maps produced in the early 20th century show the rapid expansion of urban areas, the construction of highways and railroads, and the impact of mining and logging on the landscape. By comparing these maps with more recent ones, it is possible to see how the landscape has changed over time.
USGS topographical maps also played a crucial role in the exploration and development of the United States. In the late 19th and early 20th centuries, the USGS collaborated with the US Army to produce maps of the western frontier, helping to open up new areas for settlement and resource extraction. These maps were also used by government agencies, including the Forest Service and the National Park Service, to manage public lands and natural resources.
During World War II, USGS historical topographical maps played a critical role in military planning and operations. The US Army and Navy used the maps to plan troop movements, locate enemy positions, and navigate unfamiliar terrain. The maps were also used by civilian agencies, such as the Office of Strategic Services, for intelligence gathering and analysis.
In the post-war years, the USGS continued to produce topographical maps, but with some changes in technology and methodology. The introduction of aerial photography and satellite imagery allowed for more detailed and accurate maps, while advances in cartography led to the development of computer-generated maps.
Despite these changes, USGS historical topographical maps remain an important resource for a wide range of users. They are used by government agencies, researchers, and private citizens for a variety of purposes, including land use planning, environmental management, and historical research. The maps are also popular with outdoor enthusiasts, who use them for hiking, camping, and other outdoor activities.
One of the key benefits of USGS historical topographical maps is their ability to show the natural and cultural features of the landscape in great detail. This includes everything from mountain ranges and rivers to individual buildings and road networks. By examining historical topographical maps, it is possible to see how the physical and human landscape has changed over time. For example, changes in land use patterns can be observed by comparing maps from different time periods. This can be particularly useful for understanding how urban areas have expanded and how agricultural land use has changed over time.
Historical topographical maps can also provide valuable insights into the natural environment. By examining maps from different time periods, it is possible to track changes in the distribution of vegetation, wetlands, and other natural features. This can be particularly useful for studying the impacts of climate change and other environmental factors on the landscape.
In addition to their scientific and historical value, USGS historical topographical maps also have cultural significance. They are a testament to the ingenuity and perseverance of the early surveyors and cartographers who produced them. They also provide a visual record of the country’s physical and cultural history, from the early settlement of the frontier to the development of modern cities and transportation networks.
Today, the USGS continues to produce topographical maps, using a combination of aerial photography, satellite imagery, and other advanced technologies. The maps are available in digital and print formats, with a variety of scales and detail levels. The USGS also provides a range of other geographic information products and services, including satellite imagery, elevation data, and land cover data.
Despite the availability of newer and more advanced mapping technologies, USGS topographical maps remain an important and valuable resource. Their historical and cultural significance, as well as their ability to provide detailed and accurate information about the physical and human landscape, make them a valuable tool for a wide range of users. From government agencies to researchers to outdoor enthusiasts, USGS topographical maps continue to play a vital role in our understanding of the United States and its landscape.
The USGS historical topographic maps are highly detailed and include various features that make them an invaluable resource.
- Contours – The maps show contours, which represent changes in elevation, and are typically spaced at intervals of 10 or 20 feet. By looking at the contour lines, you can get a sense of the shape of the land, the steepness of slopes, and the location of valleys and ridges.
- Natural Features – In addition to the contours, the maps include other natural features such as rivers, lakes, and forests. The maps also show man-made features such as roads, buildings, and boundaries. The maps are updated regularly to reflect changes in the landscape, including new roads, buildings, and changes in the terrain due to natural causes such as landslides and erosion. h
- Symbols – USGS historical topographic maps use a wide variety of symbols to represent different features of the landscape. These symbols have changed over time. For example, blue lines are used to represent water sources such as rivers, lakes, and streams, while brown lines are used to represent contour lines. Other symbols are used to represent roads, trails, buildings, and other features.
- Scale – USGS historical topographic maps are designed to be highly detailed, with a high level of resolution. However, in order to fit an entire area on a single sheet of paper, the maps are typically drawn at a smaller scale than the actual landscape. The scale of the map is indicated in the legend, and it tells you how many feet or meters are represented by one inch or one centimeter on the map.
- Legend – The legend is an important part of any USGS historical topographic map. It provides a key to the symbols and colors used on the map, as well as other important information such as the scale of the map and the date it was created.
- Grid System – SGS historical topographic maps use a grid system to help you locate specific features on the map. The grid is typically drawn using lines that run parallel to the edges of the map, and each line is labeled with a letter or number. By using the grid, you can easily find the location of a particular feature on the map.
Sample USGS Historical Topographic Maps
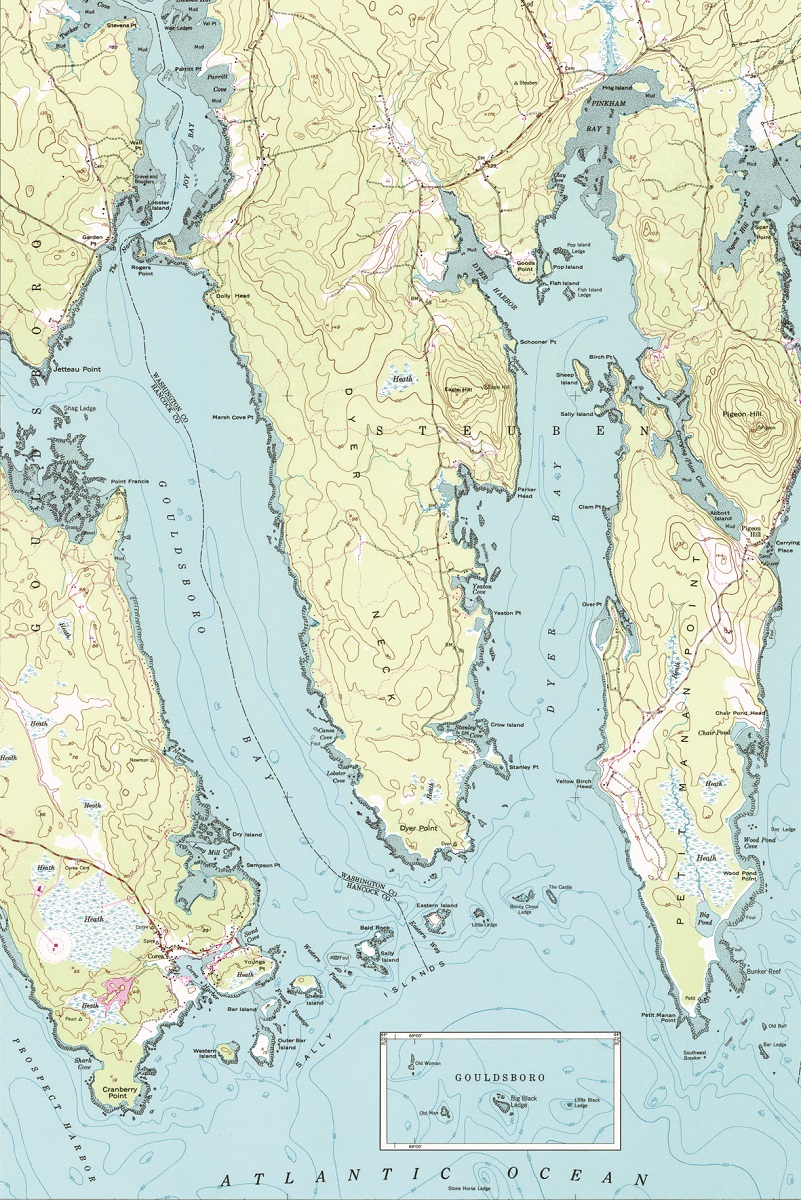
Petit Manan Point Maine 1948-USGS Topographic Map
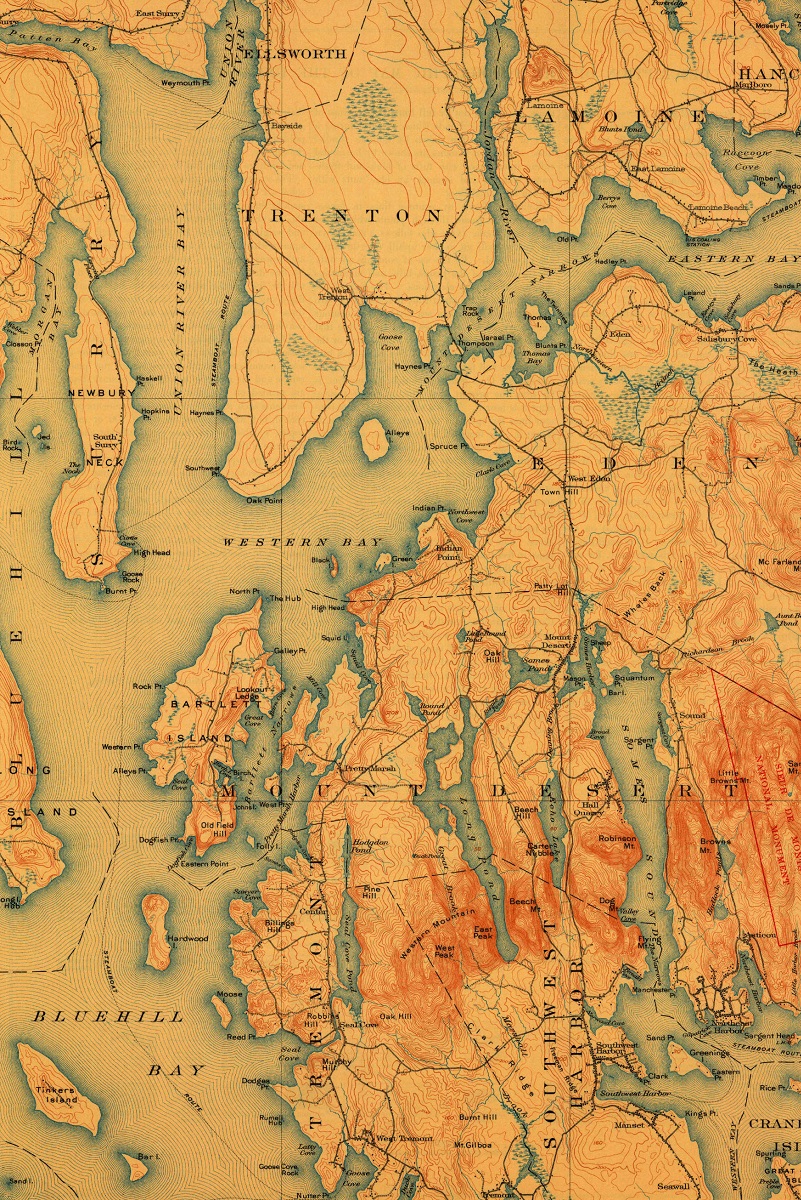
Acadia National Park 1904-USGS Topographic Map
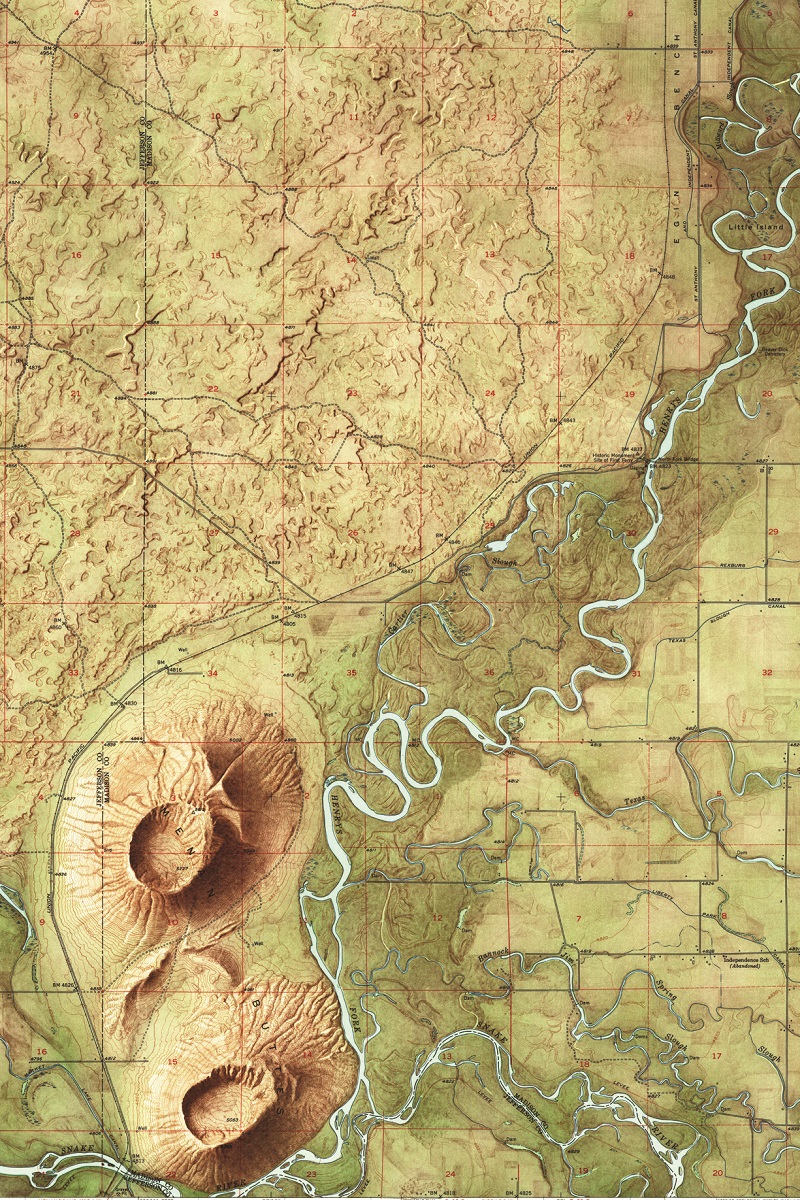
Menan Buttes Idaho 1951-USGS Topographic Map
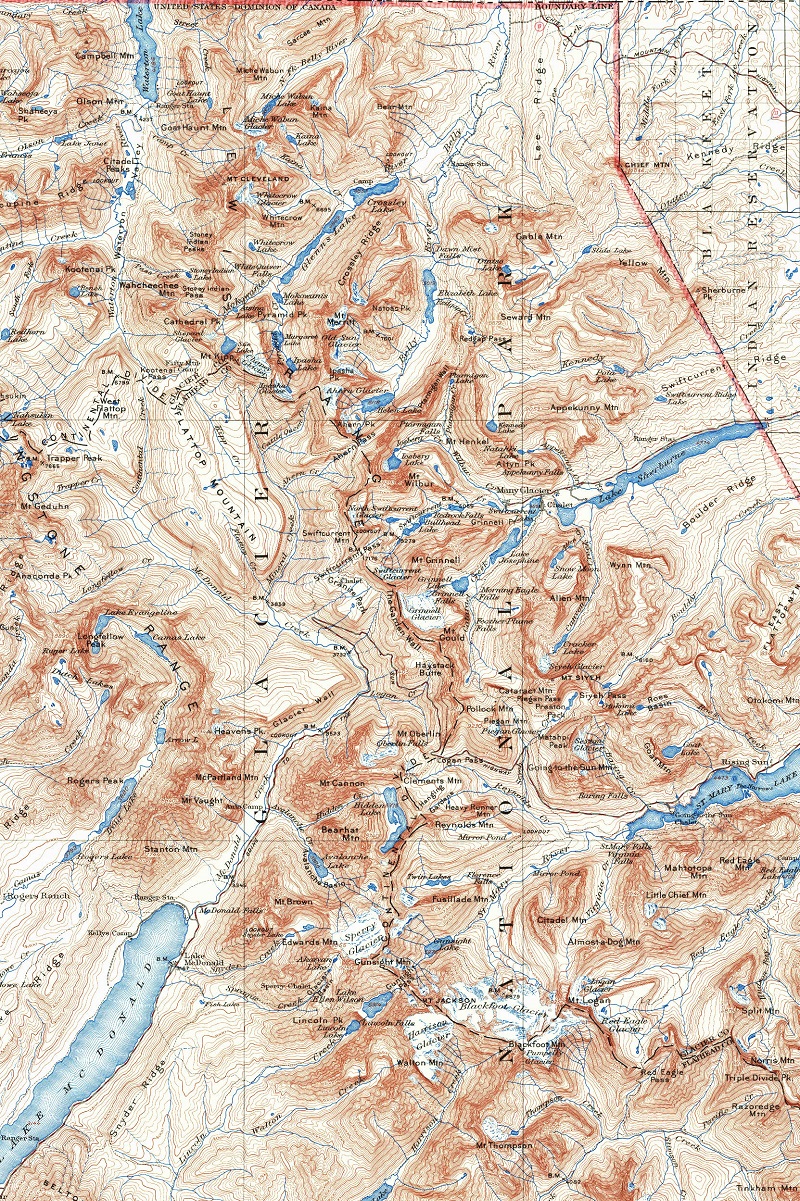
Glacier National Park 1938-USGS Topographic Map
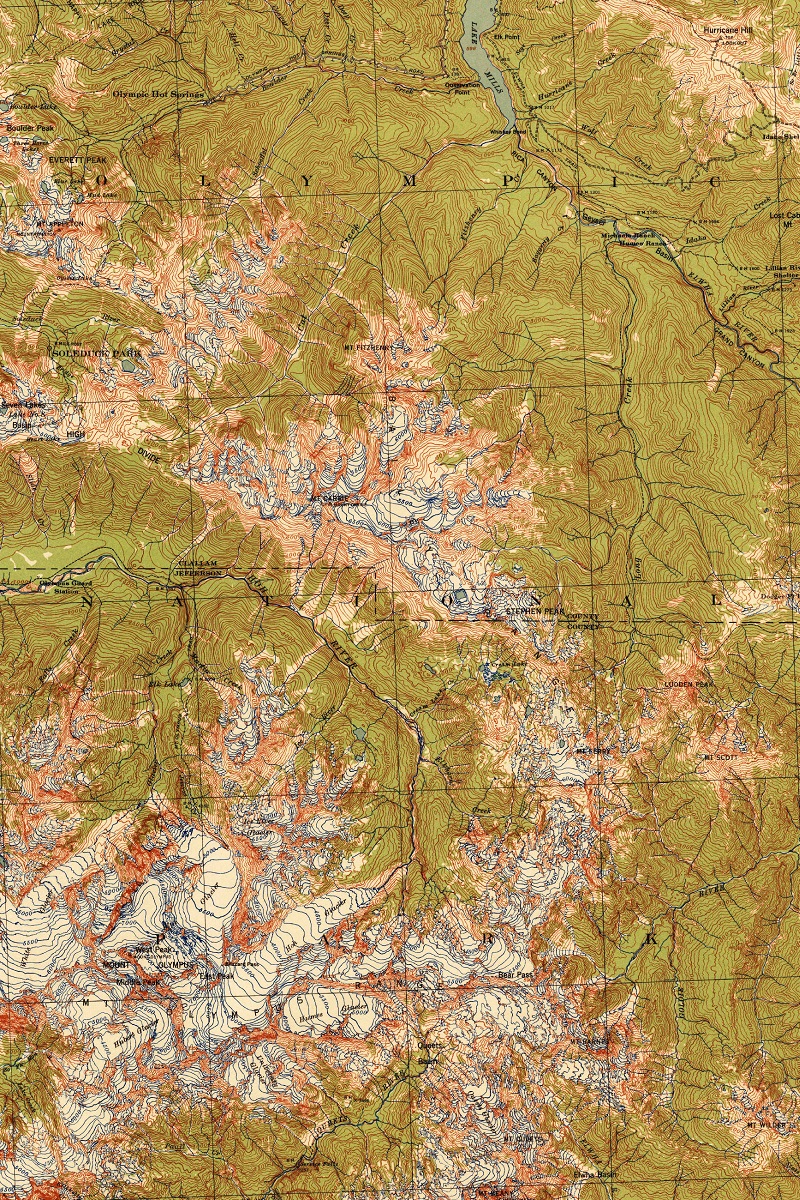
Mount Olympus Washington 1942-USGS Topographic Map
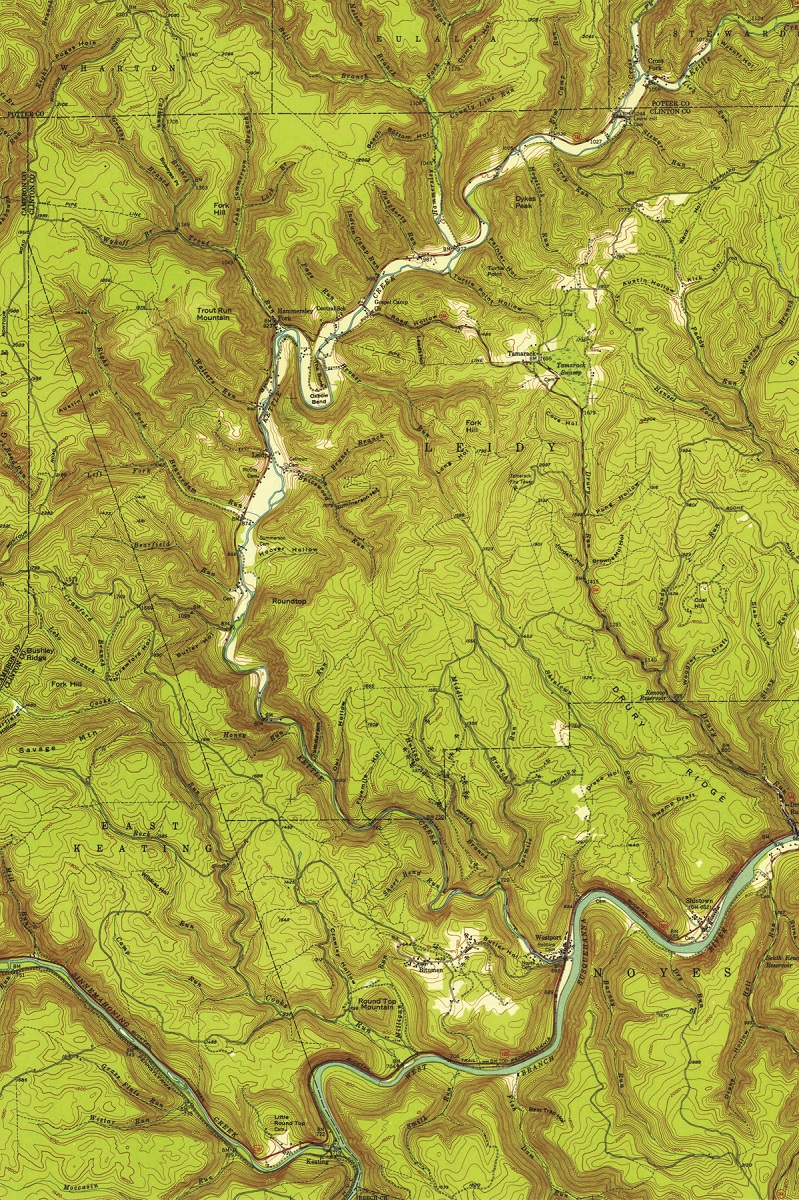
Renovo Pennsylvania 1946-USGS Topographic Map
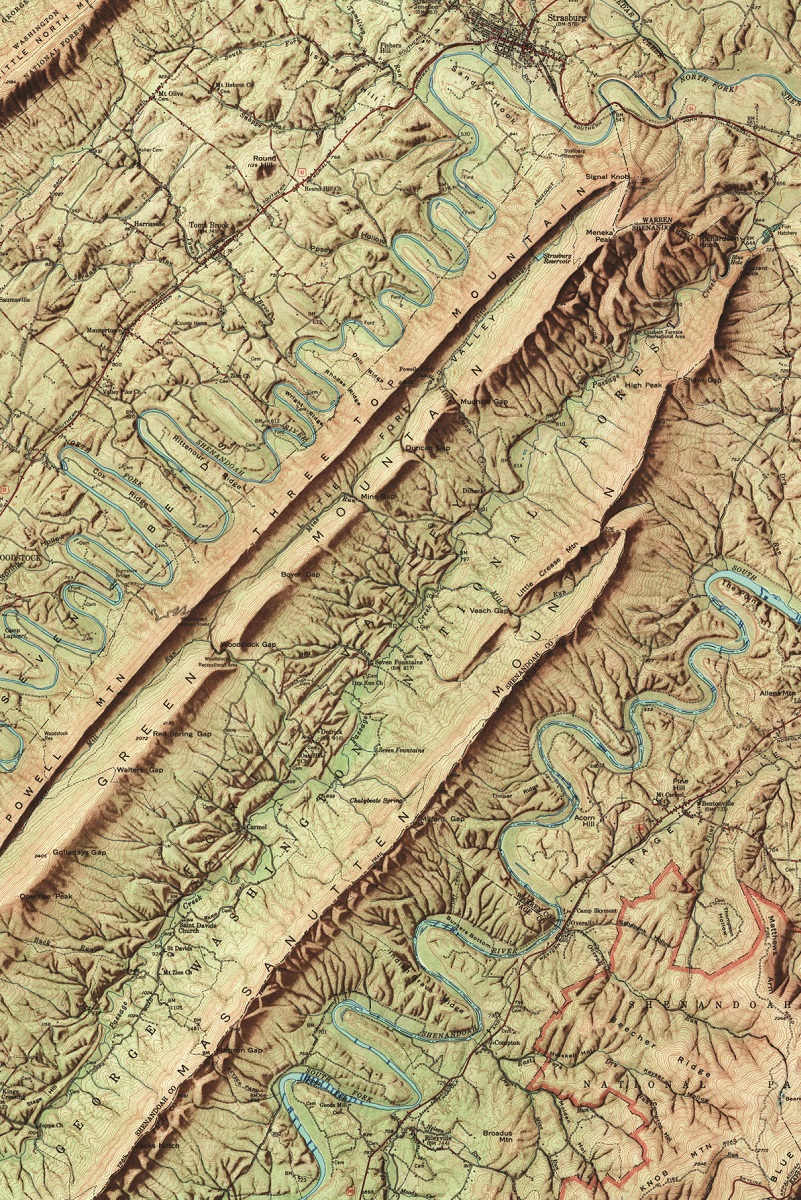
Strasburg Virginia 1947-USGS Topographic Map
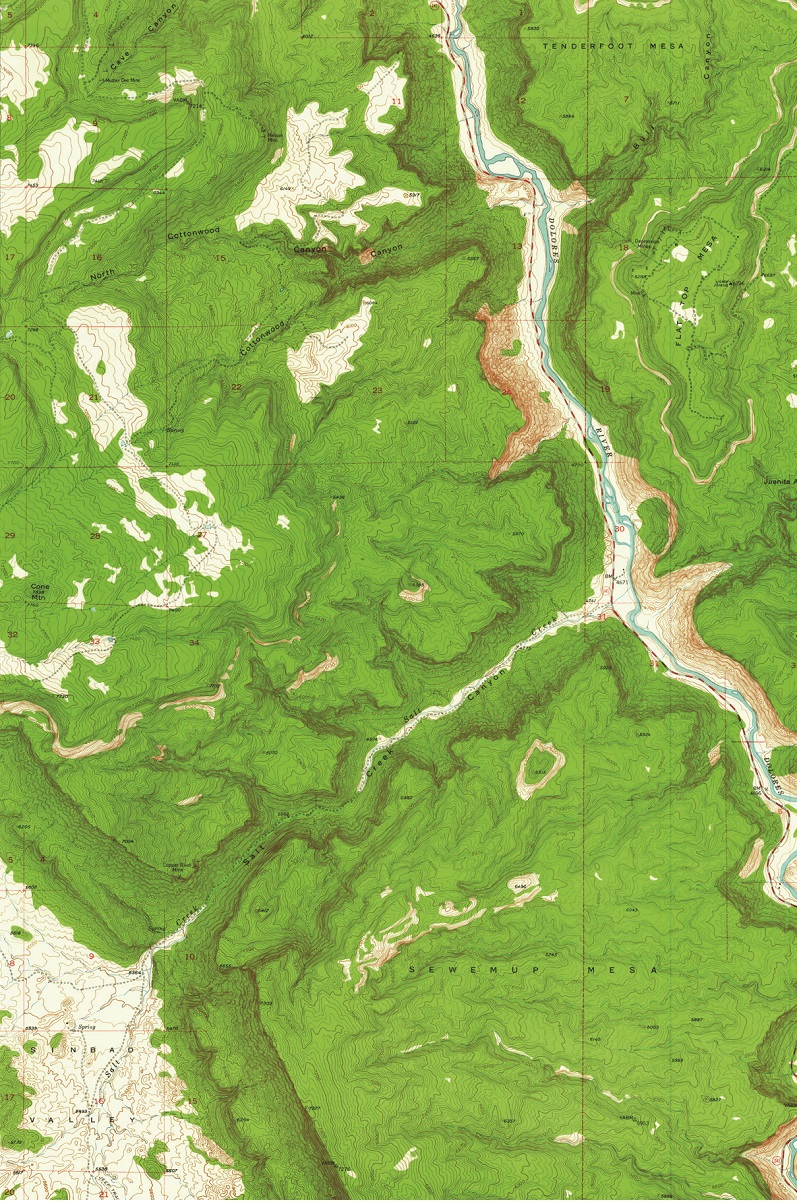
Jaunita Arch Colorado 1960-USGS Topographic Map
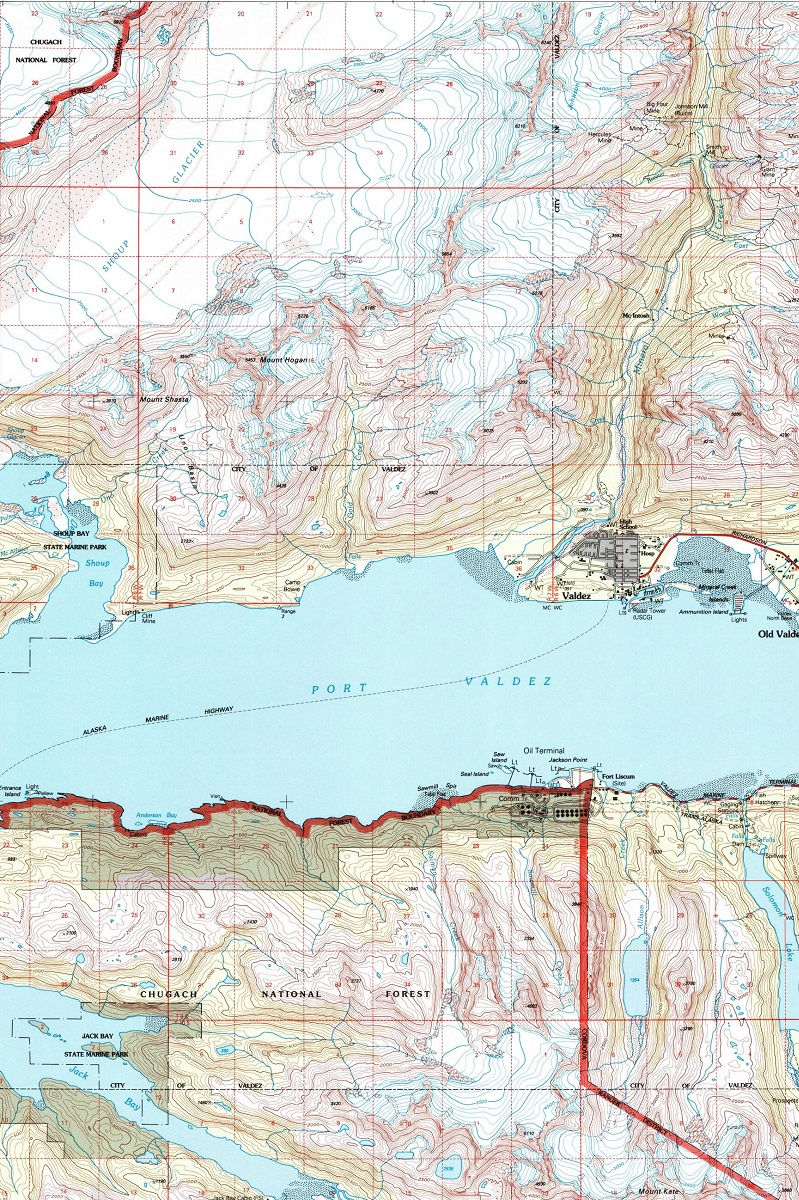
Valdez Alaska 1996-USGS Topographic Map
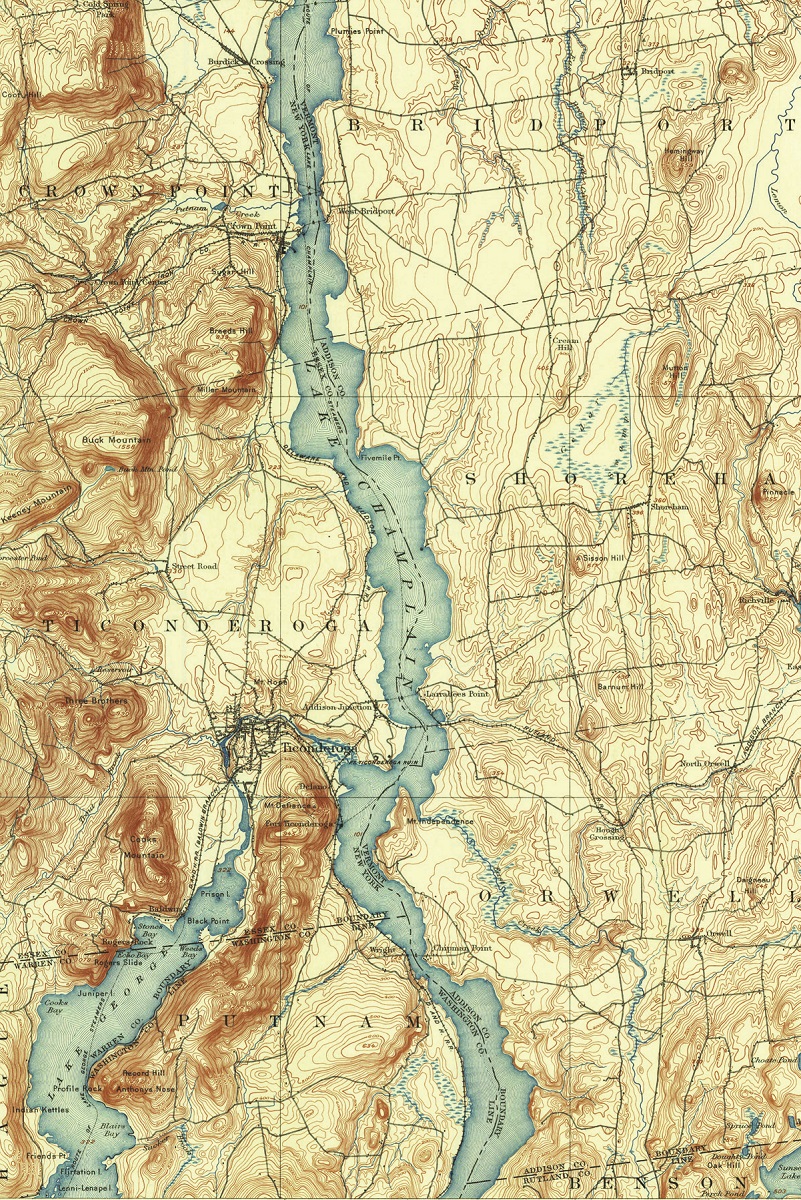
Ticonderoga New York 1894-USGS Topographic Map
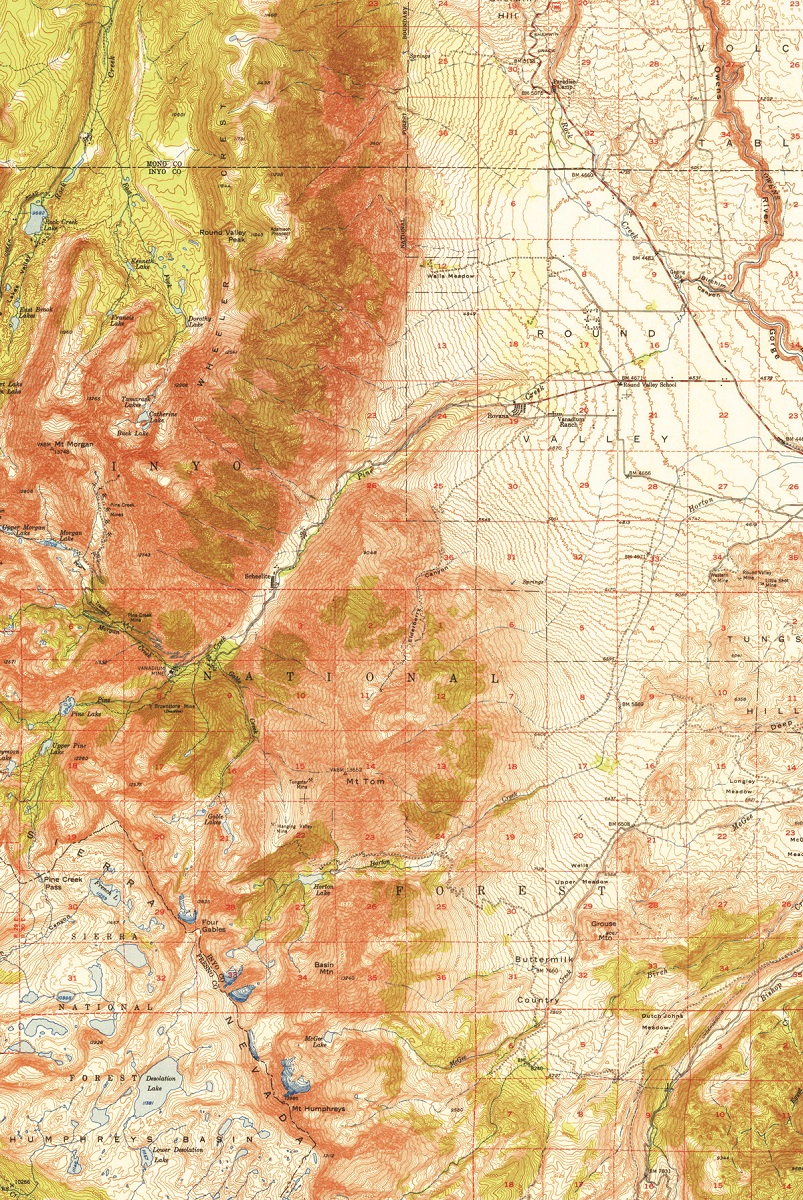
Mount Tom California 1951-USGS Topographical Map
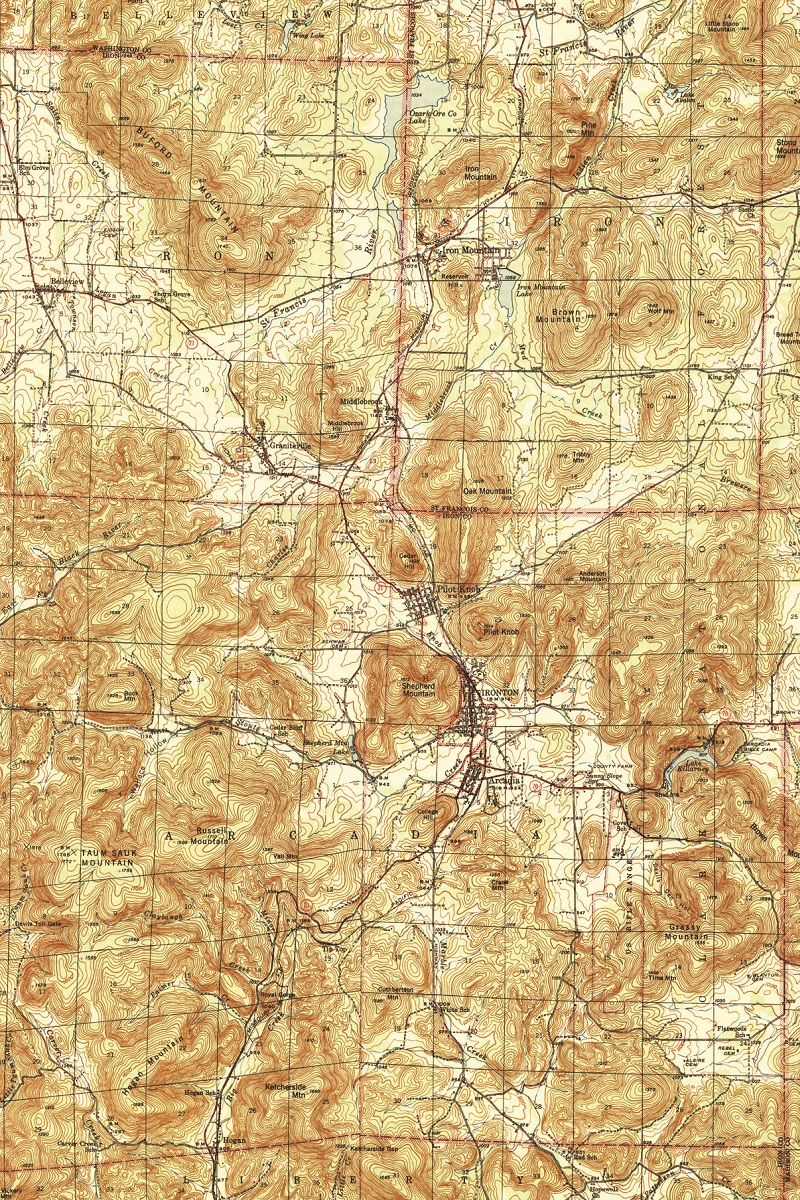
Ironton Missouri 1946-USGS Topographic Map
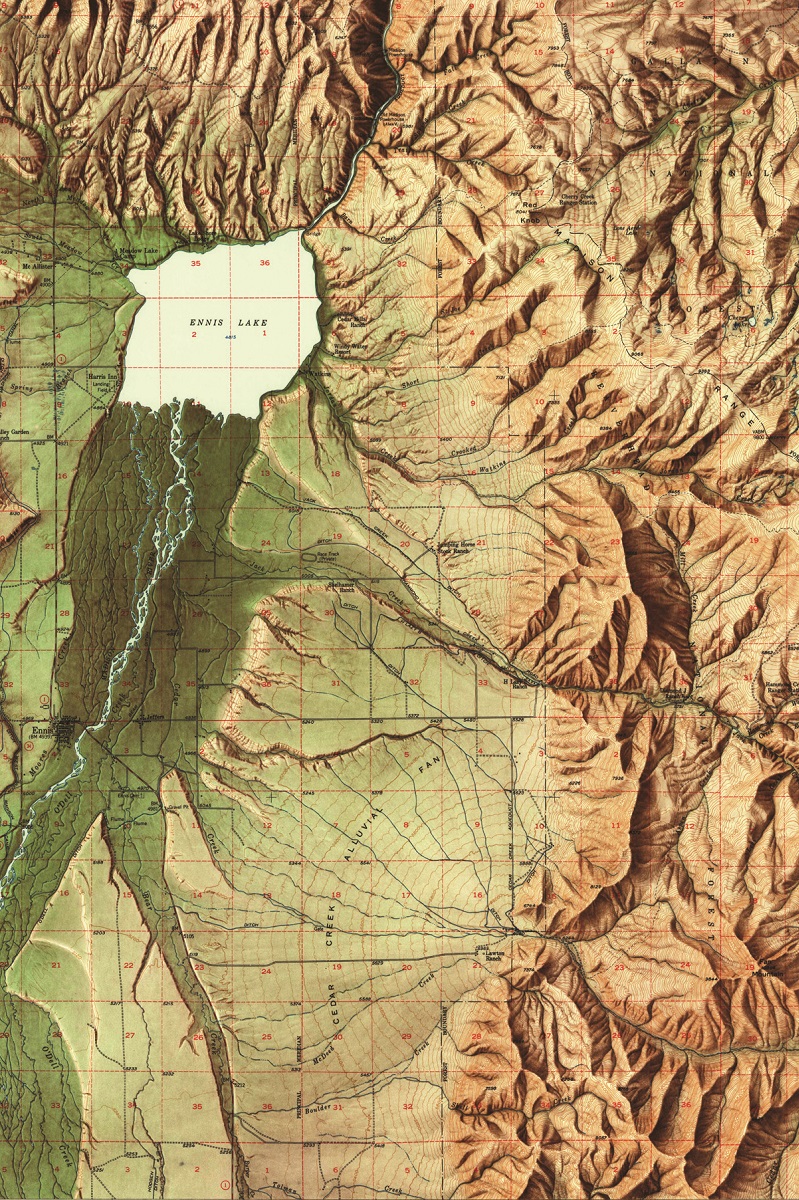
Ennis Montana 1949-USGS Topographic Map
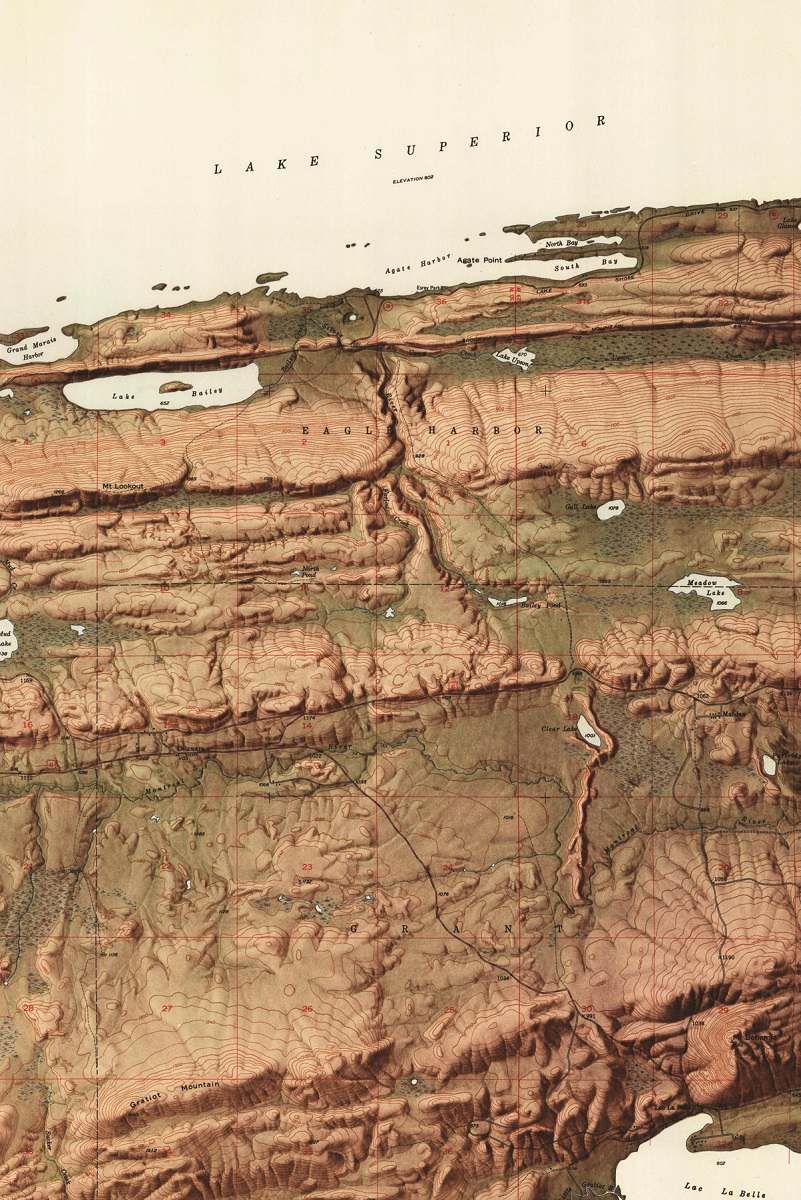
Delaware Michigan 1949-USGS Topographic Map
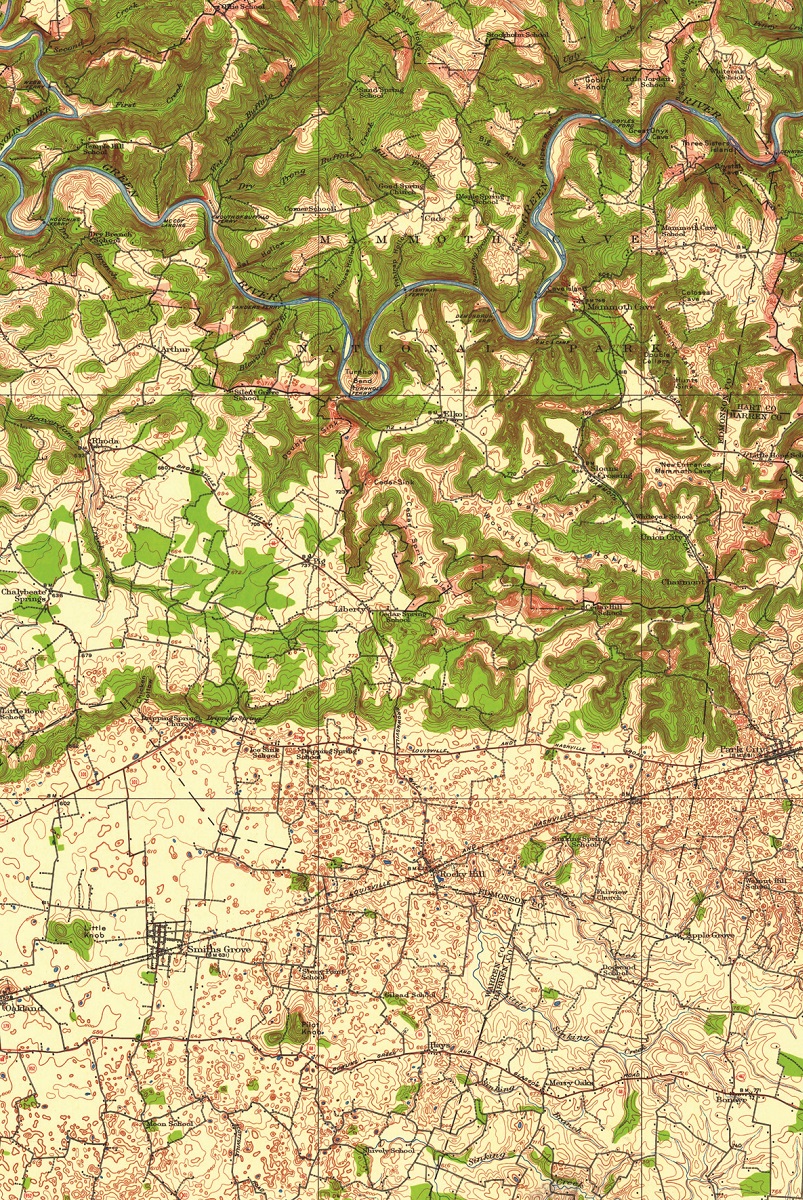
Mammoth Cave Kentucky 1922-USGS Topographic Map
USGS historical topographic maps have been used for a wide variety of purposes. Some of the most common uses of these maps include:
- Land Management – USGS historical topographic maps are also used by land managers, such as park rangers and forestry officials. These maps can help them identify areas that are suitable for development, as well as areas that need to be protected due to their natural, cultural, or ecological significance.
- Geology and Earth Science – USGS historical topographic maps are an important tool for geologists and other earth scientists. These maps can help them identify geological features such as faults, folds, rock formations, and mineral deposits. They can also be used to study the effects of erosion, weathering, and other natural processes on the landscape.
- Surveying and Mapping – USGS historical topographic maps are often used as a reference tool by surveyors and cartographers. These maps can provide detailed information about the terrain and other features of an area, which can be used to create more accurate maps and to plan construction projects.
- Education and Research – USGS historical topographic maps are also used in schools and universities as a teaching tool. They can help students understand the geography and geology of a particular region, as well as the impact of human activity on the landscape.
- Urban Planning – USGS historical topographic maps are used to map out existing infrastructure such as roads, buildings, and water supply systems. The maps are also used to identify potential areas for development and to determine the best locations for new infrastructure projects.
- Navigation – USGS historical topographic maps are also invaluable in navigation, especially for hikers, mountaineers, and other outdoor enthusiasts. The maps provide detailed information on the terrain, including contours, trails, and water sources, which is crucial for planning routes and navigating through unfamiliar terrain. The maps also include information on natural hazards such as steep cliffs, avalanches, and rockfalls, which is essential for safety planning.
- Treasure Hunting – USGS historical topographic maps can also be used as a tool when searching for lost treasures. See below some sample maps of general locations of lost treasures.
In addition to the above applications, the USGS historical topographic maps are also used in various other fields such as forestry, agriculture, and transportation planning.
USGS historical topographic maps are a valuable tool for anyone who needs detailed information about the landscape. These maps provide a wealth of information about the terrain, elevation, and other features of an area, and they can be used for a wide variety of purposes. Whether you are a hiker, a geologist, a surveyor, or simply a curious explorer, USGS topographic maps can help you navigate and understand the world around you.
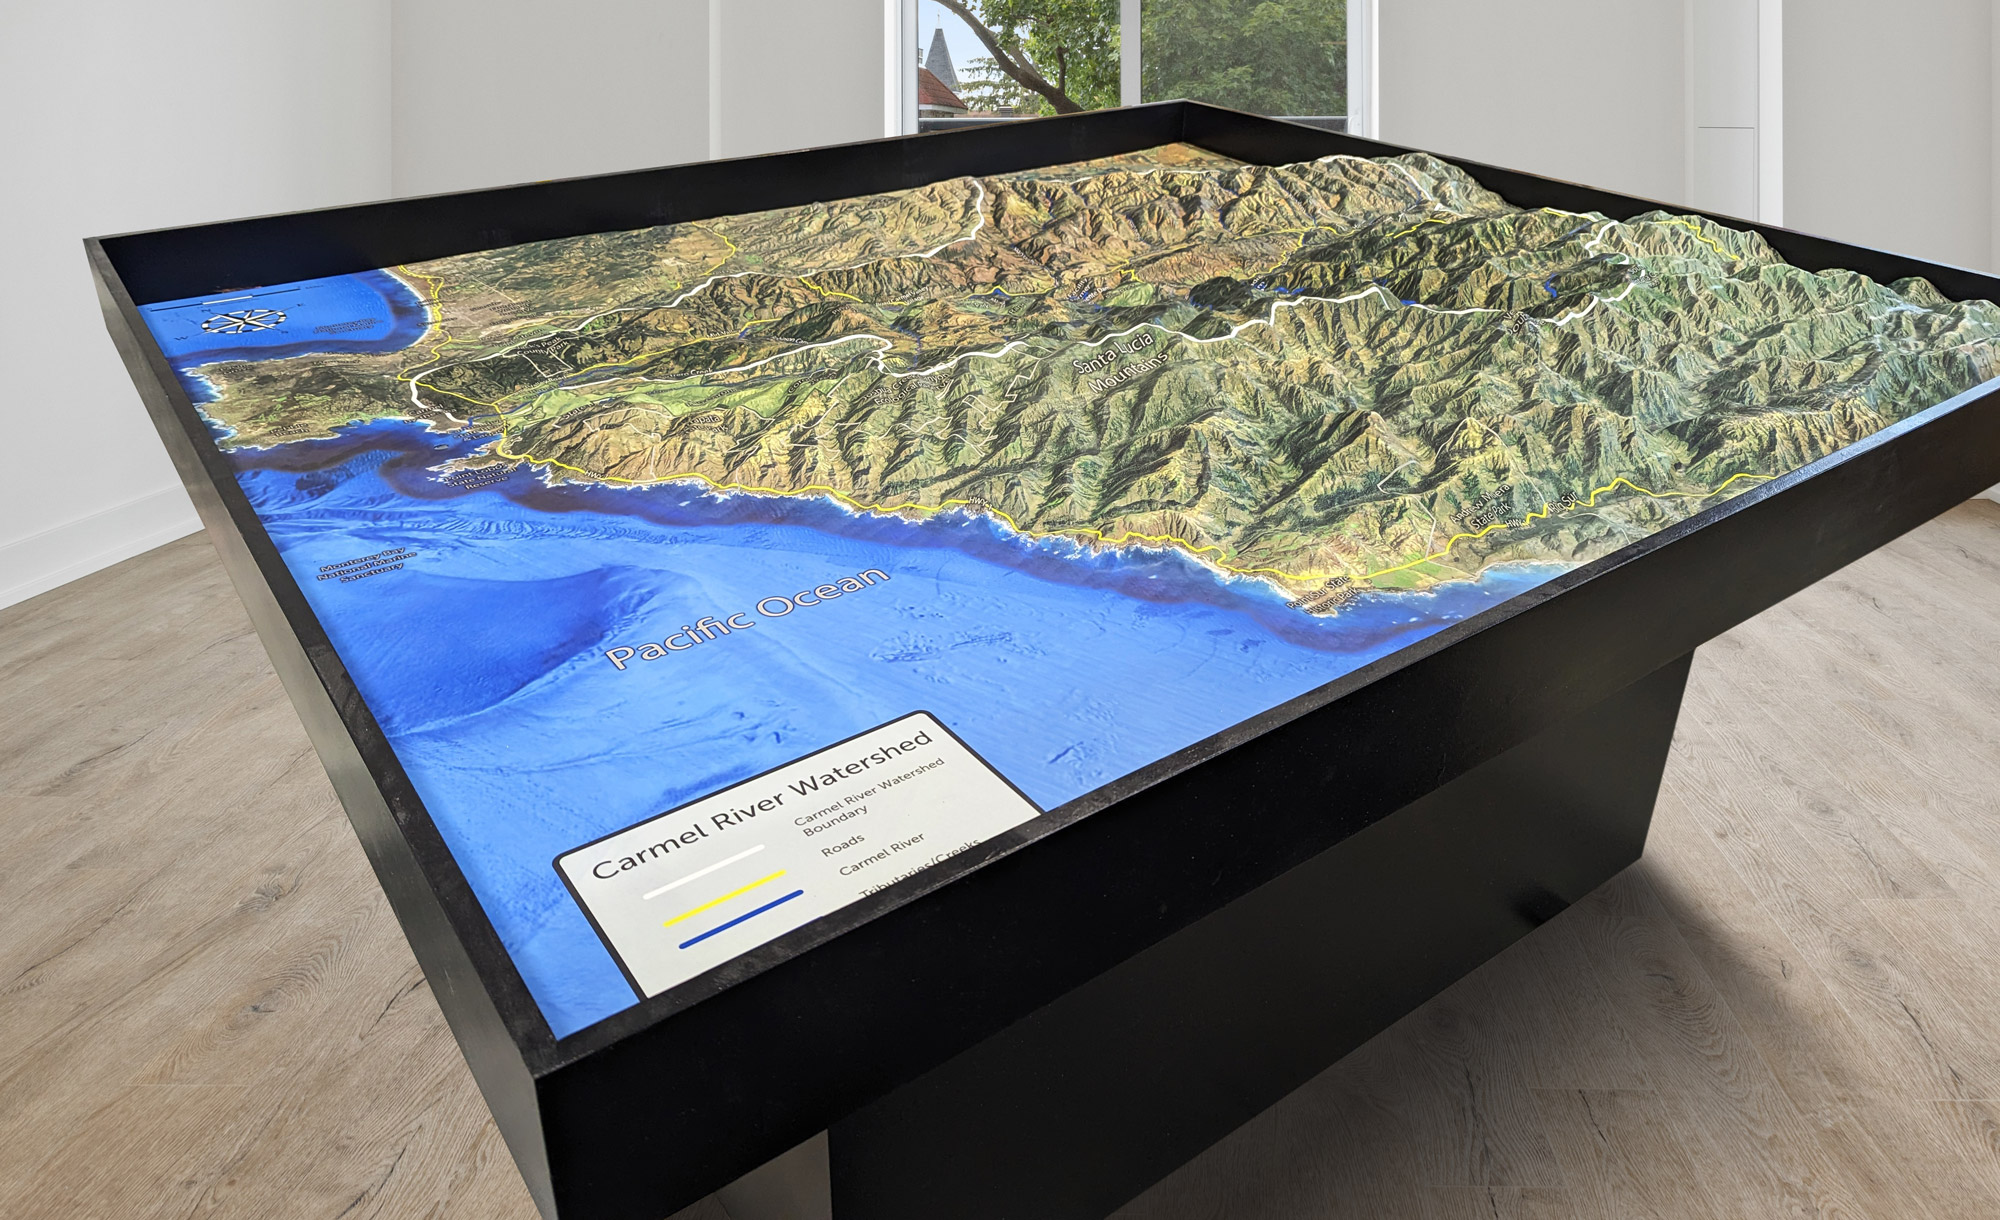
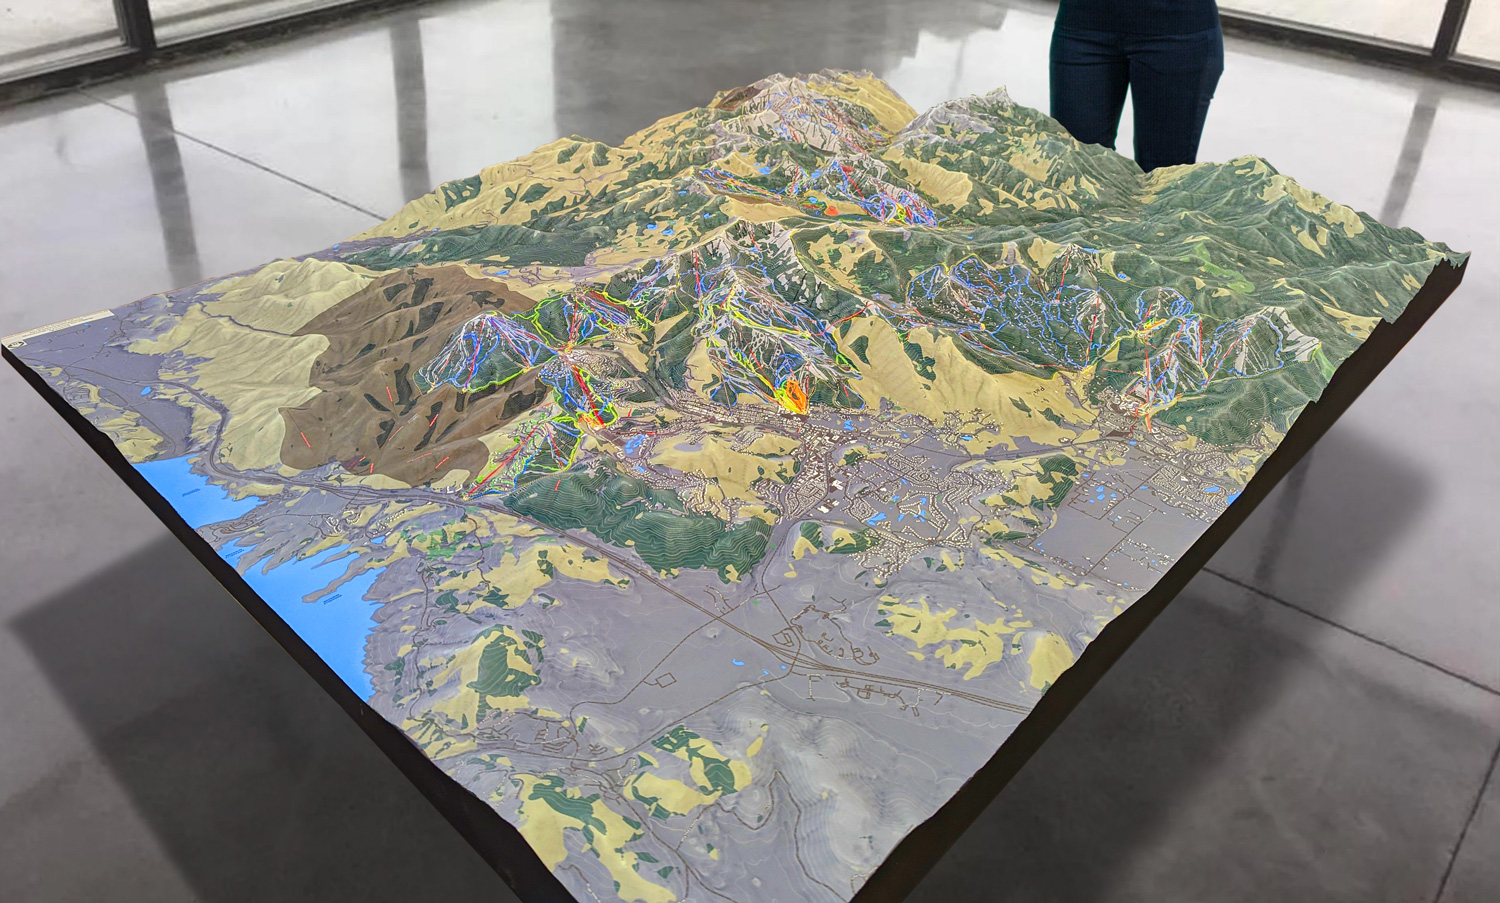
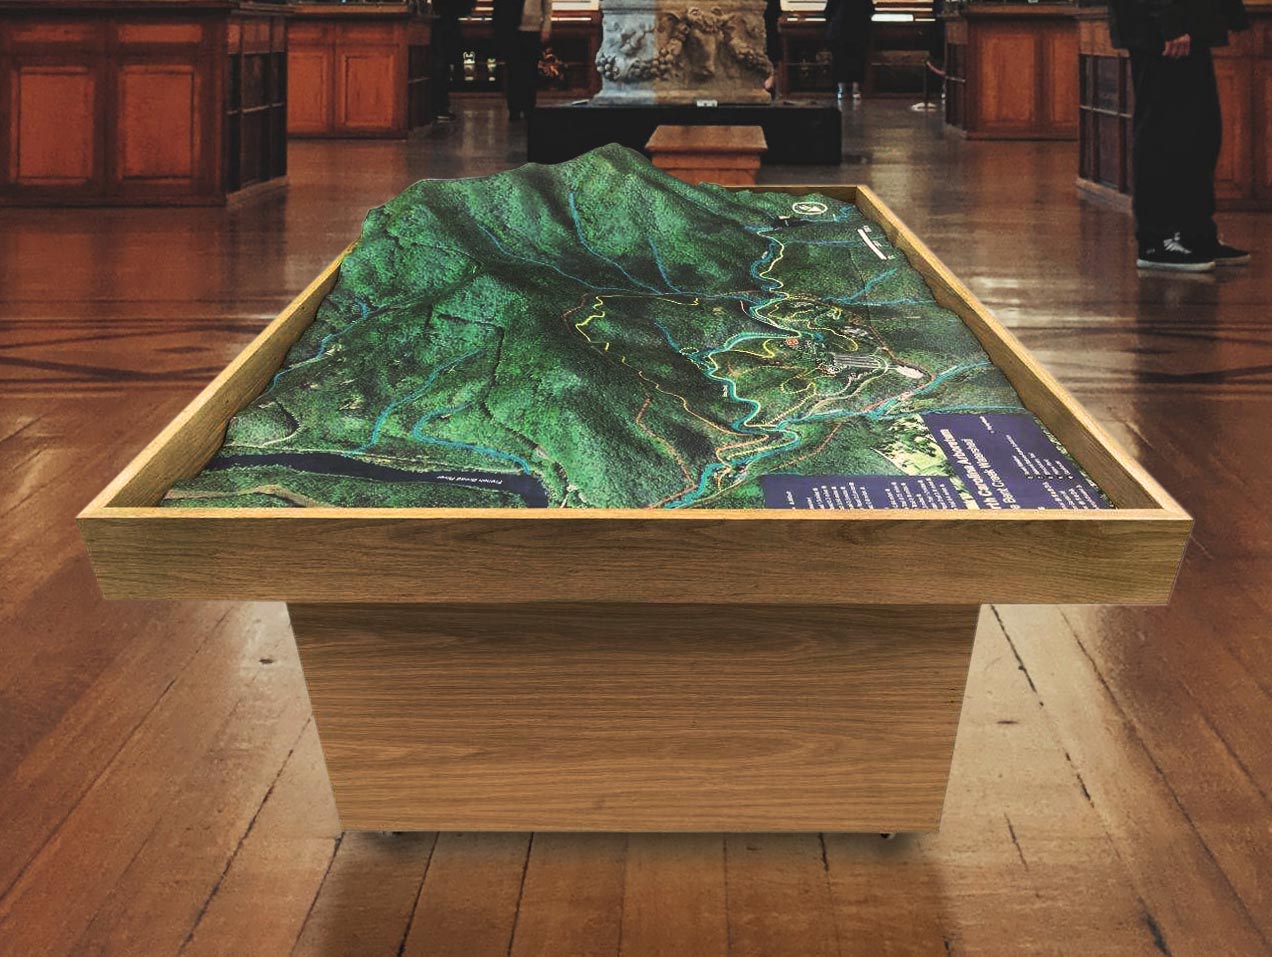
Our high-quality maps and models are on display at museums, national parks, university campuses, sports facilities, hospitals, and research organizations worldwide. One of our more recent 3D topography projects was of the Great Smoky Mountains National Park and the surrounding area. This large topography map covered over 1.2 million acres in a 91″ x 56″ frame.
We meld top-of-the-line technologies with professional cartography resources to create stunning historical topographical maps and models. Our expertise in 3D printing enables us to allow more markets to benefit from purchasing durable, portable, and affordable models.
Sample USGS Historical Topographic Maps of Lost Treasure Sites
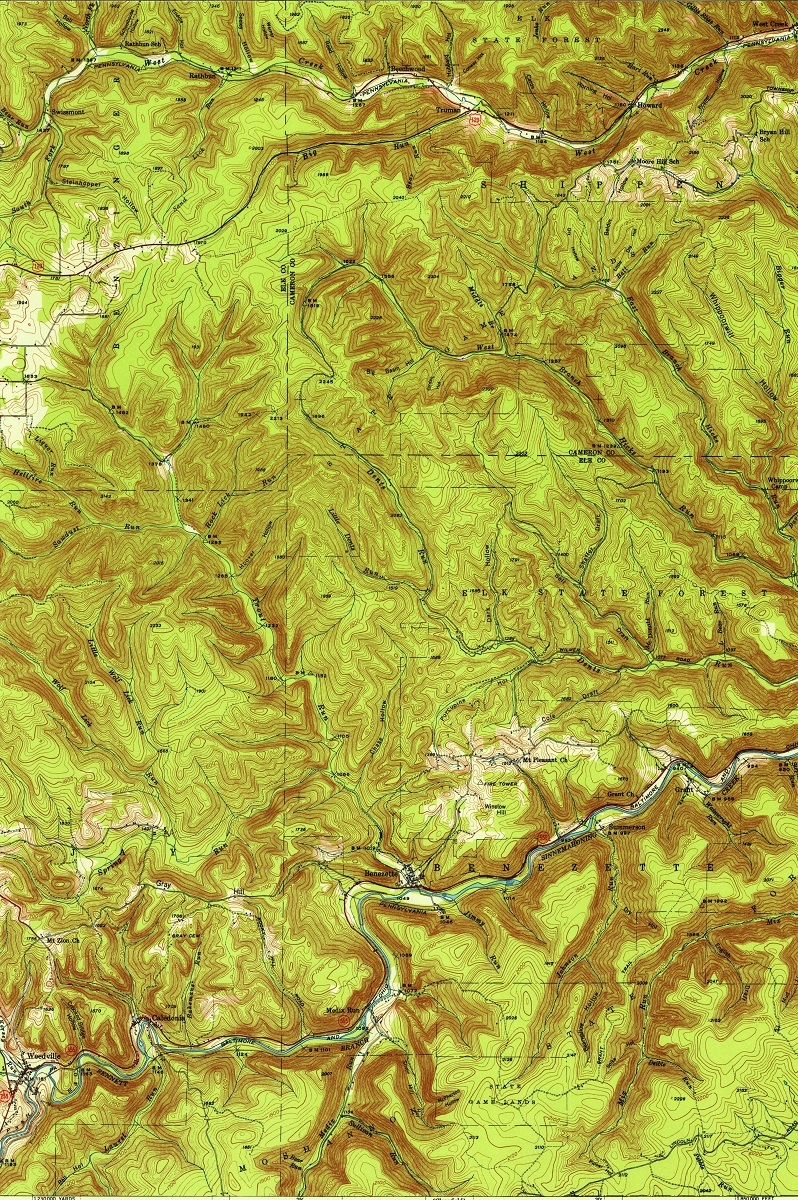
Pennsylvania Civil War Gold-Dent’s Run, Pennsylvania 1941-USGS Topographic Map
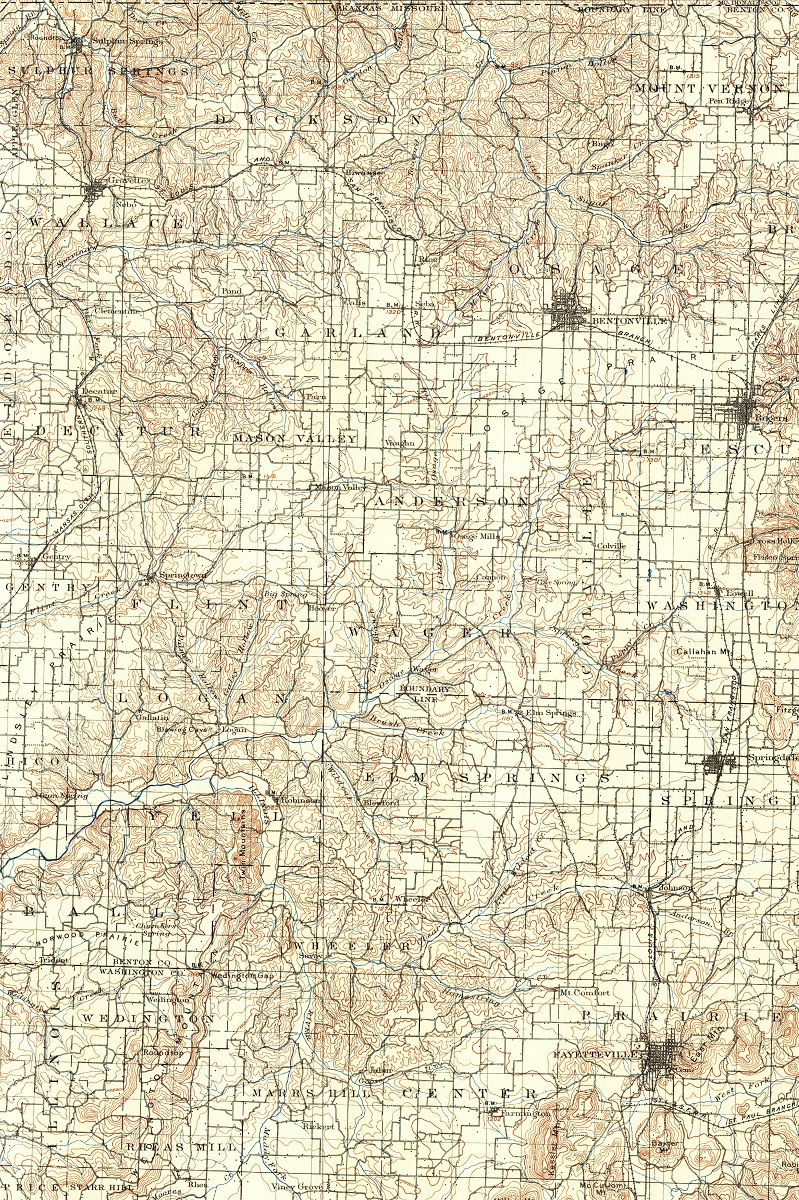
The Old Spanish Treasure Cave-Sulphur Springs, Arkansas 1899-USGS Topographic Map
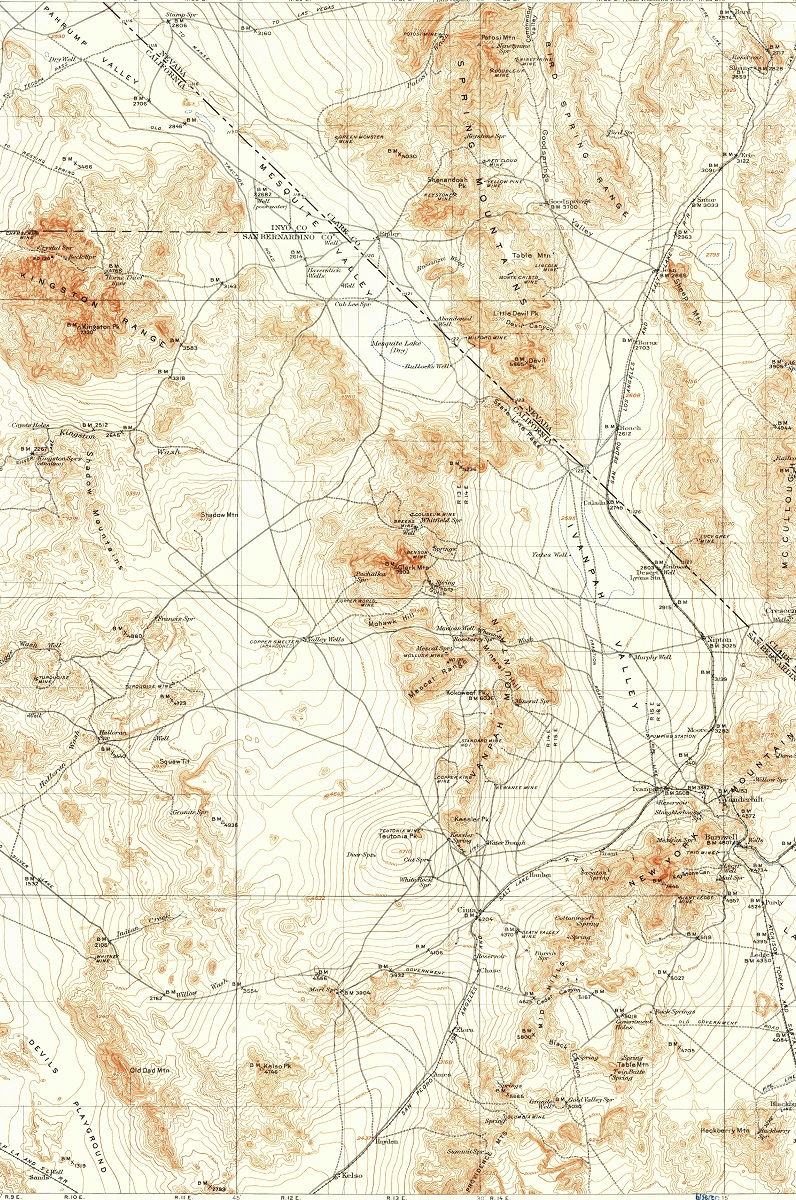
Lost River of Gold-Kokoweef Peak, California 1910-USGS Topographic Map
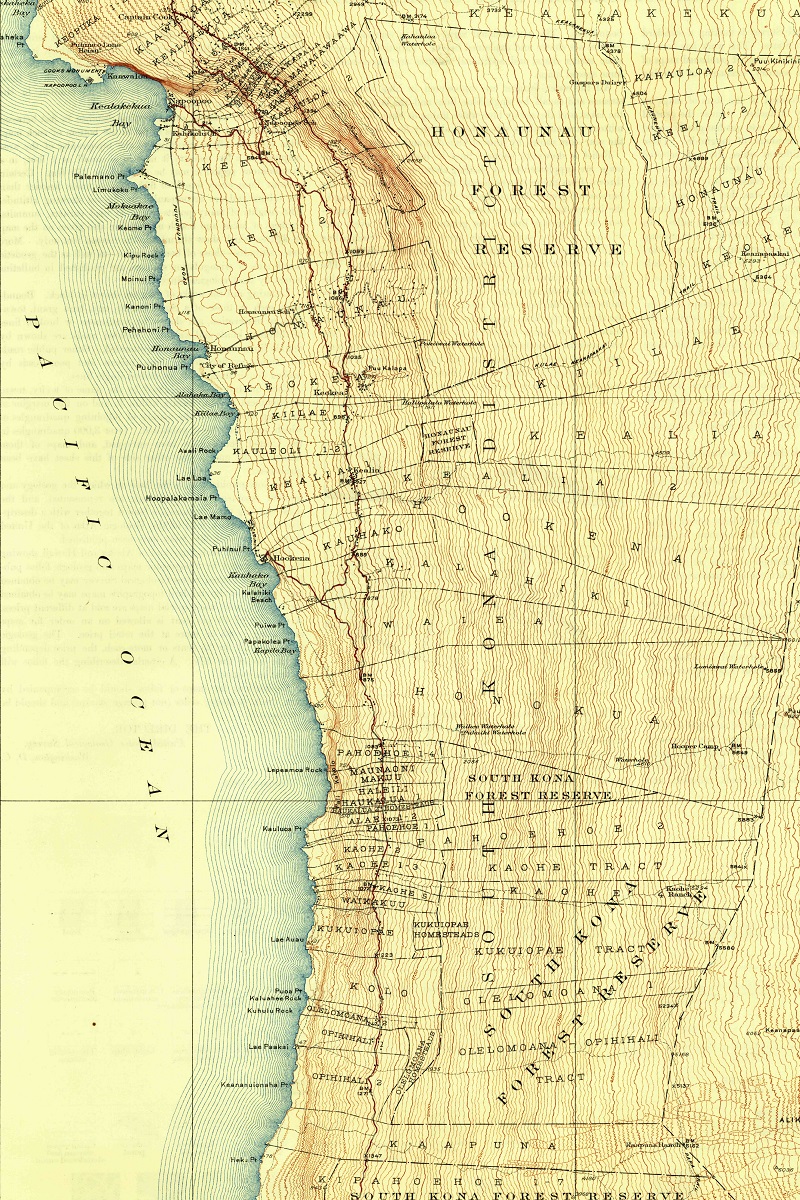
Captain Thomas Cavendish Treasure-Palemano Point, Hawaii 1928-USGS Topographic Map
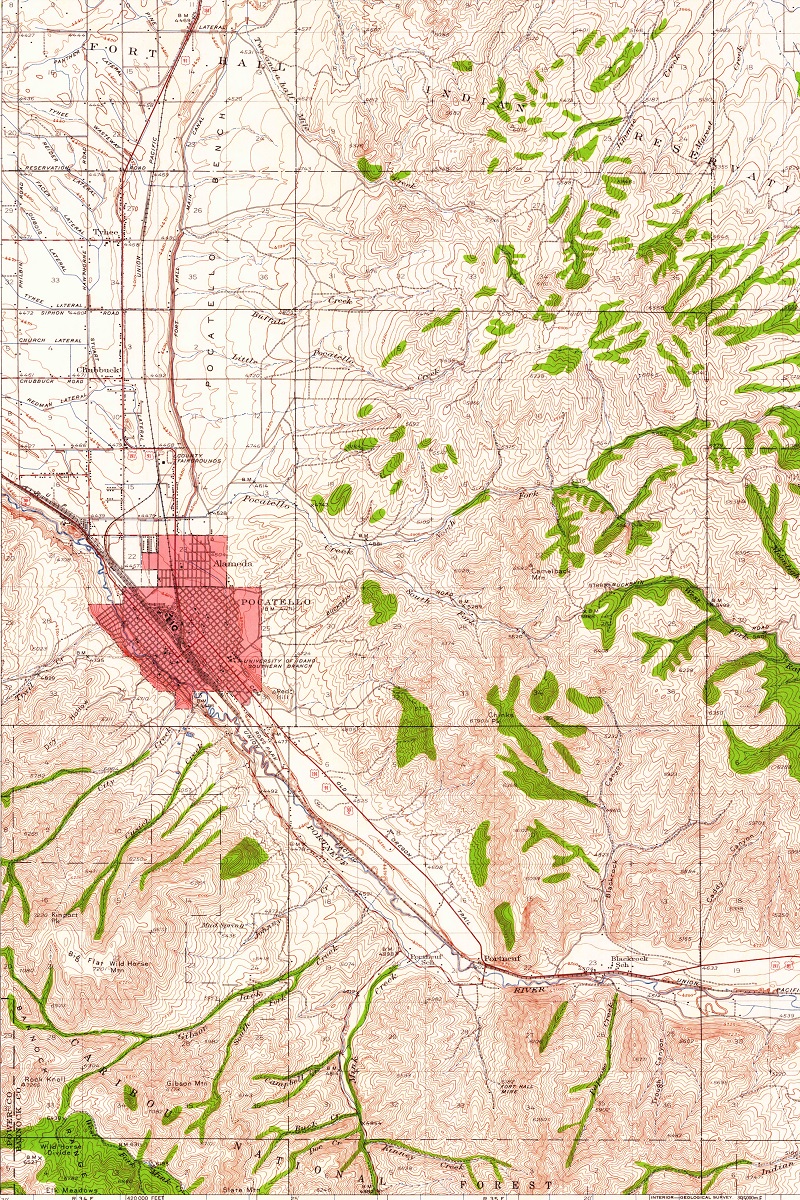
East Idaho Stagecoach Robbery-Portneuf Canyon, Idaho 1937-USGS Topographic Map
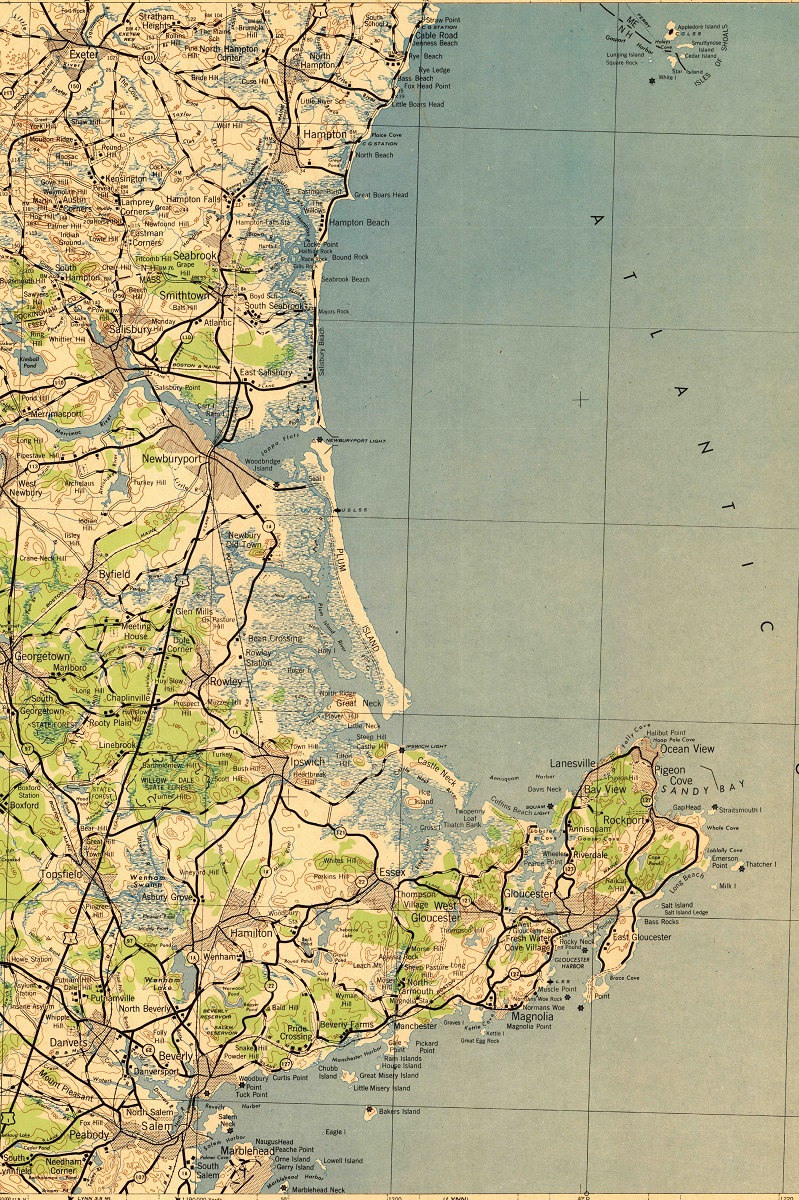
Blackbeards Treasure-Islands at Isle of Shoals, New Hampshire 1943-USGS Topographic Map
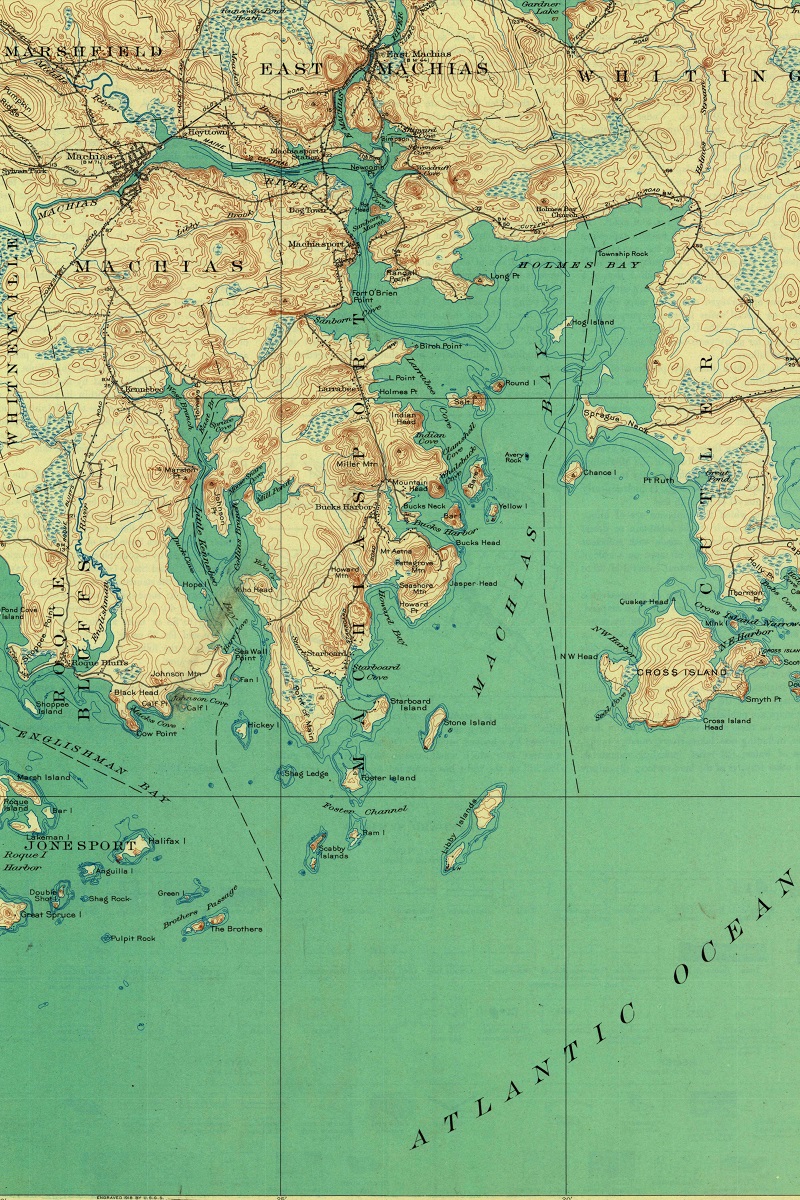
The Bellamy Treasure-Machiasport, Maine 1918-USGS Topographic Map
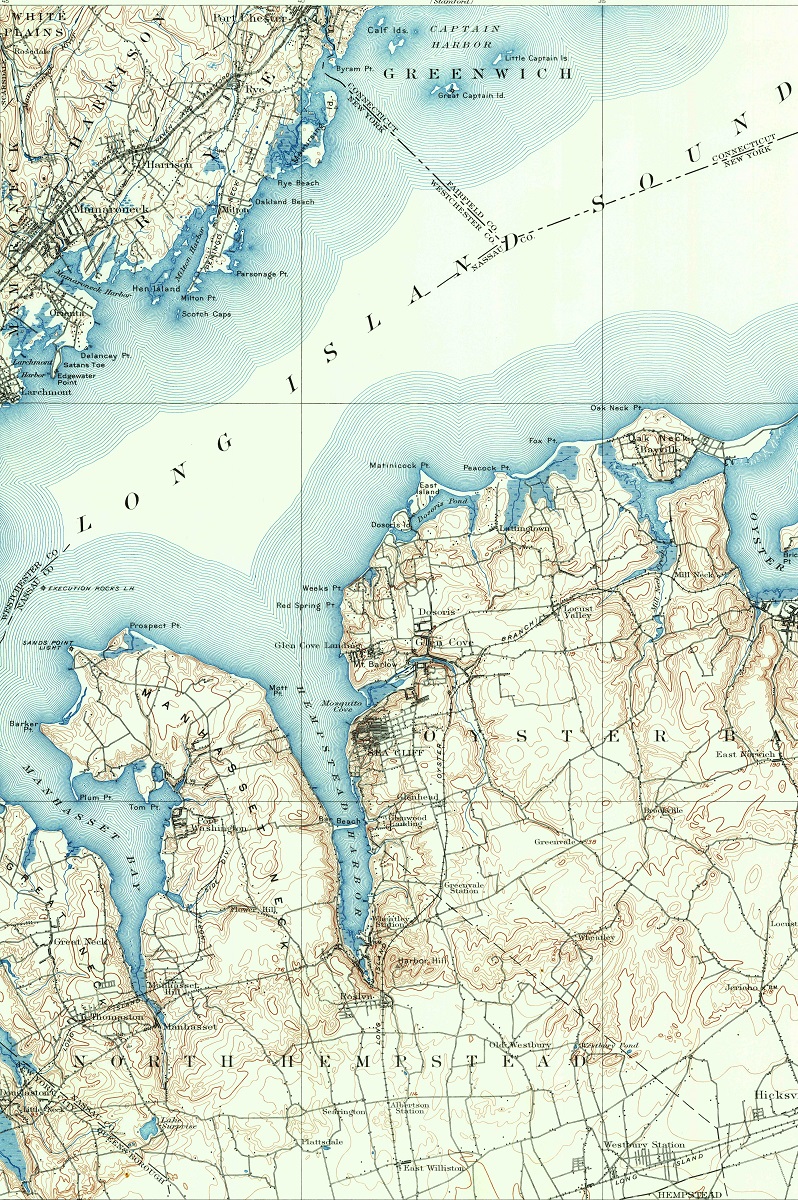
Recluse Treasure-Hicksville, New York 1897-USGS Topographic Map
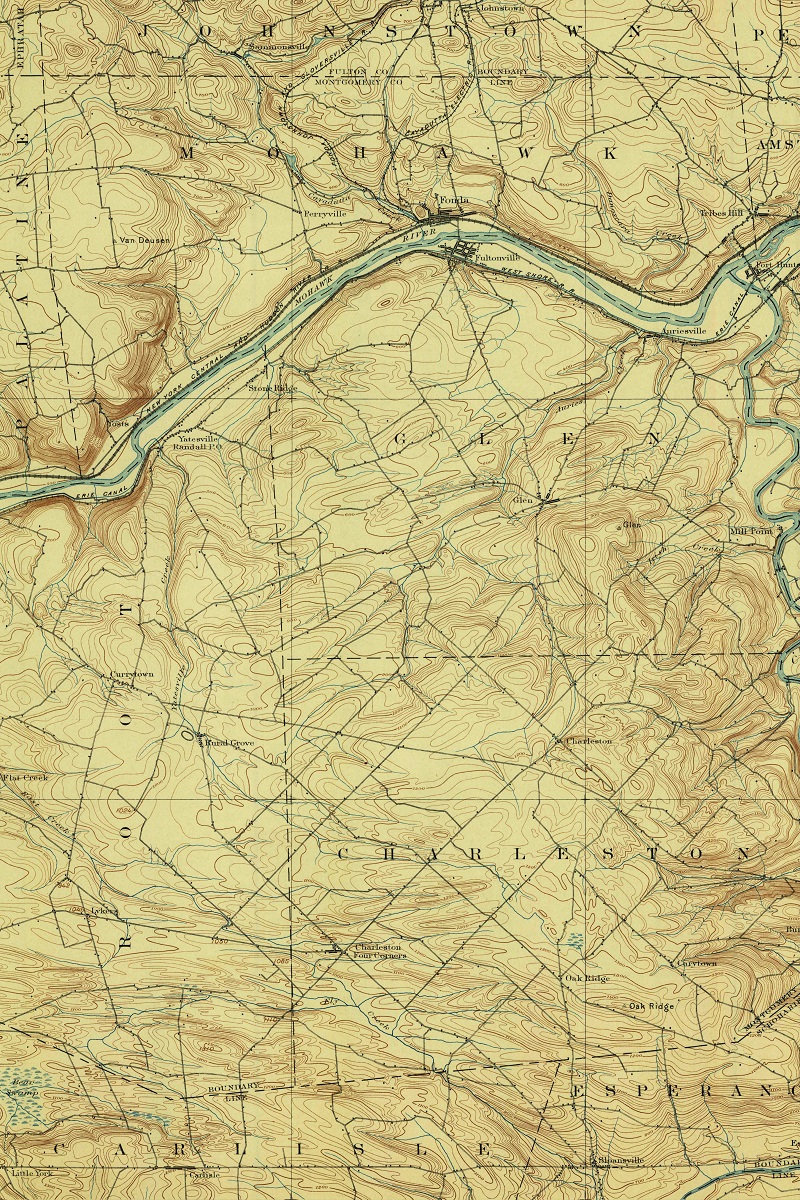
Butlerbury Mansion Treasure-Fonda, New York 1896-USGS Topographic Map
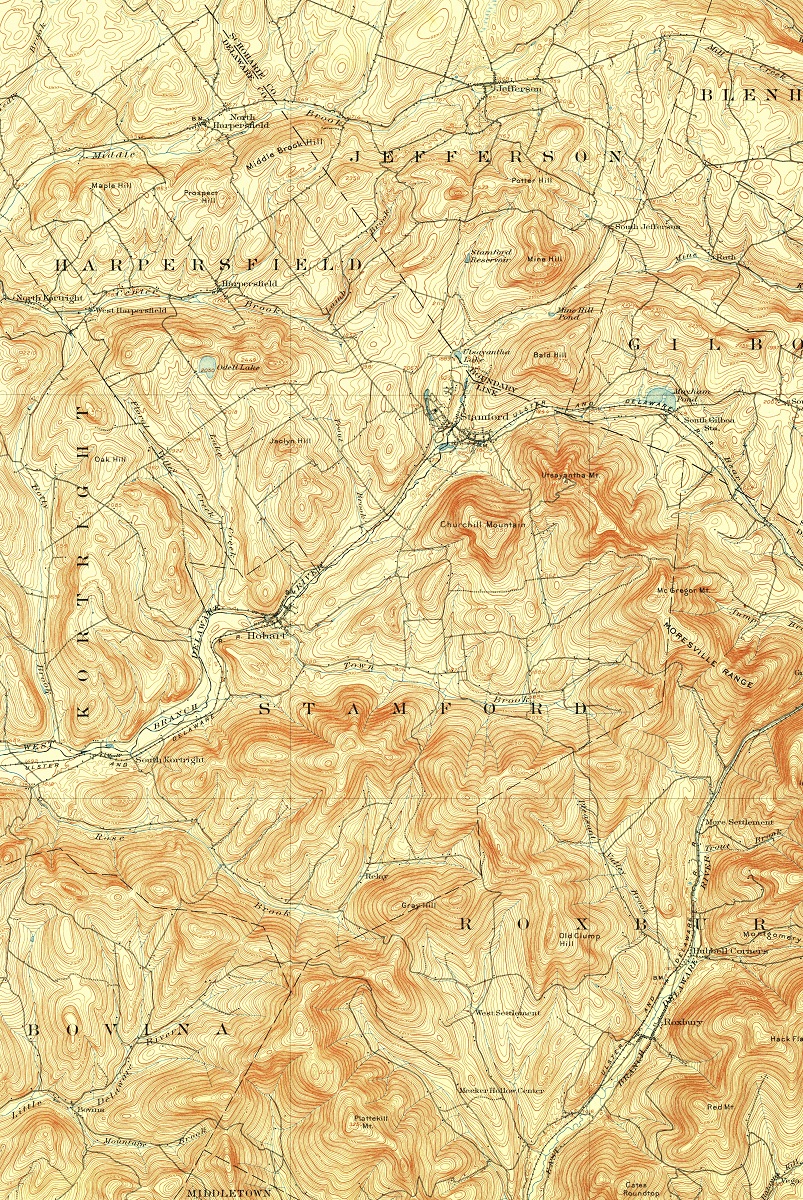
Dutch Schultzs Hidden Treasure-Catskill Mountains, New York 1904-USGS Topographic Map
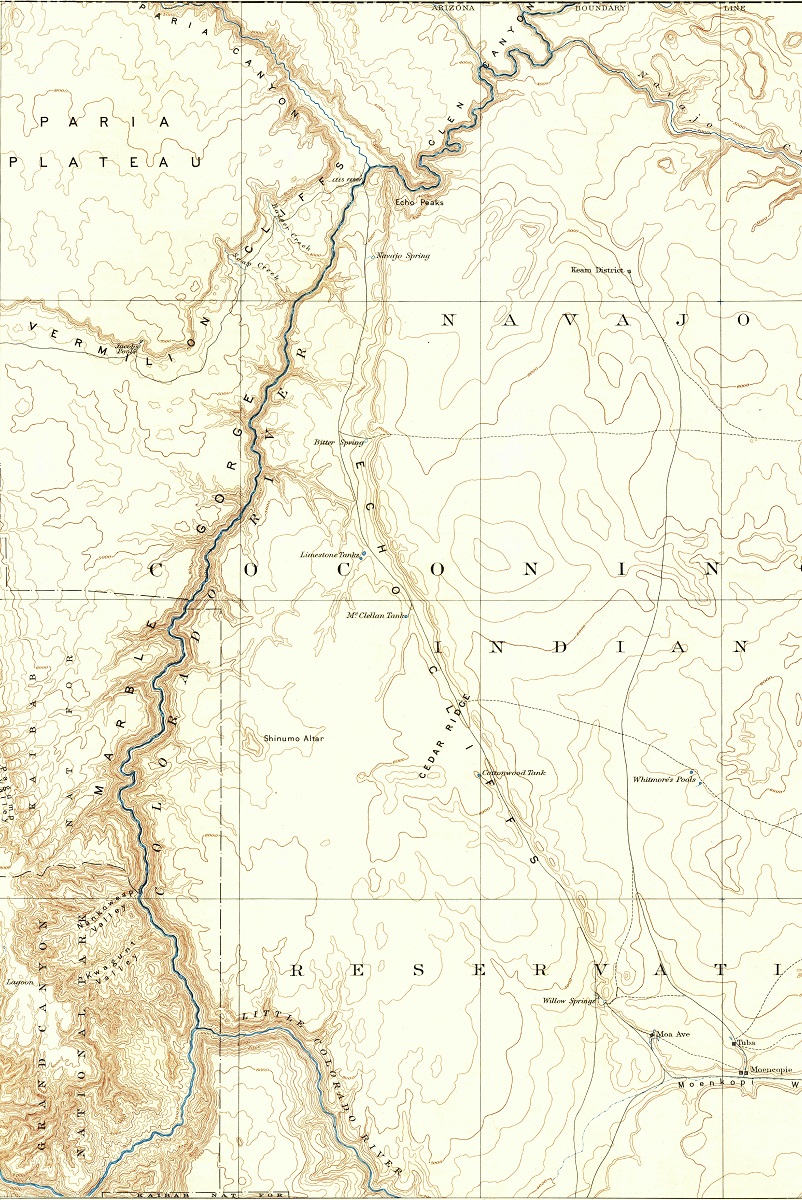
Egyption City Grand Canyon-Grand Canyon, Arizona 1891 USGS Topographic Map
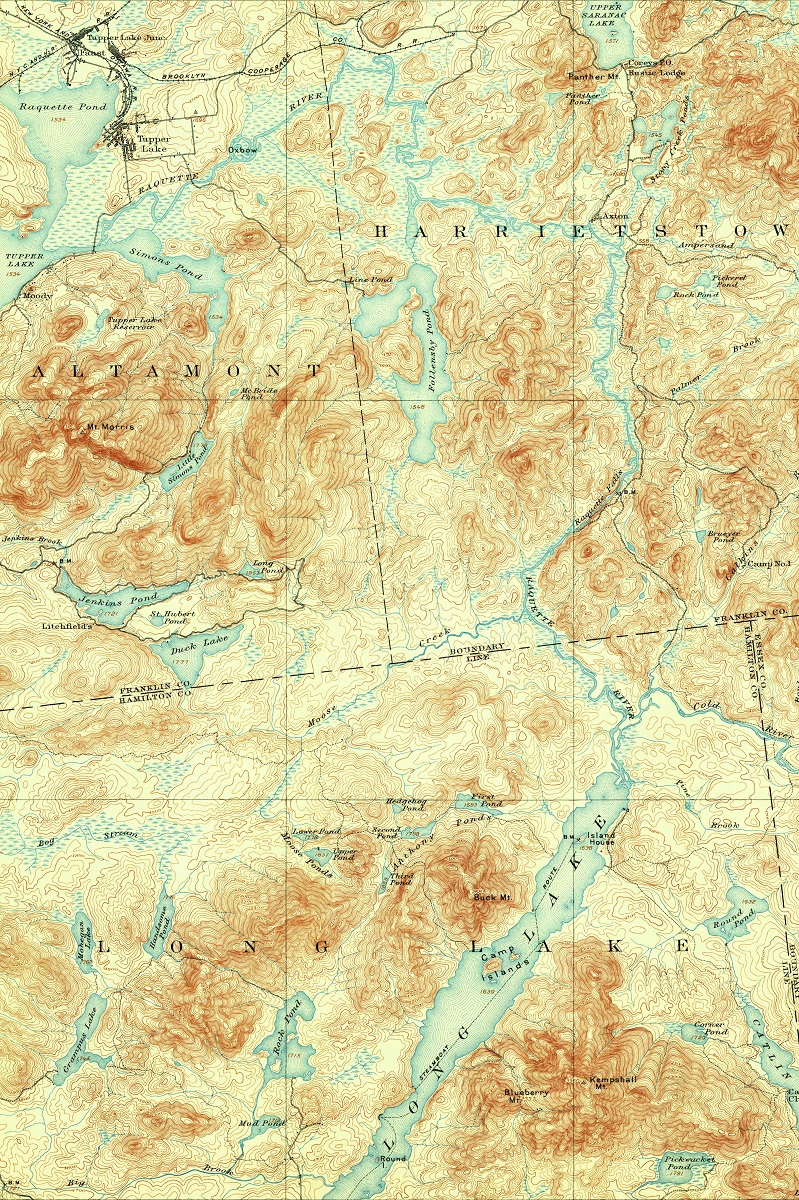
Moses Follensbys Treasure-Tupper Lake, New York 1904-USGS Topographic Map
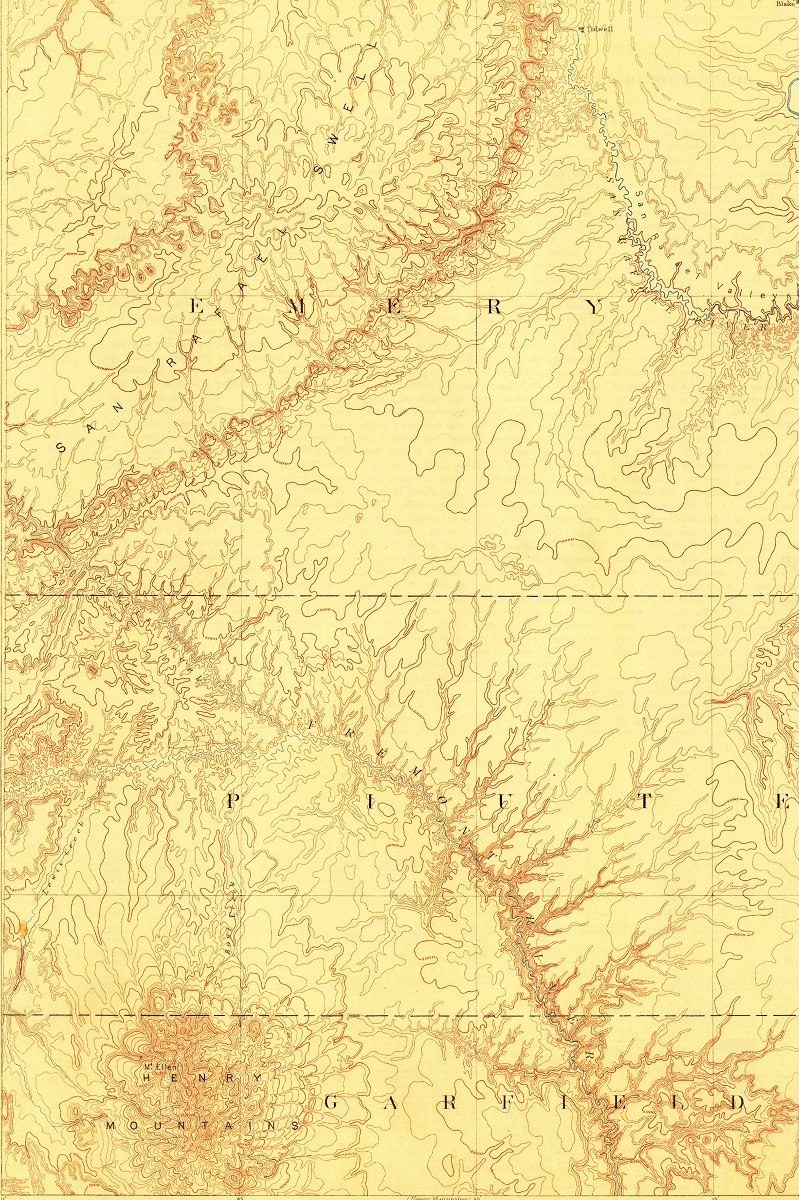
Butch Cassidy Castle Gate Robbery-Robbers Roost Canyon, Utah 1885-USGS Topographic Map
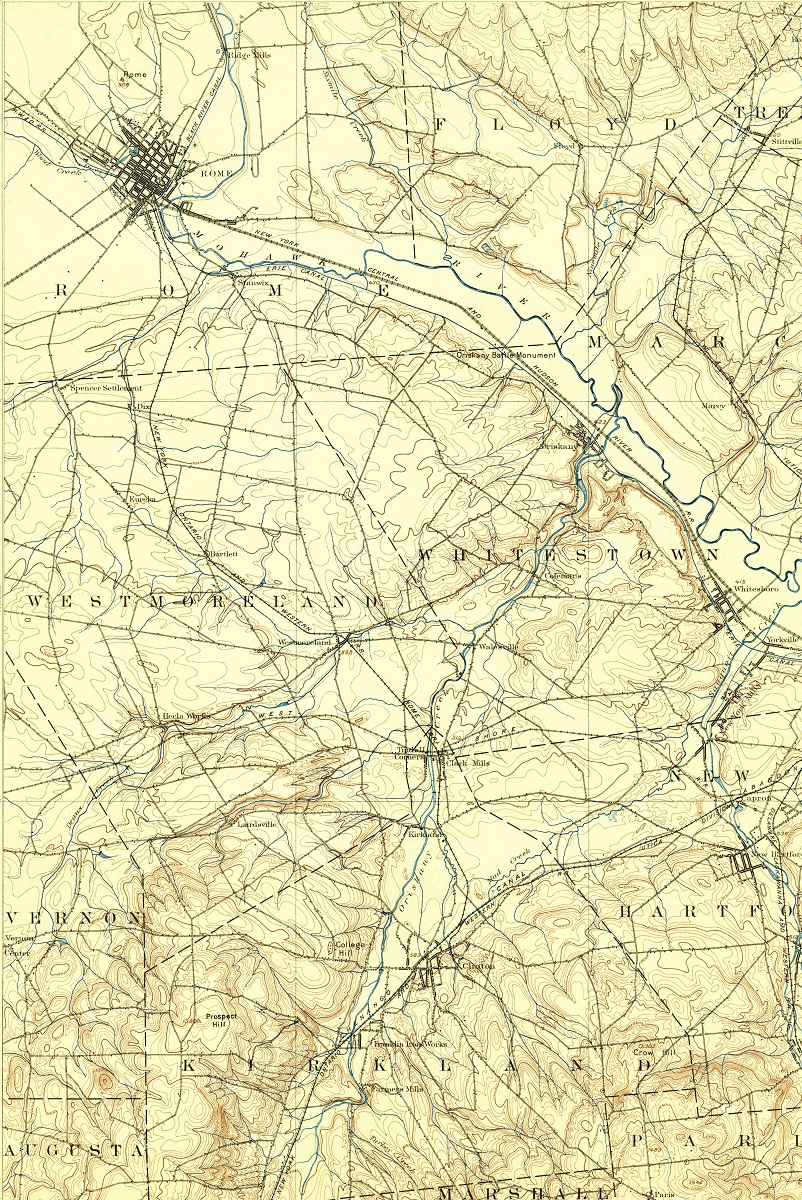
Revolutionary War Treasure-Rome, New York 1895-USGS Topographic Map
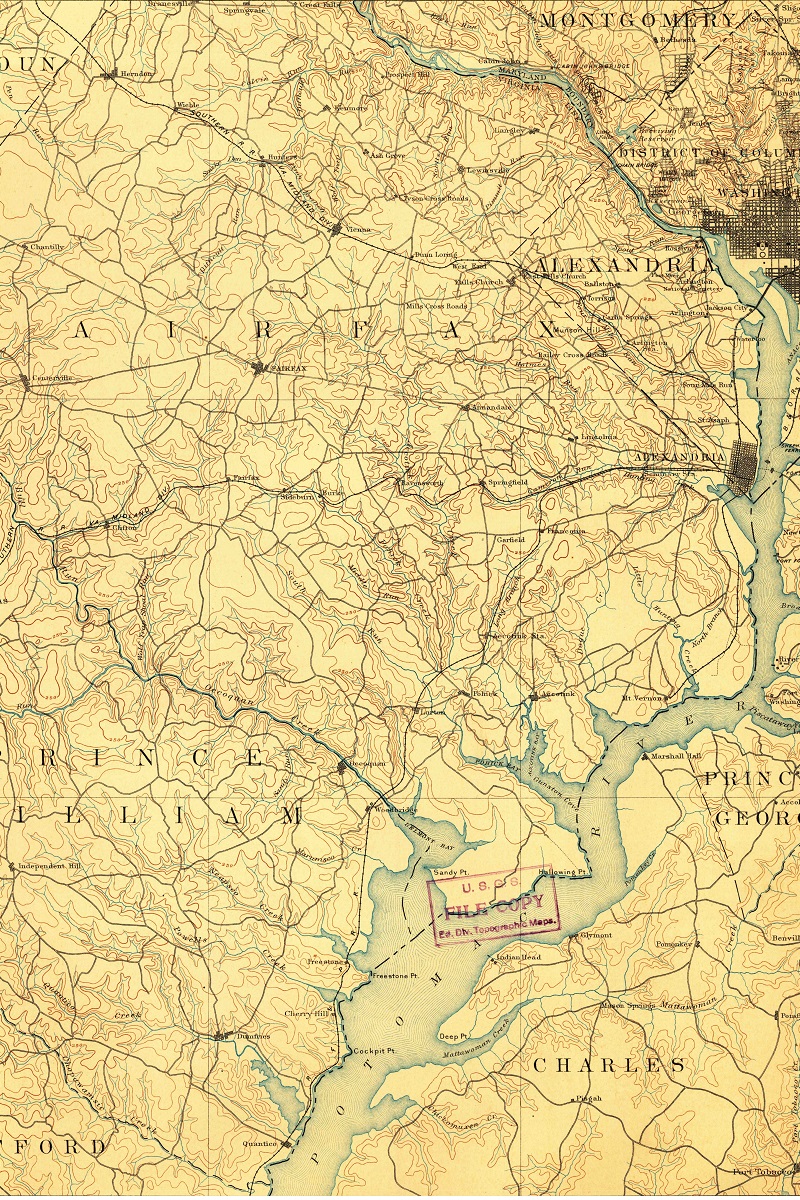
Mosbys Treasure-Fairfax County, Virginia 1894 USGS Topographic Map
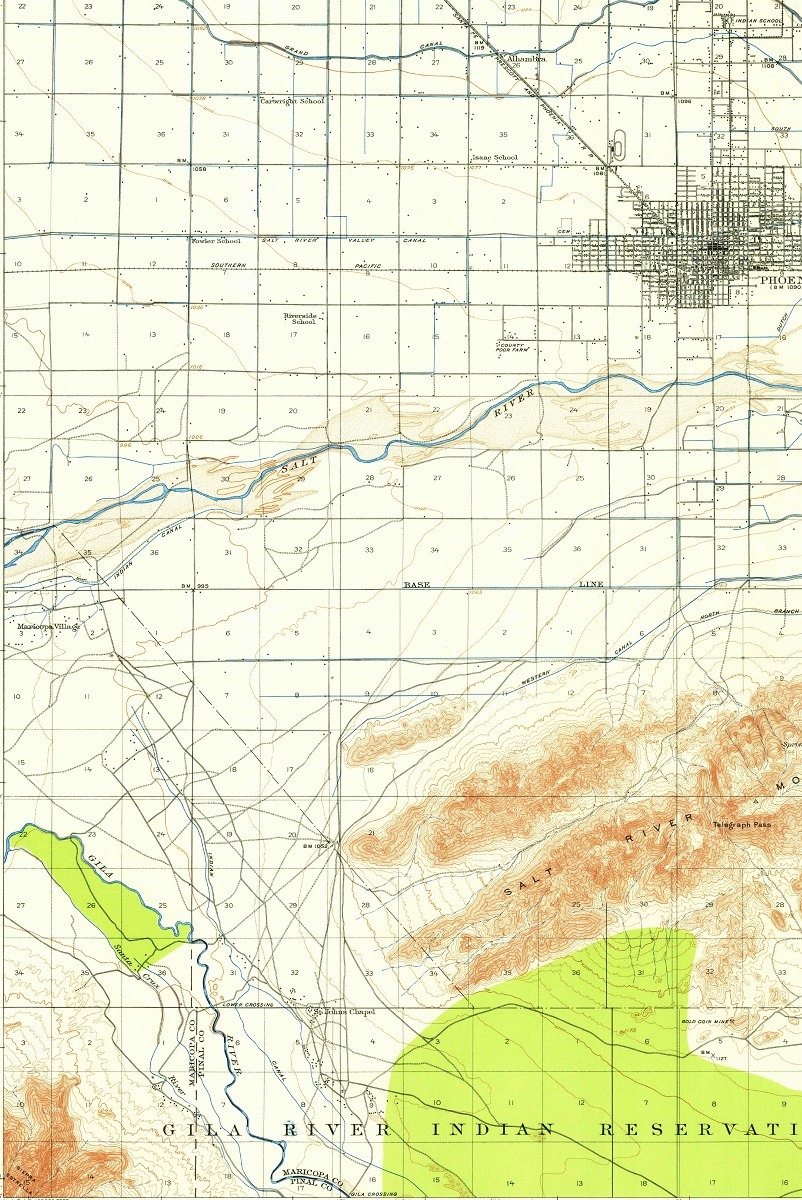
Sierra Estrella Buried Gold-Estrella Mountains, Arizona 1912-USGS Topographic Map
Lost Josephine Mine-High Uintahs, Utah 1885-USGS Topographic Map
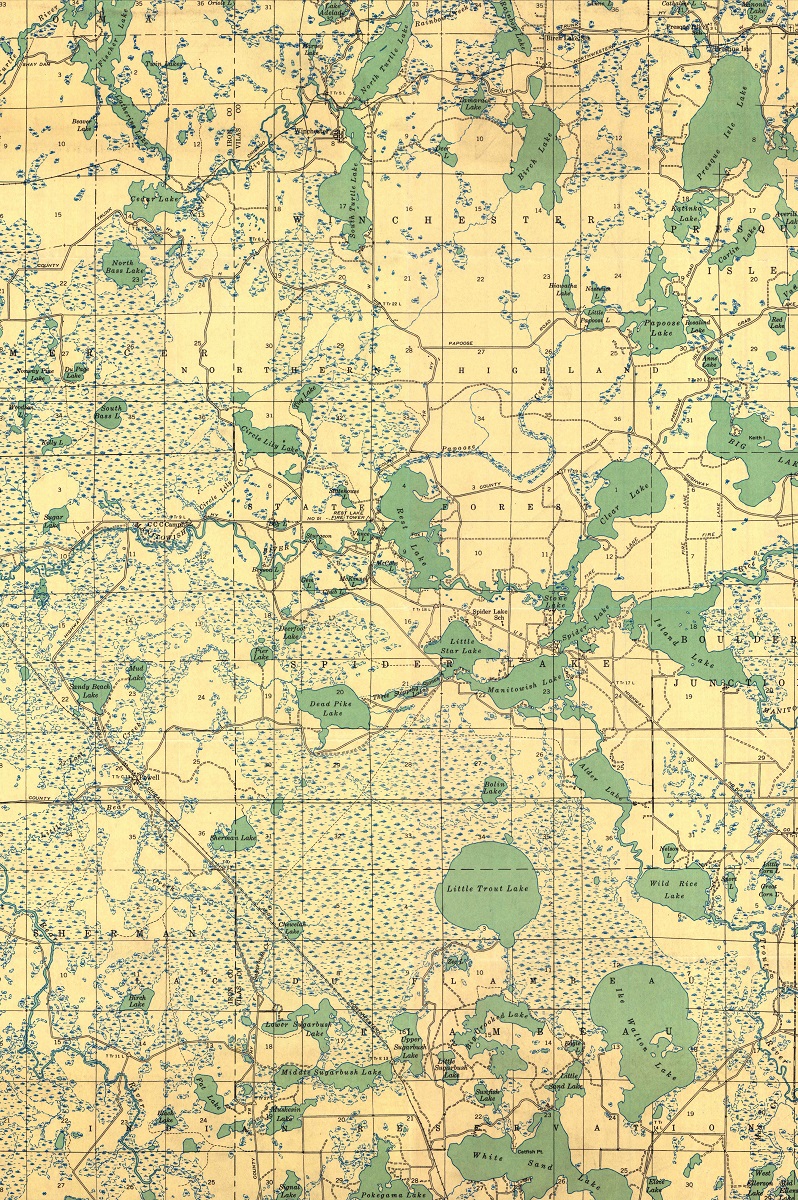
John Dillingers Small Bills-Manitowish, Wisconsin 1939 USGS Topographic Map
Gallery of eCommerce 3D USGS Historical Topographic Maps and 2D Canvas Prints
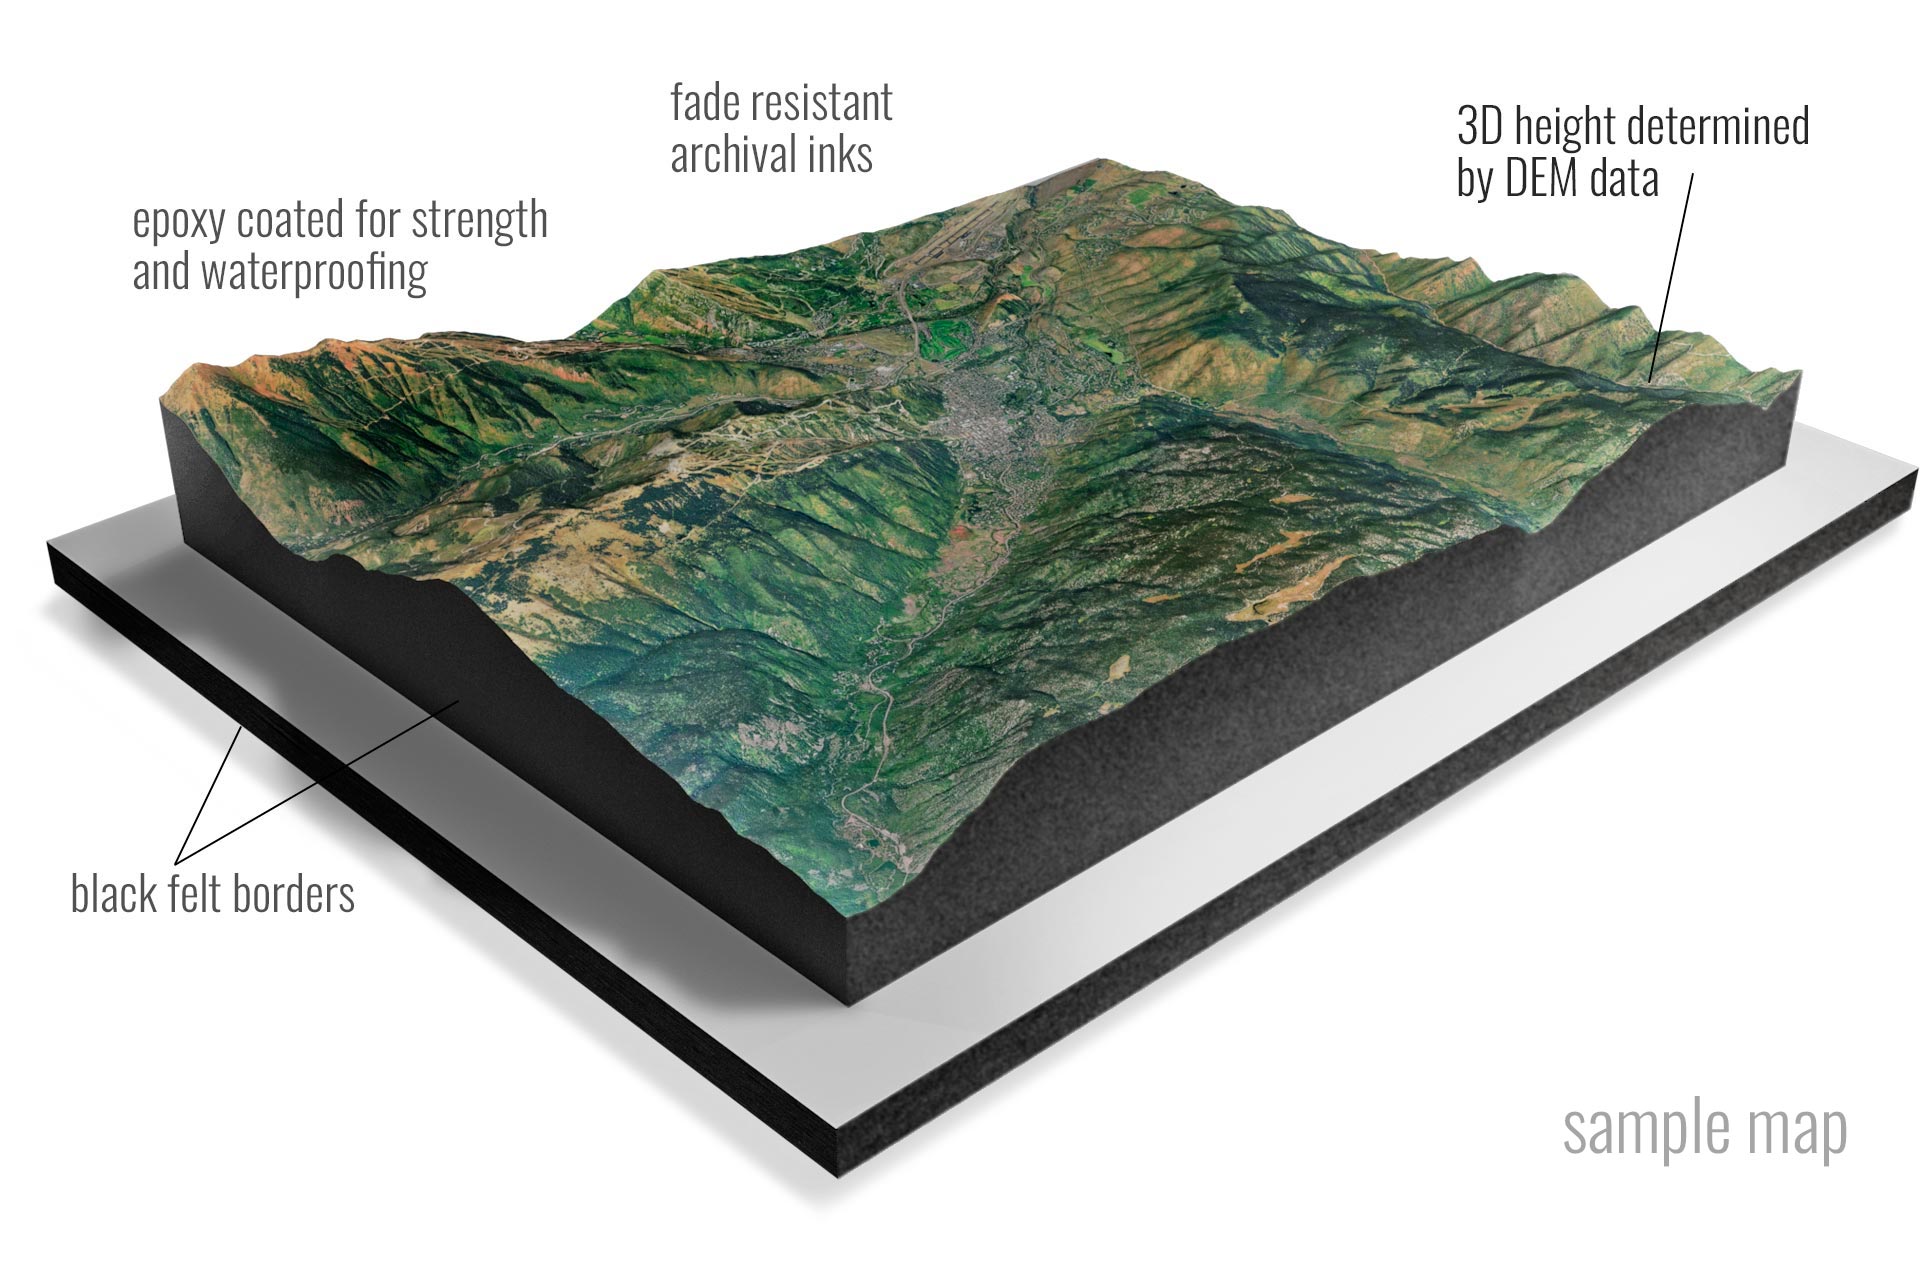
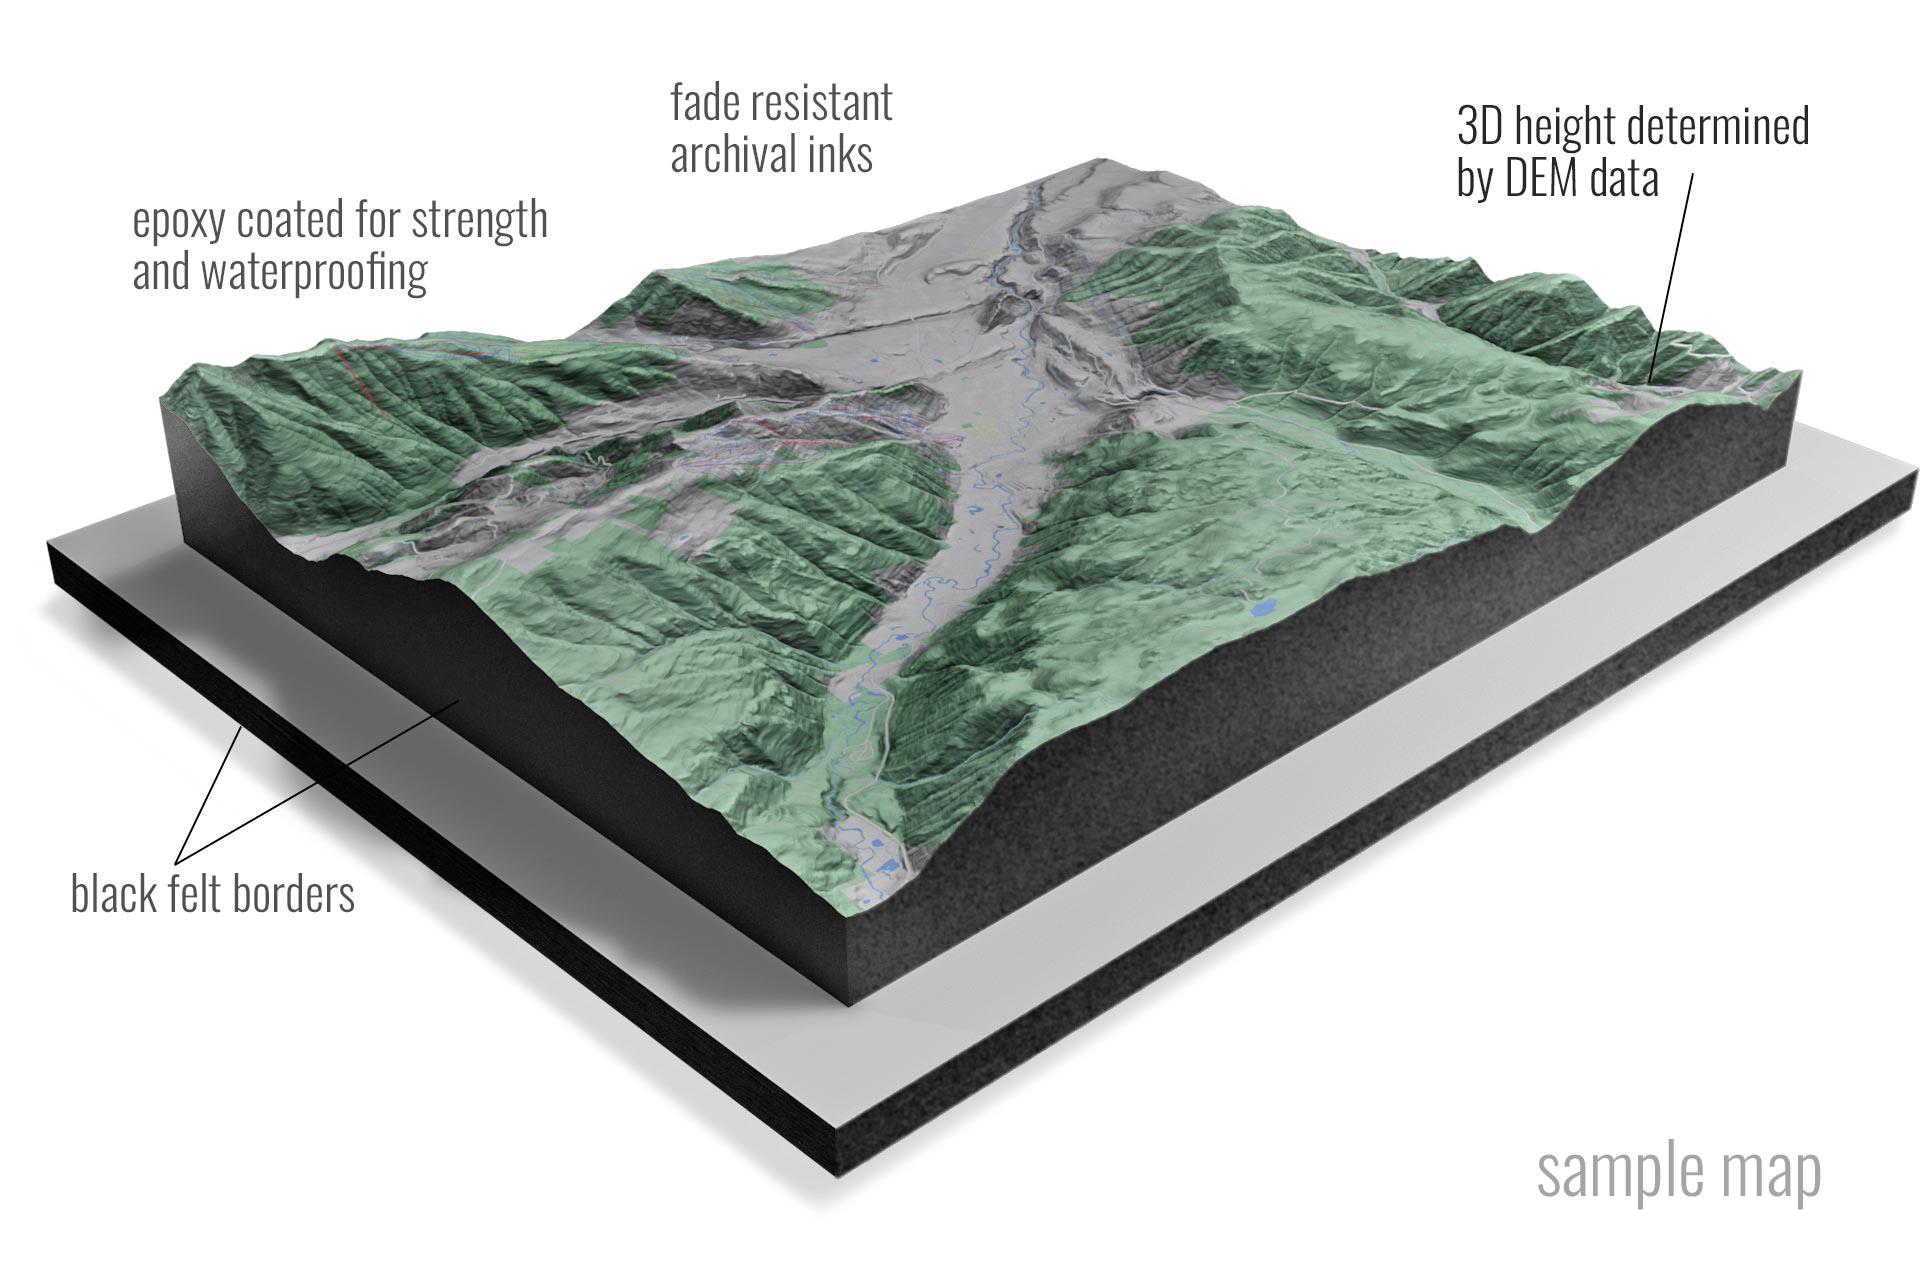
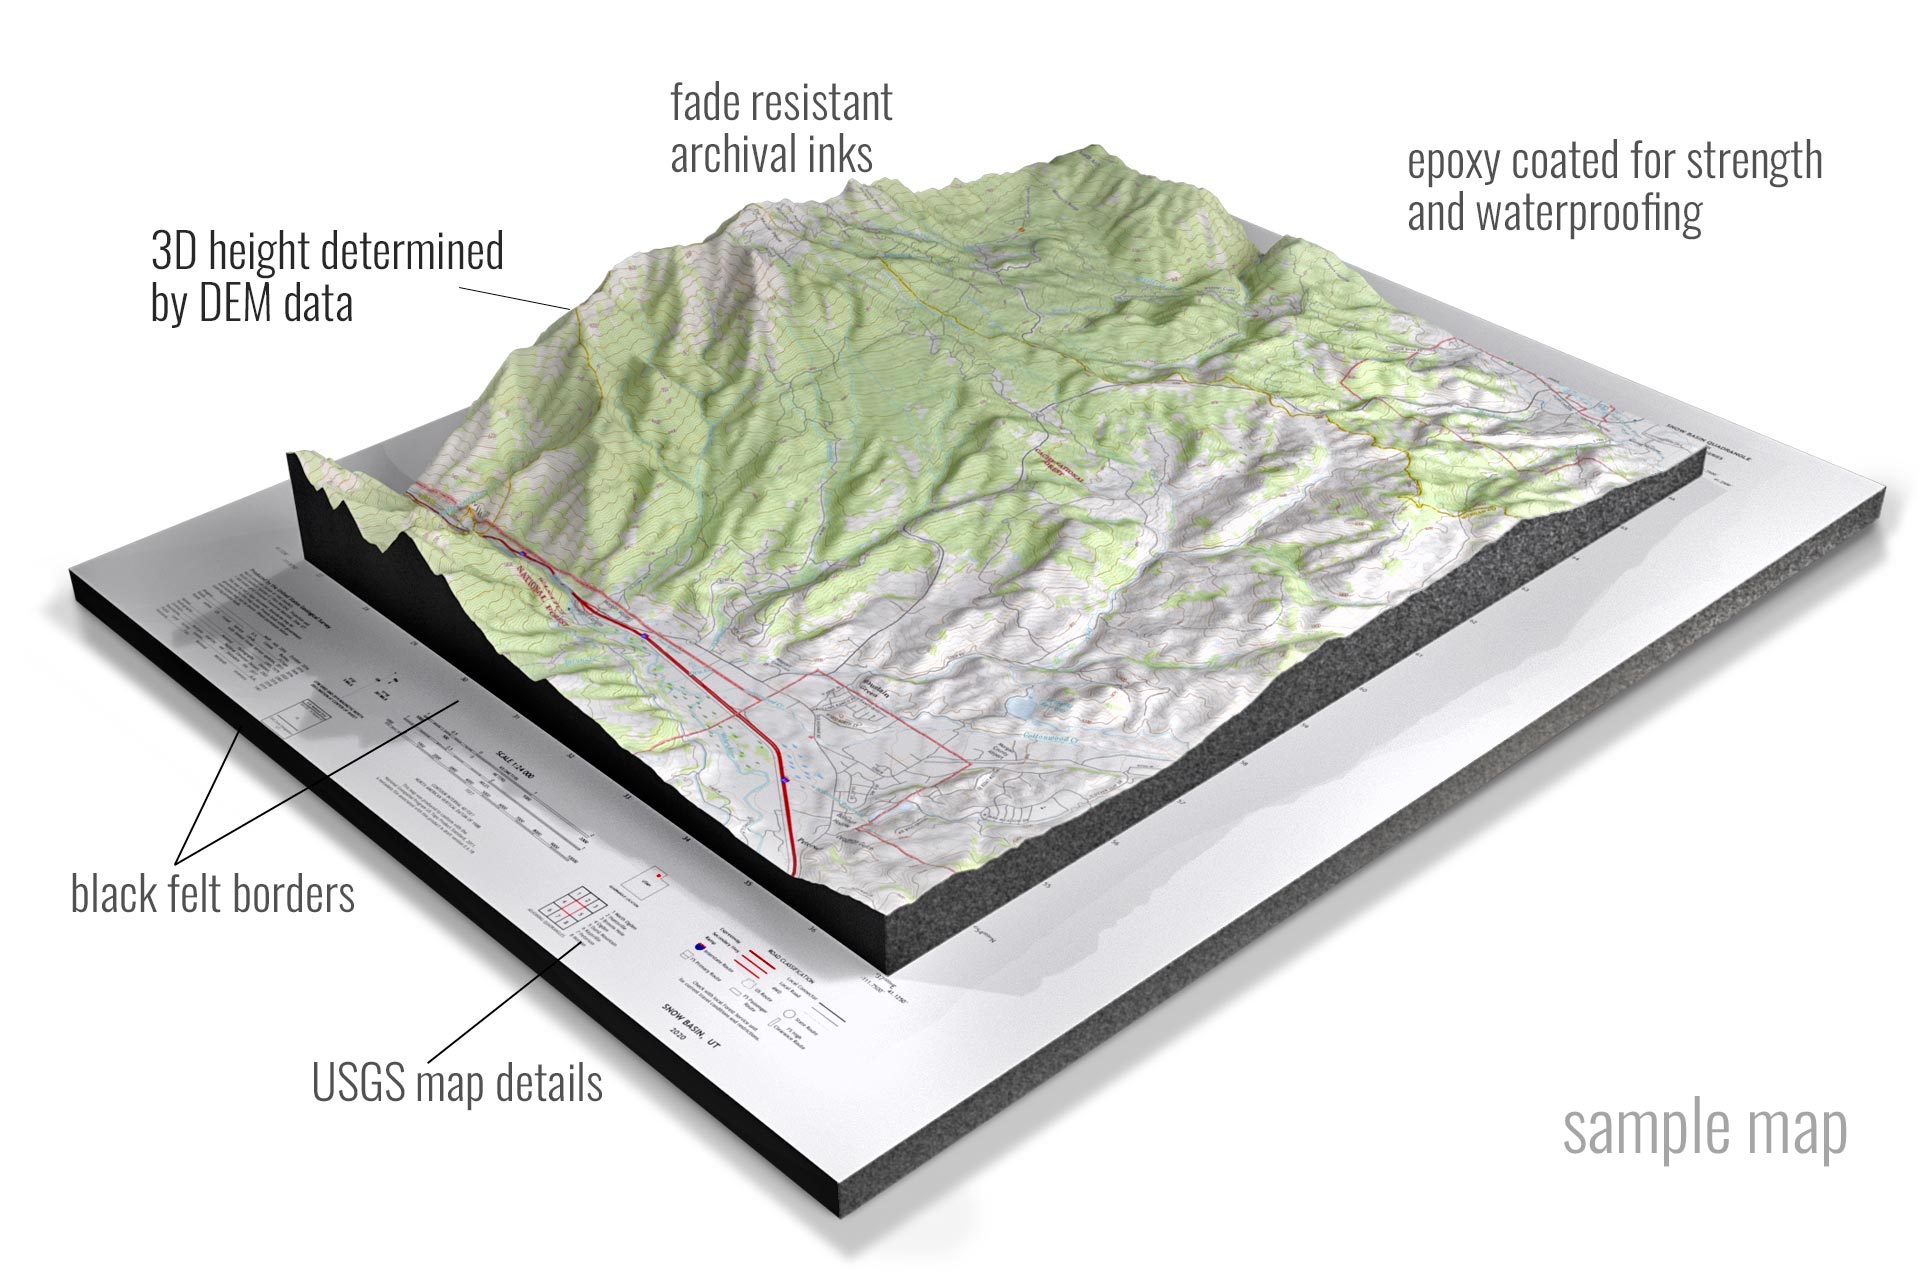
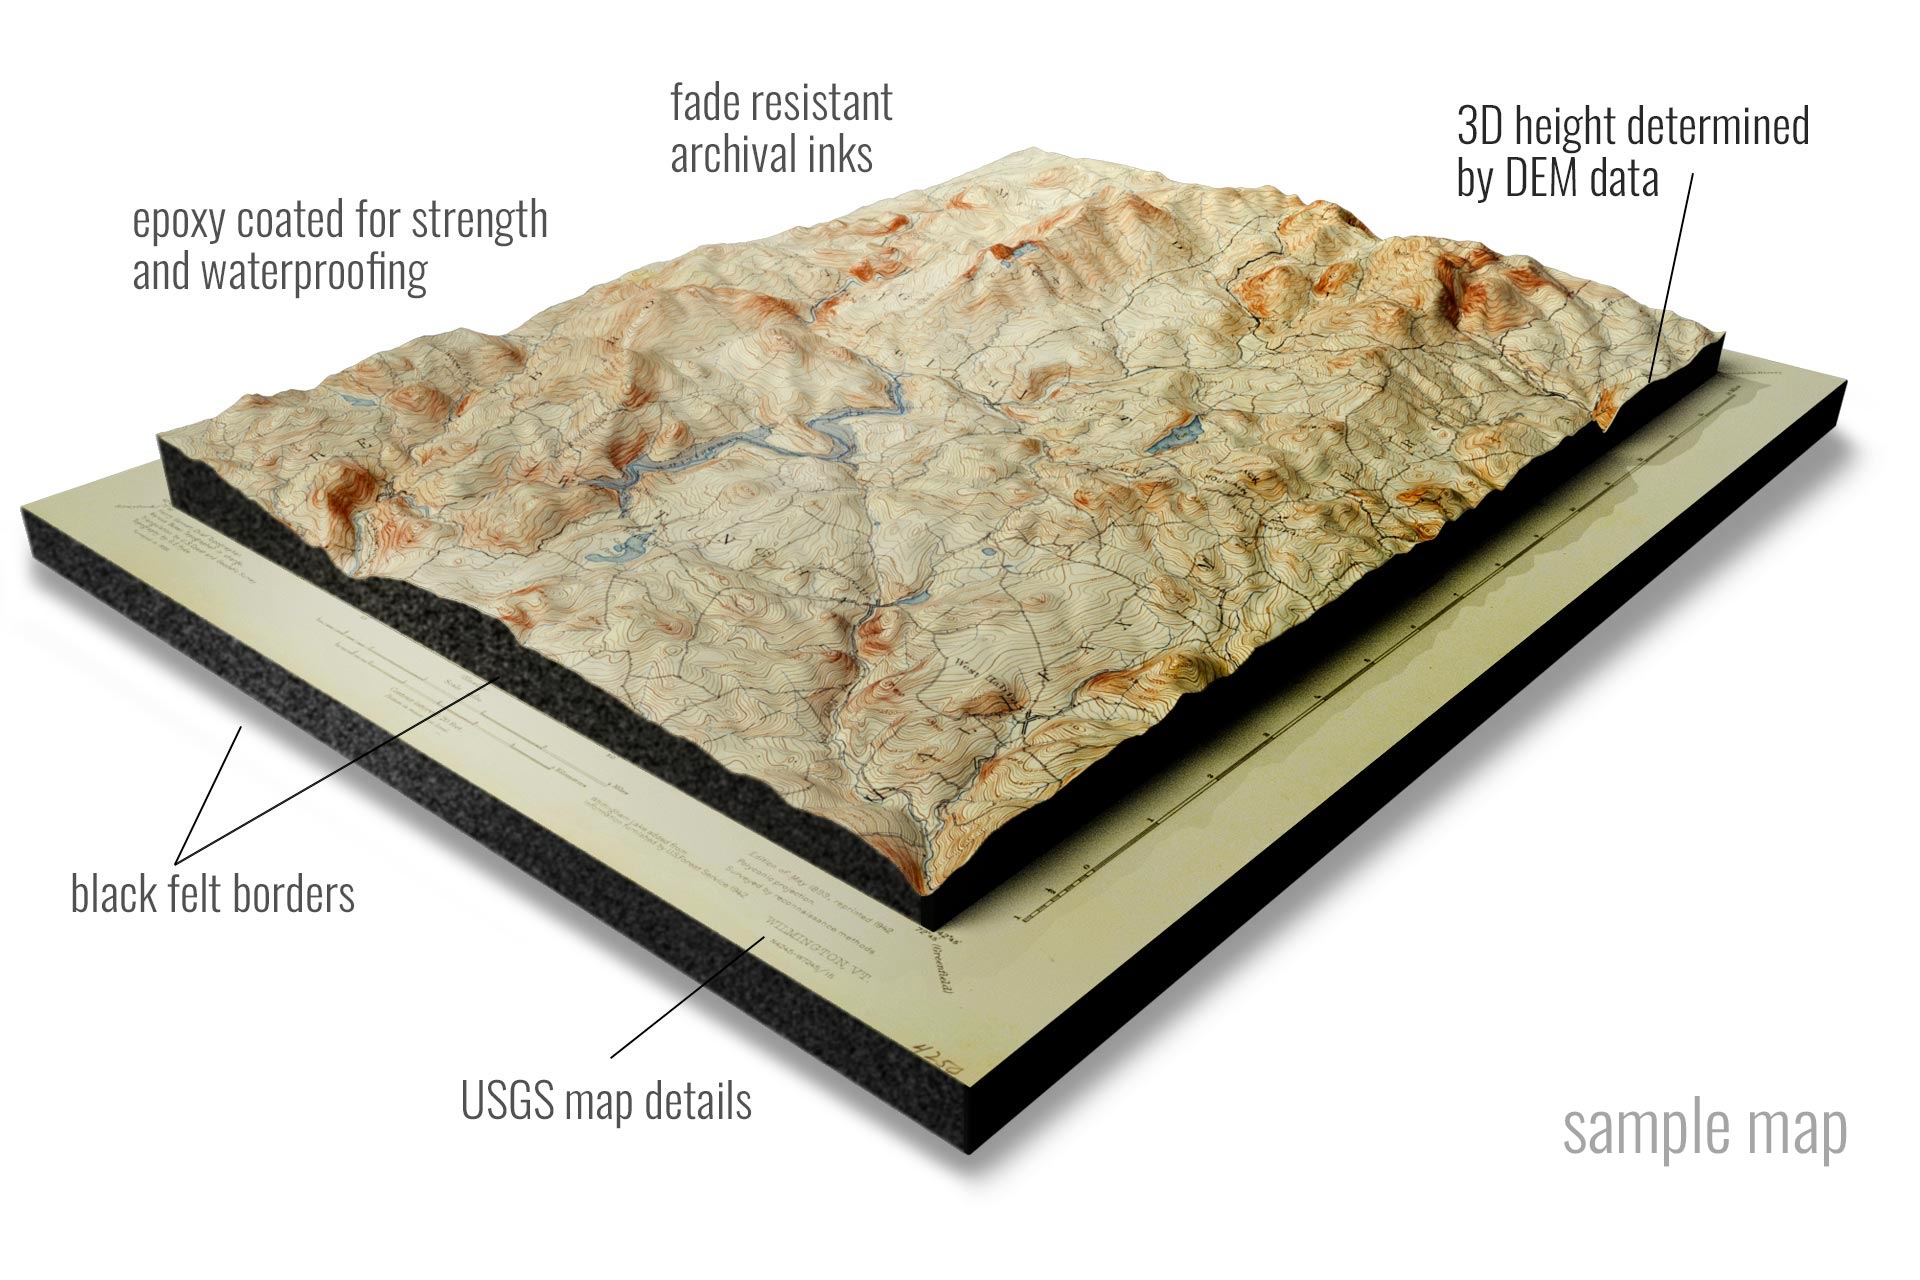
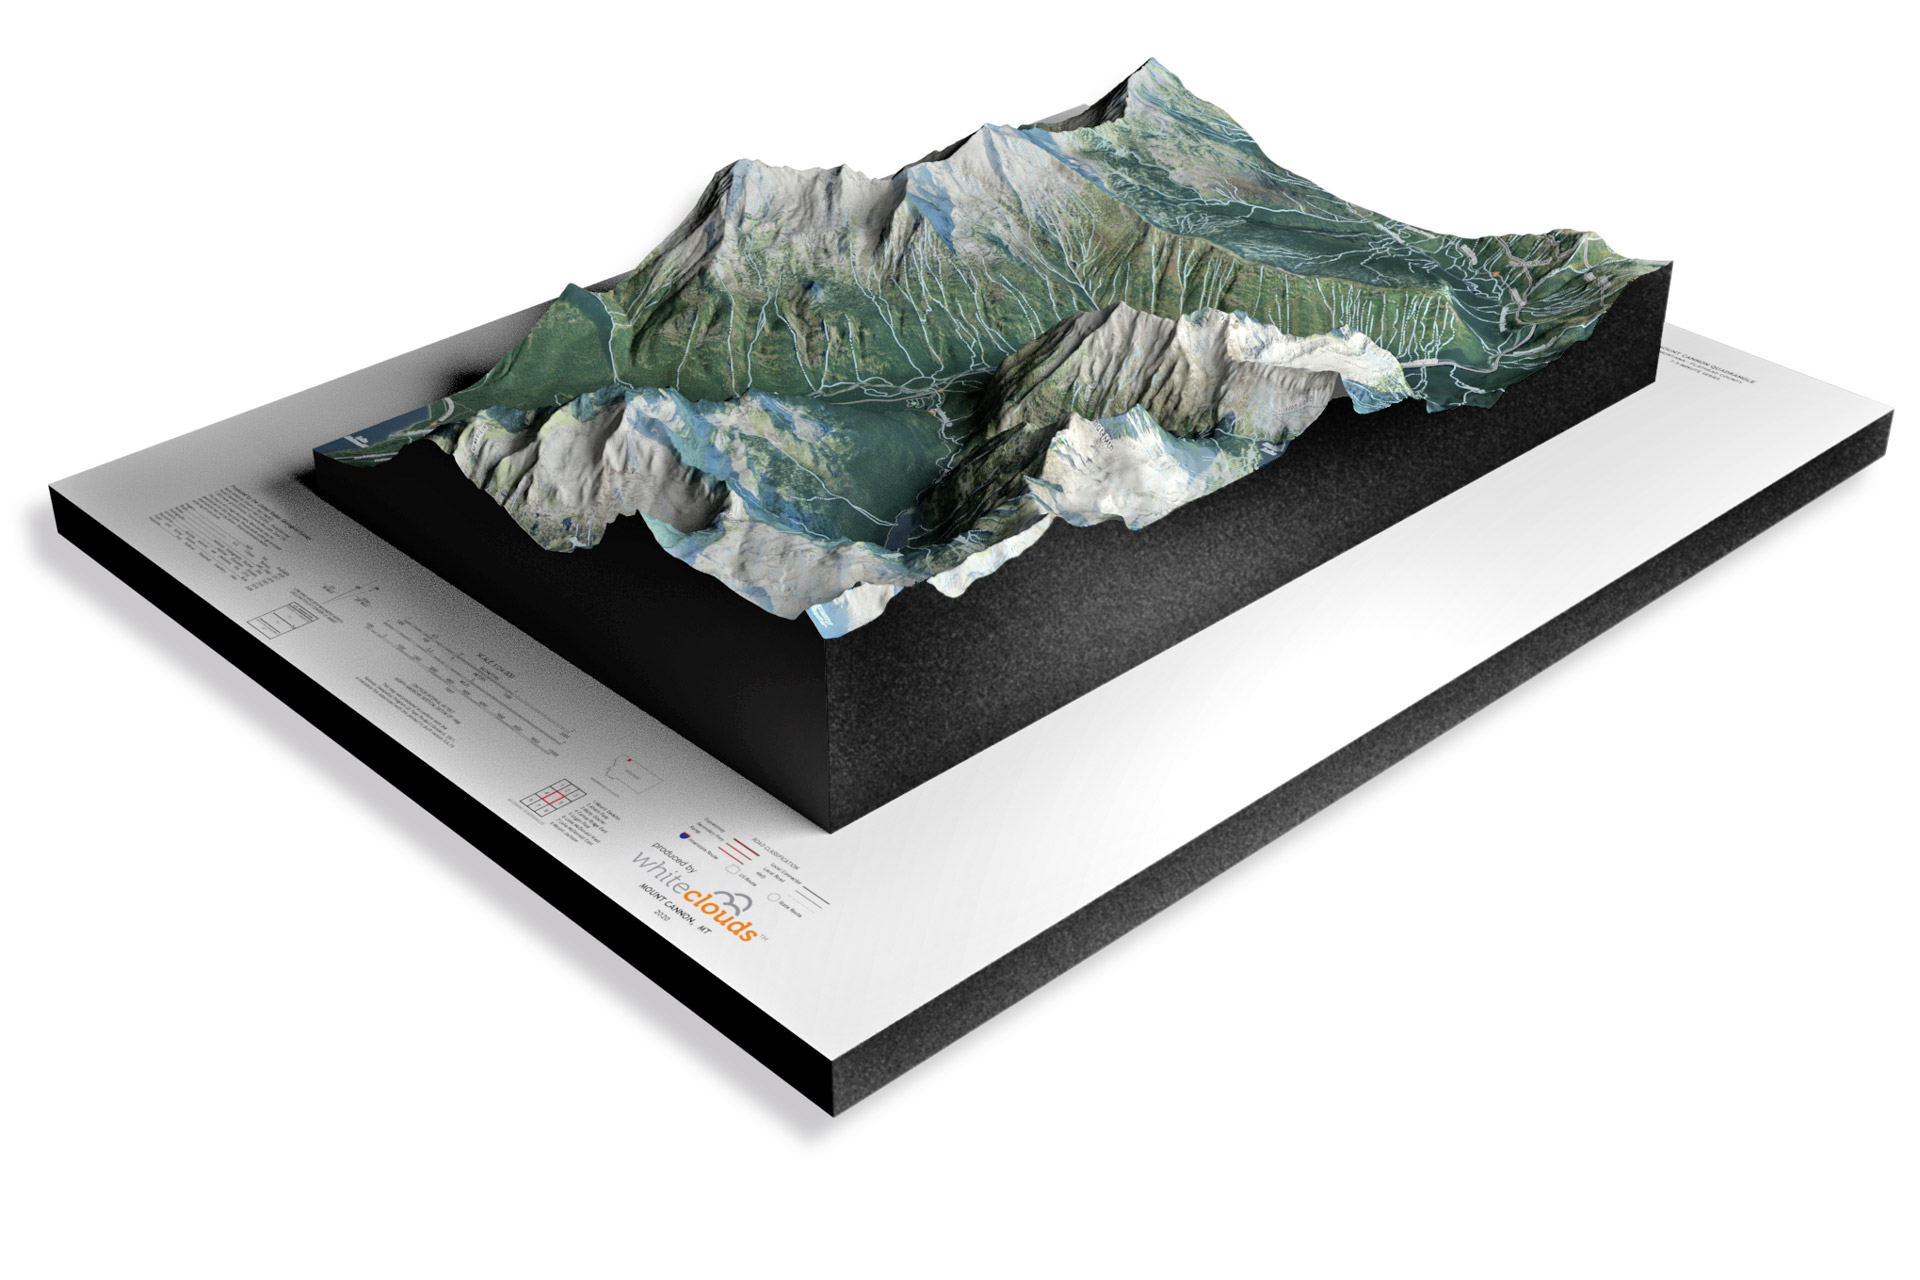
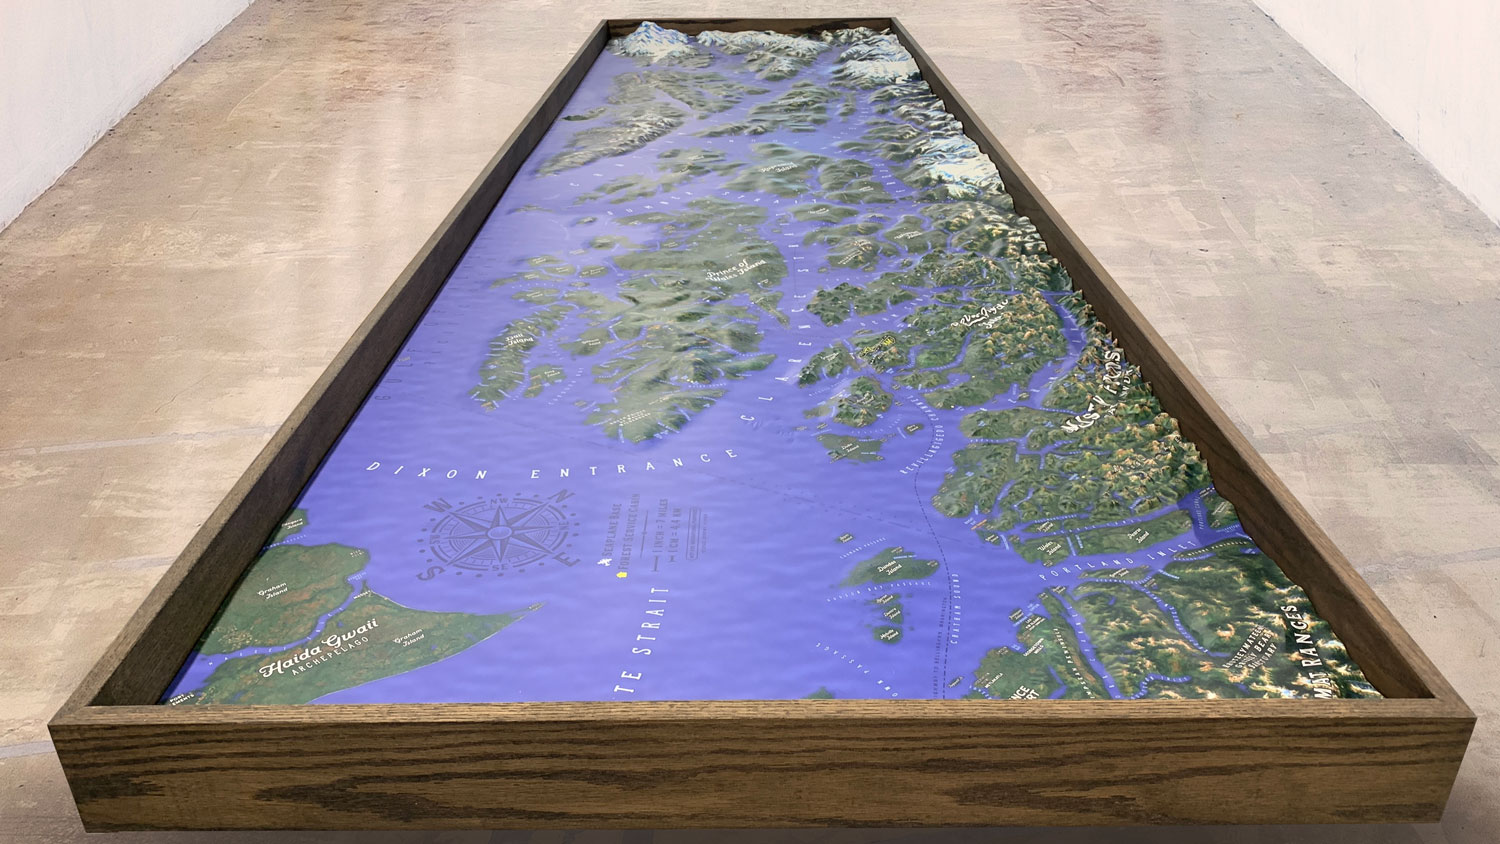
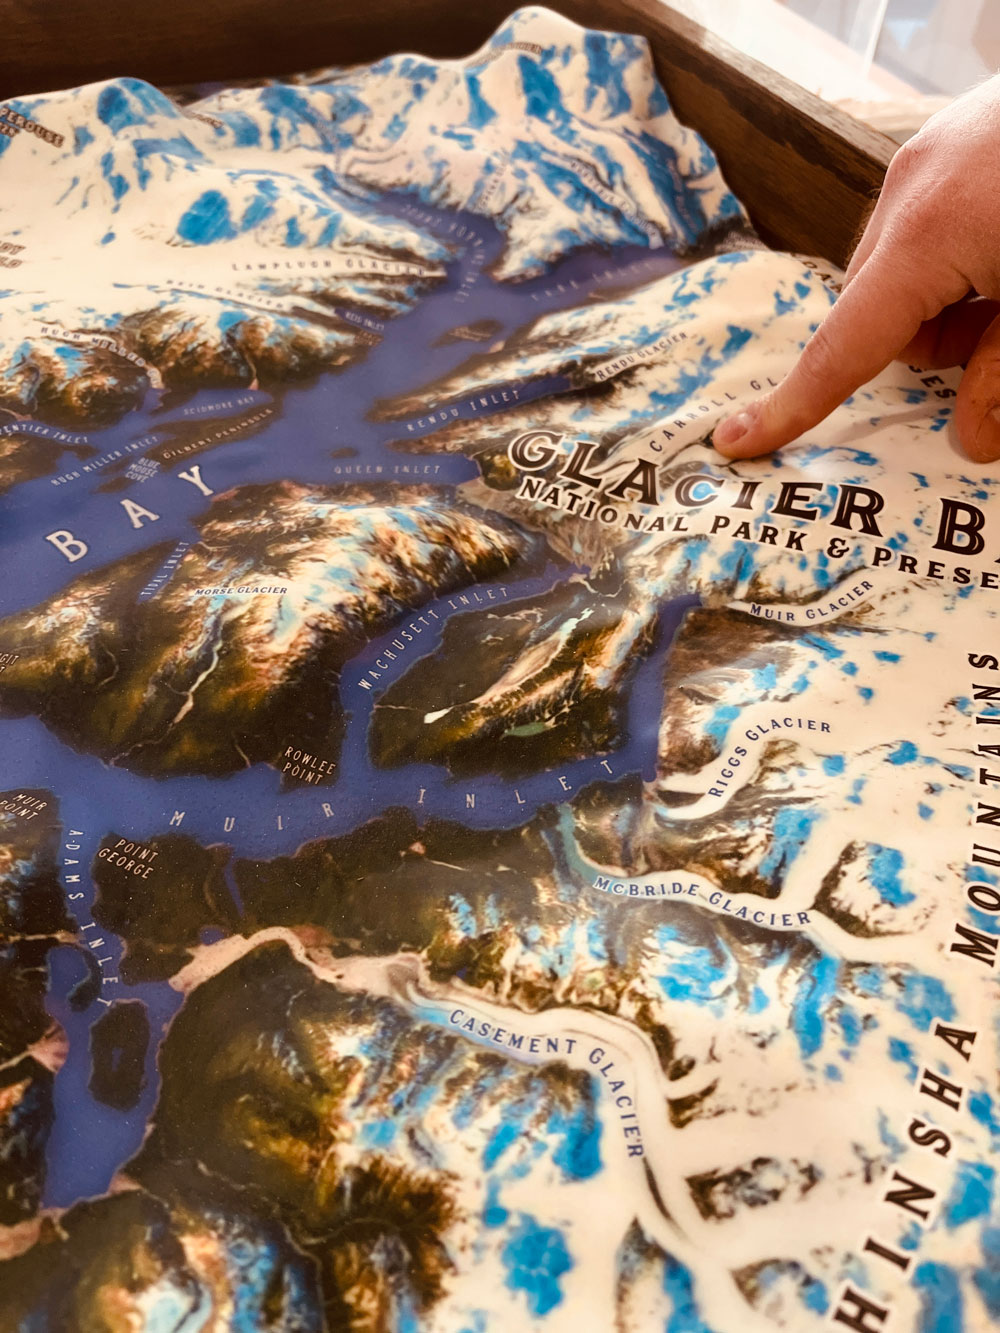
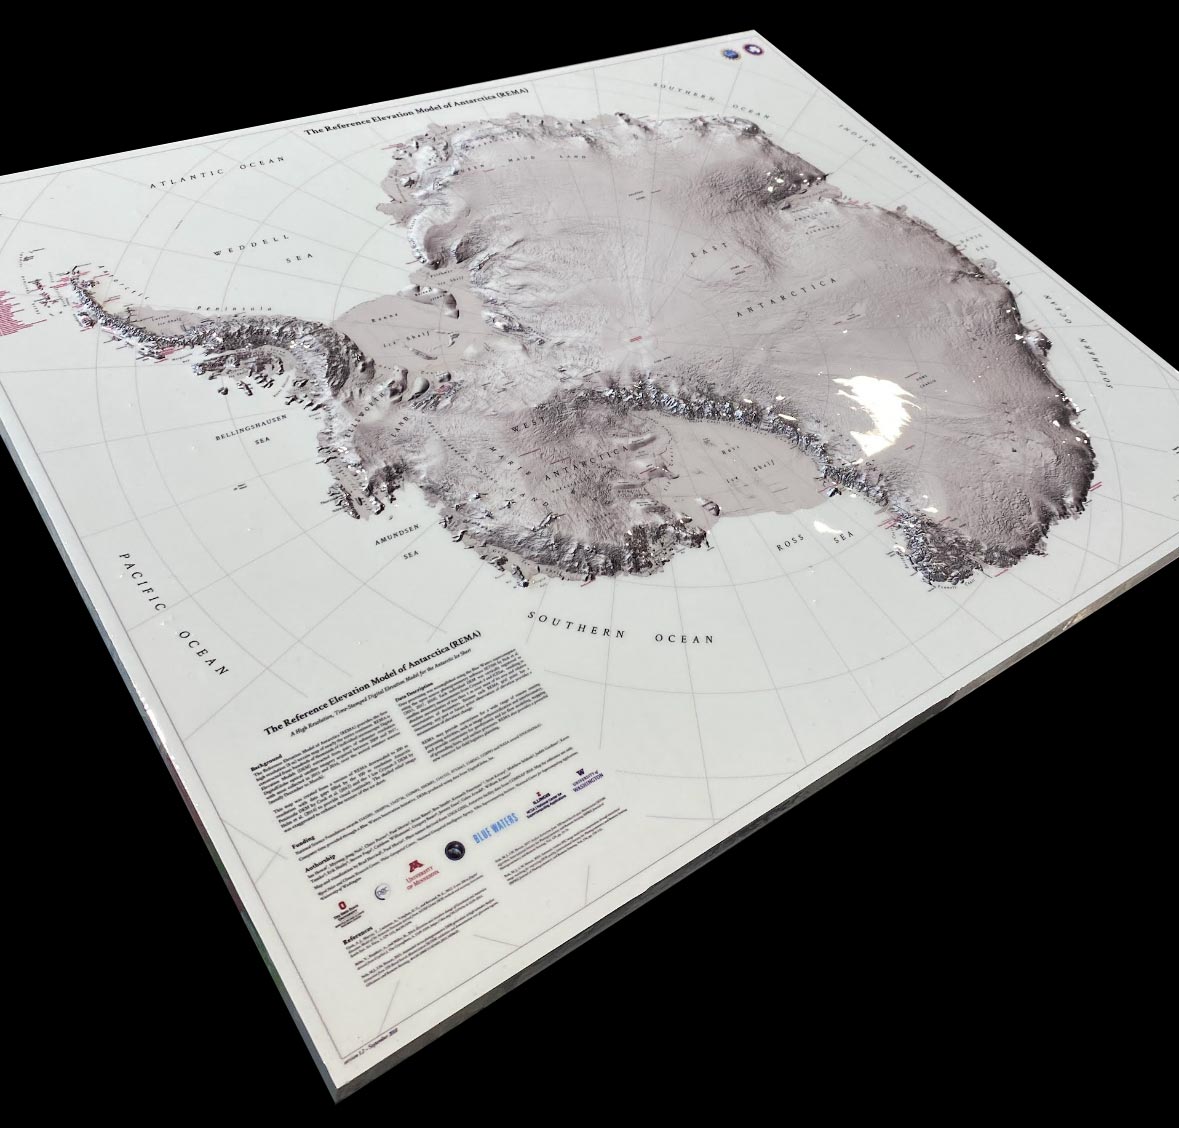
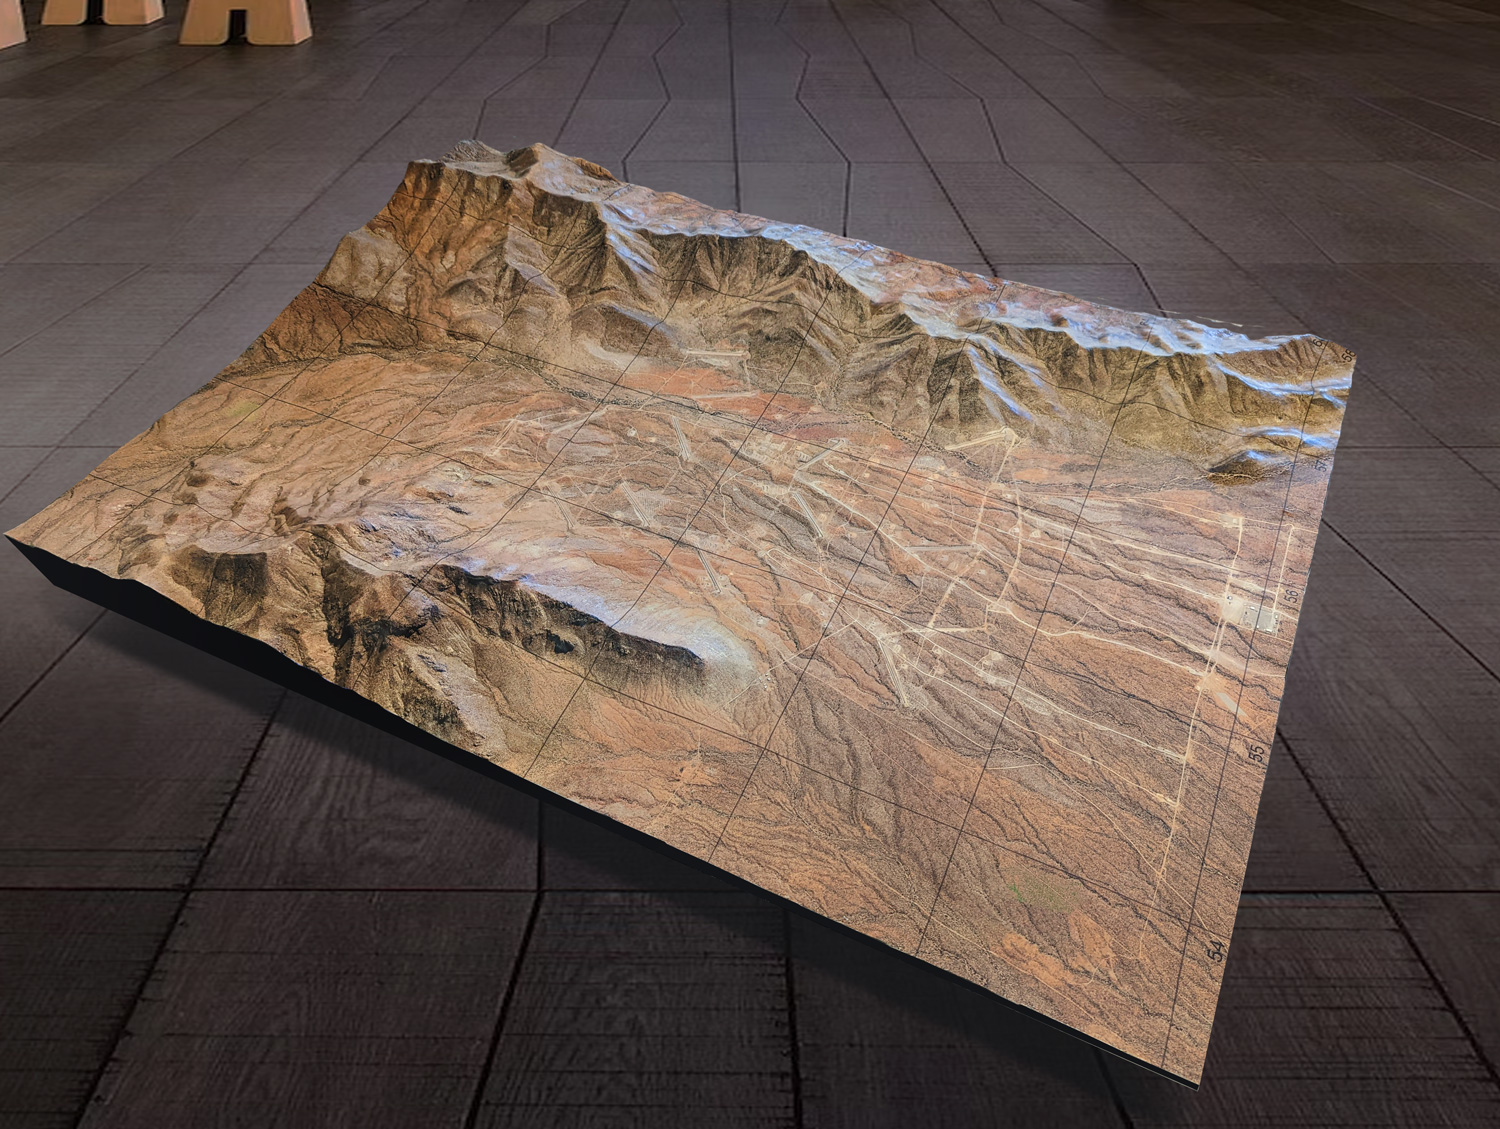
Shop WhiteClouds 3D USGS Topographical Maps with 65,240 three-dimensional maps to choose from. There are also 361,902 3D USGS Historical Topographical Maps to choose from. These maps are not flat. They are three-dimensional, with the height being determined by Digital Elevation Model (DEM) data. These 3D maps are built by combining satellite imagery data from the USGS and DEM data. Make a statement with these beautiful 3D map images from every part of the United States.
Shop WhiteClouds 2D USGS Topographical Canvas Print Maps with 427,142 maps to choose from. These canvas print maps have both current and historical USGS topographic maps (from 1882 to present). There are also satellite and terrain canvas print maps that use the USGS coordinates.
Gallery of Custom 3D Map Projects
How USGS 3D Historical Topographic Maps are Made
There are several techniques used to create USGS historical topographic maps, and the process can vary depending on the scale and complexity of the map. However, the basic steps involved in making a topographic map are as follows:
- Create a base map. The first step in making a USGS historical topographic map is to create a base map of the area. This is typically done by selecting the desired USGS map. There are over 400,000+ USGS maps, current and historical, to choose from. These span in time from 1885 to the present. You can access USGS topographic maps in the USGS Topo Viewer, or USGS Topo Builder (for custom USGS maps), or WhiteClouds can do it for you.
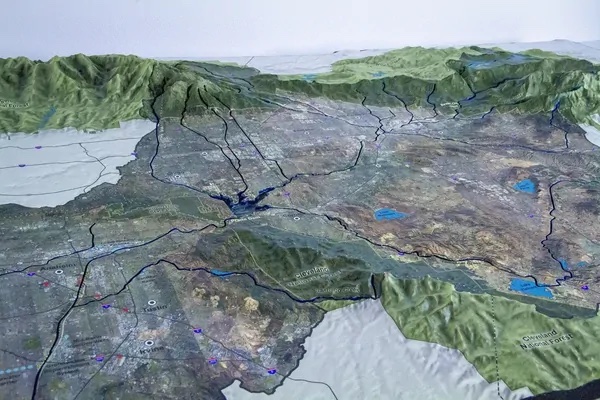
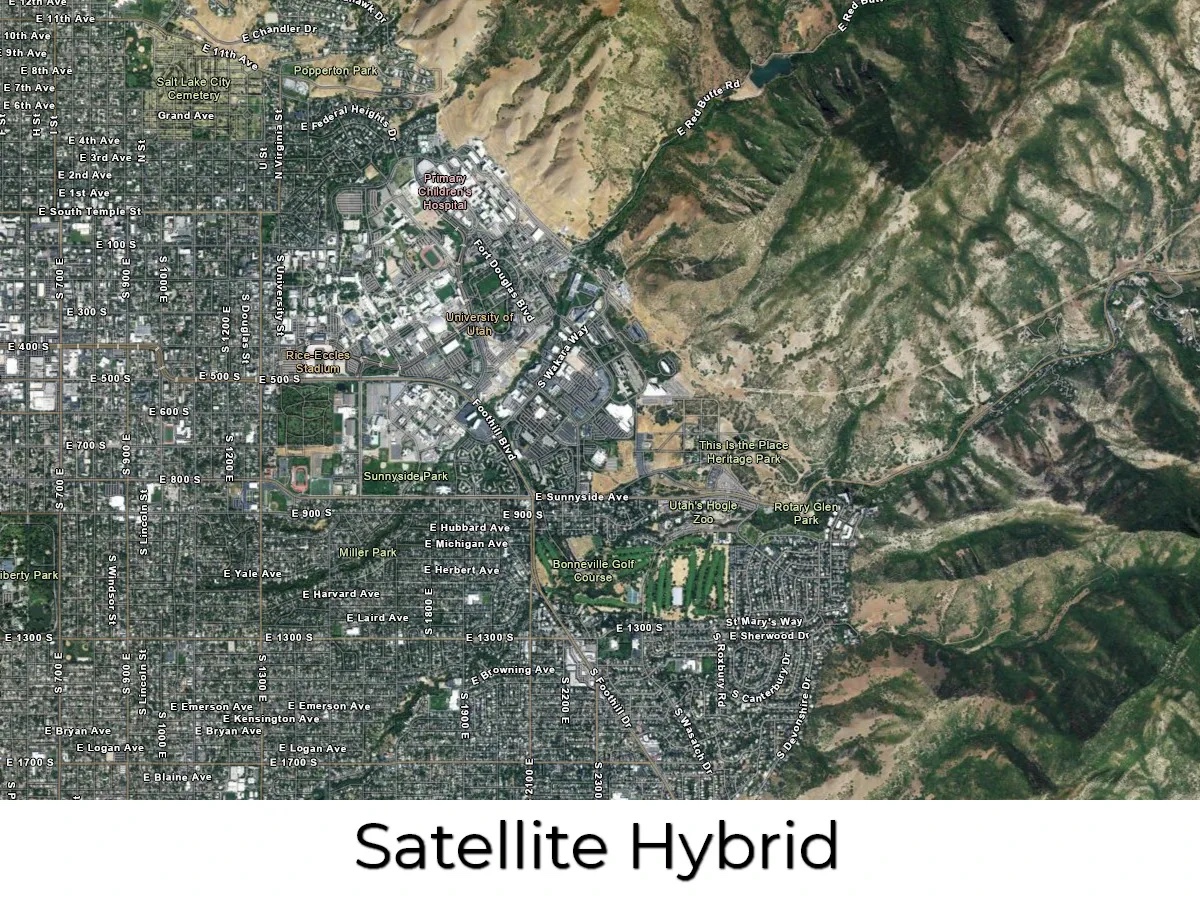
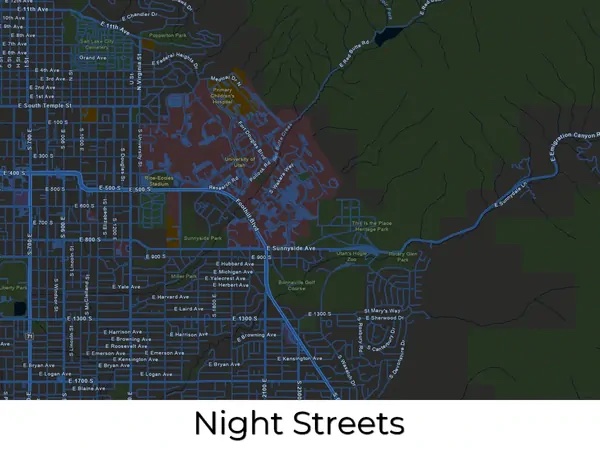
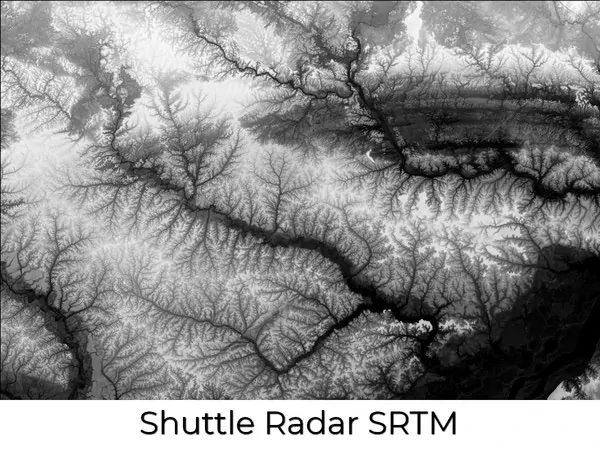
- Determine the design style of the map. There are over 40 styles to choose from. Typically, USGS maps are a style of their own, but they can be combined with other popular maps including satellite, terrain, topography, raised relief, and satellite hybrid.
- Add any special design features not included in the source map, such as special features, landmarks, legends, roads, cities, symbols, etc.
- Add elevation data. The next step is to add elevation data to the map. This can be done using a variety of techniques, such as contour lines, shading, or digital elevation models (DEMs).
- Print the Map Overlay. Latex vinyl materials are used for the map details and colors.
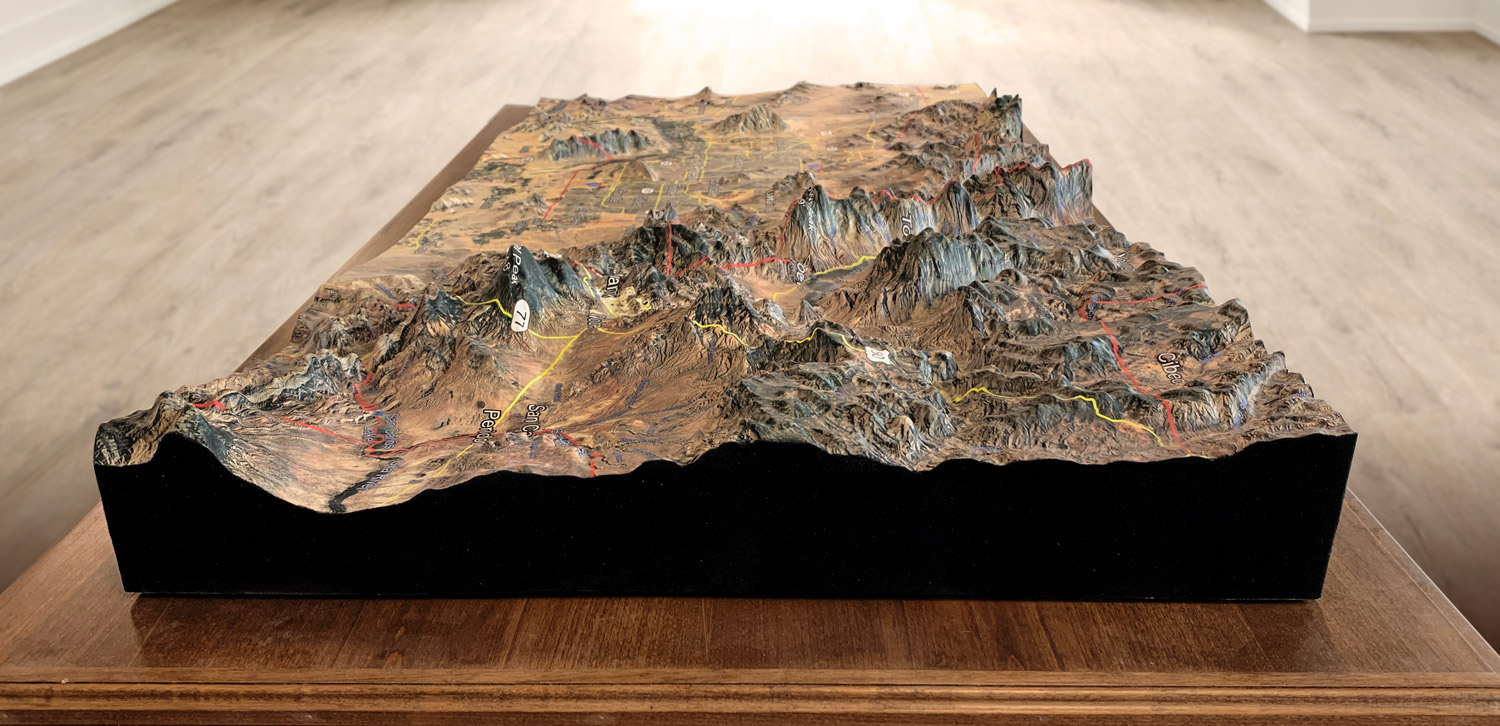
- Create the 3D physical map. Once the elevation data has been added to the map, a physical 3D structure is created that replicates the topography of the area. This can be done using 3D printed plastic or thermoformed molding/casting. Either approach is combined with the Vinyl overlay.
- Finish the map. This is where any excess materials are cutaway. Any special sealers, matte finishes, hardeners, or UV protection is applied. Wood, metal or plastic bases are built and border flocking may be applied.
Features & Benefits of USGS 3D Historical Topographic Maps
- Remarkably Strong: You can drive a 1-ton truck over our USGS historical topographic maps.
- Precision: We print our USGS historical topographic maps to scale as accurately as are the original files and images.
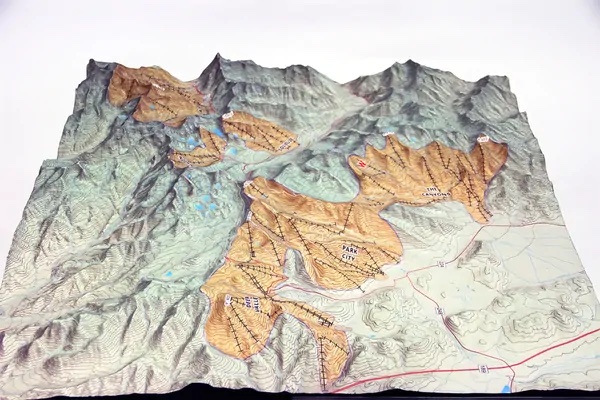
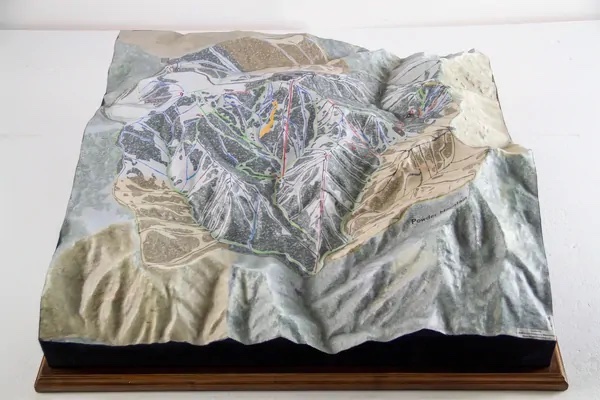
- Excitement: It is much easier to get excited about 3D views of your ski runs or trails than flat printed maps.
- Stain and Water Resistance: Spills are easy to wipe up.
- Communication: USGS historical topographic maps are simple to understand with a quick glance.
- Affordability: Our 3D technologies allow you to order custom 3D maps for a reasonable price.
- Testability: 3D technologies are affordable enough to test designs, such as several versions of planned work.
- Consistency: Using modern print and casting technologies, you can easily recreate identical 3D maps.
- Portability: We use lighter materials than what was available in the past, making our USGS historical topographical maps easy to transport.
Videos of 3D Maps
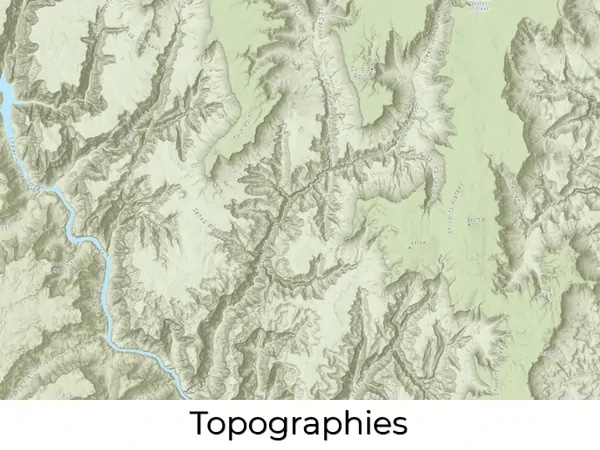
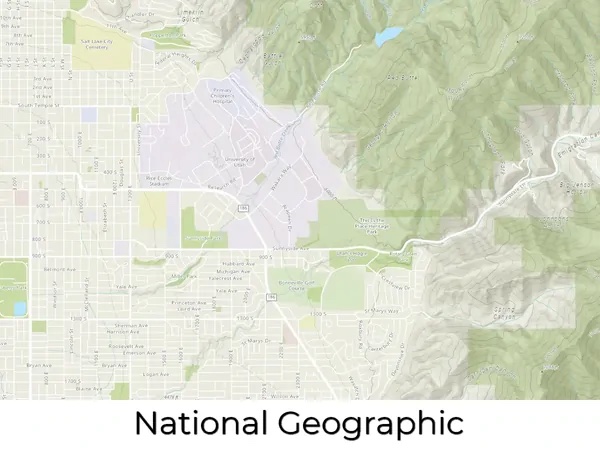
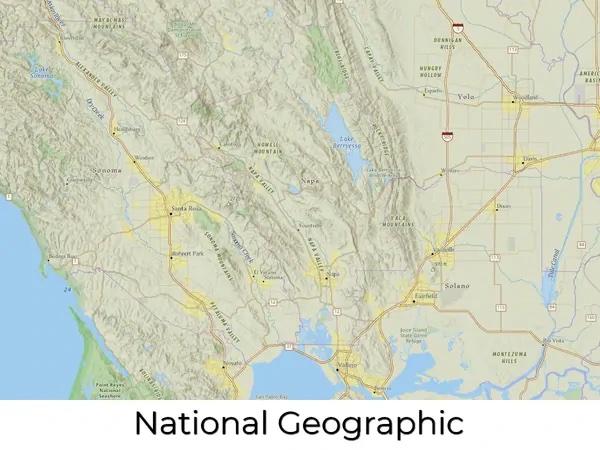
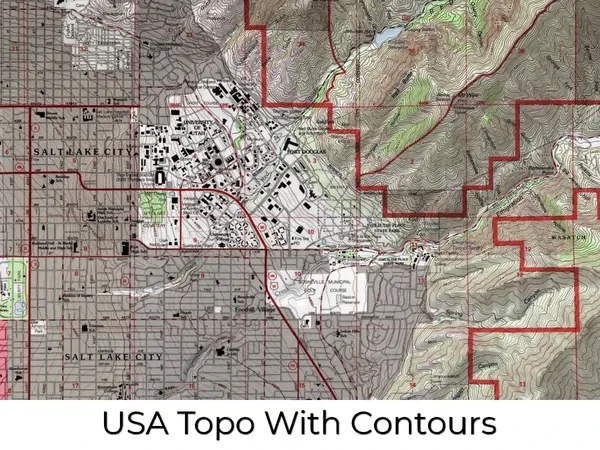
Map Design Styles of USGS Historical Topographic Maps
Many design styles, or base maps, serve as a starting point for your USGS historical topographic map. We source and create our base maps using the same digital tools that expert cartographers use to create maps. Once you have selected your base map, everything else is fully customizable. We can layer informational text (such as landmarks or other points of interest) and even change the colors to suit your preferences.
Complex layers can be added such as streams and lakes, terrain, roads, and even more detail like political boundaries, religious, and other population-based demographics. Multiple layers can also be added to the same USGS historical topographic map. For example, community developers and city planners can benefit from a 3D map with layers that include parcel lines, existing building footprints, and utility lines. Take a look at the map style categories below for inspiration.
Technology and Materials Used in USGS Historical Topographic Maps
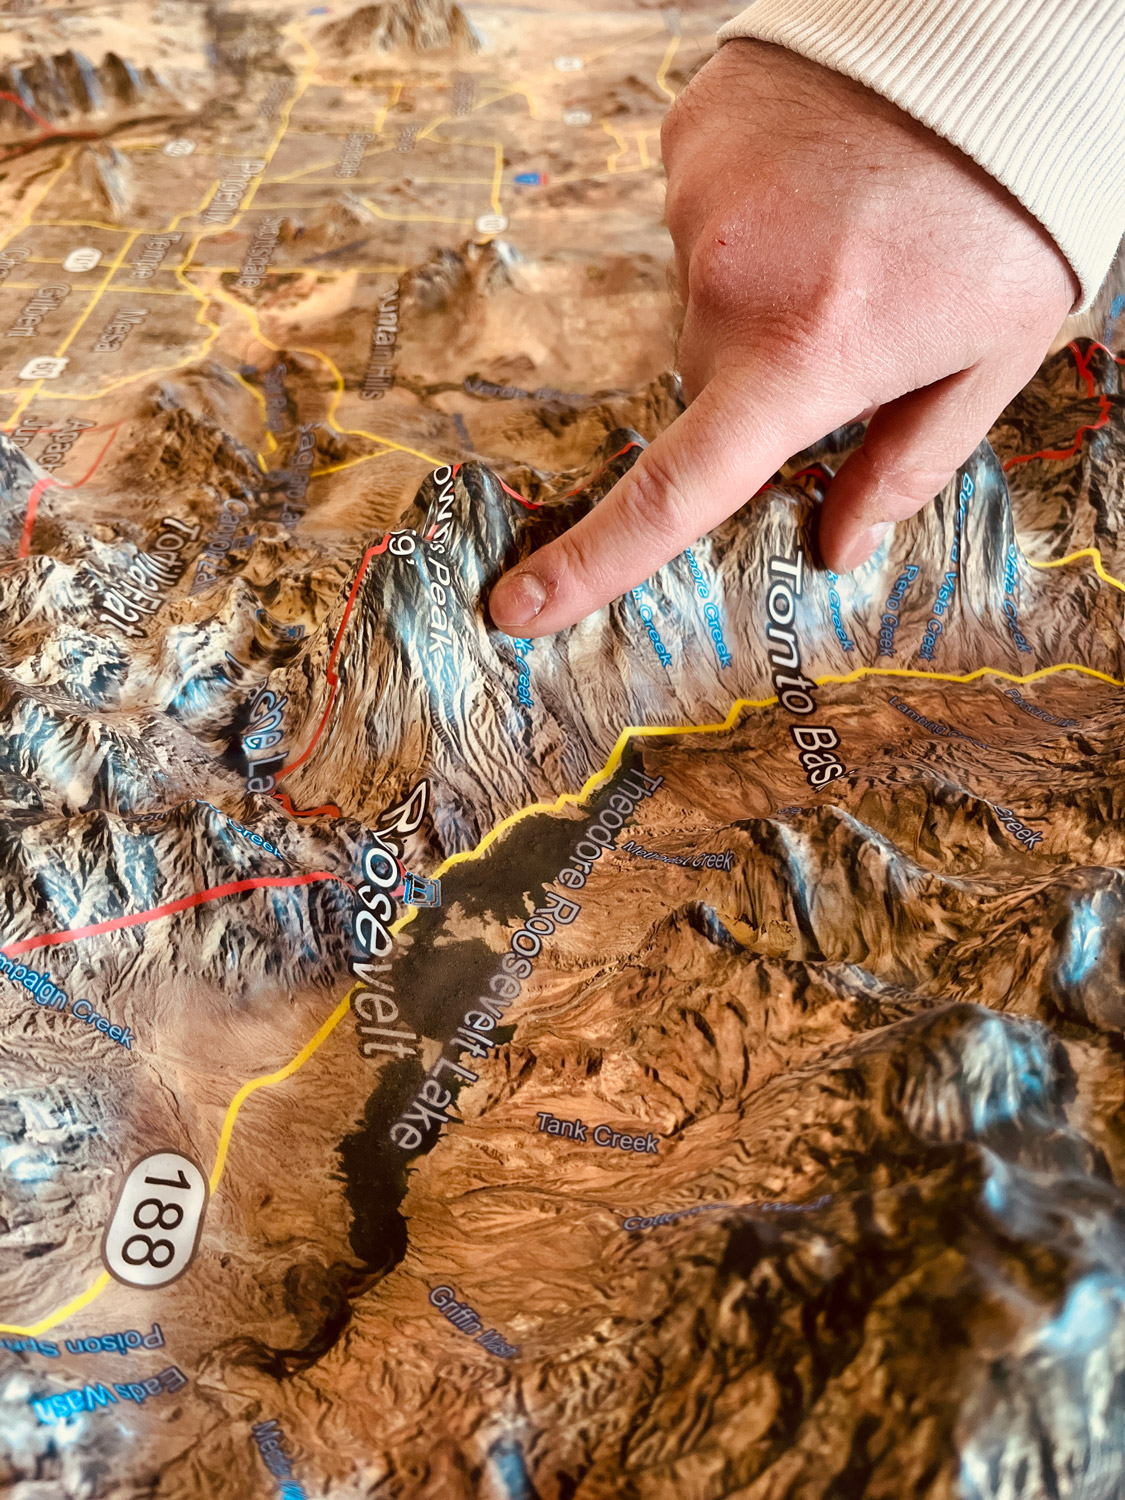
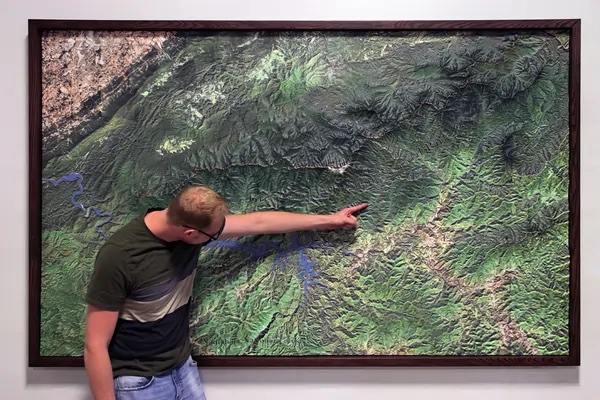
- With 3D printing technology, you are not limited to straight lines and boxes. The curves and cliffs are captured accurately and beautifully in astonishing detail.
- Your vision of the final 3D map determines which materials we will choose to produce the best results. We help you to determine the materials that best suit your project.
- We use fabrication technologies such as 3D printing, CNC cutting, and molding/casting.
- USGS historical topographical maps show incredible detail.
- Our maps are printed in full color (with over 17 million variations of color) for awe-inspiring presentations and displays. No painting required!
- Typically, we use a special process for finishing the sides of the raised relief maps in a suede-like material, similar to the finish of a jewelry box.
- Our in-house paint booth gives us flexibility in different types and grades of paint and finishing capabilities; we can provide UV-resistant coatings to protect the coloration of your 3M map for many years.
- We also offer customized additions to our 3D maps and models. Our in-house carpentry shop will build elegant bases, tables, or cabinetry to display any map you choose. Worried about dust? We can customize a case to protect your display as well. Our skilled artisans can hand-paint details to make your map a true work of art.
Pricing of Custom USGS Historical Topographic Maps
The price of 3D maps and models are generally based on your size requirements, specific design needs, and the amount of work it will take to produce. Each map is custom-built and charged for accordingly. The best way to determine cost is to email us, call us at 385-206-8700, or fill out the form below and let us bid on your project.
Get a Free Price Estimate for a Custom USGS Historical Topographic Map
Custom Fabrication Workflow

Common Questions & Answers
- What is the largest map you can fabricate? There is no limit to the size of a map we can build. There are practical limits that will impact shipping and installation, but we work closely with our customers on these special requirements.
- What type of 3D maps can you fabricate? All types. Satellite Maps, Terrain Maps, Topographical Maps, Raised Relief Maps, USGS Maps, Contour Maps, and many more.
- Can you fabricate with different technologies and materials? Yes. Our most common fabrication technology is 3D Printing, but we can also build 3D Maps with CNC Cutting, 3D Foam, Molding/Casting, Thermoforming, and Sculpting.
- What materials can you 3D print in? We match the correct material and fabrication process to your requirements in terms of presentation, size, and transportability. We can 3D print in PLA, FDM, Full-Color Sandstone, UV-cured resin, plastic, rubber-like, acrylic, and nylon – as well as combining multiple technologies.
- Can you sign a Non-disclosure Agreement that you supply? Yes.
- How long will it take to create my map? That depends on the design and size of the map. A more complex or detailed map will take longer than a simple map, we can’t really say exactly how long it will take until we have the chance to understand what type of map you want fabricated. Generally, smaller standard maps can be a couple of weeks and large museum exhibition maps can be 6 months.
- What do you need from me to start the map fabrication? Boundaries are a good place to start. Determining map styles, sizes, height (may be exaggerated), and cabinetry needs are all part of the process. Special design features can also be added.
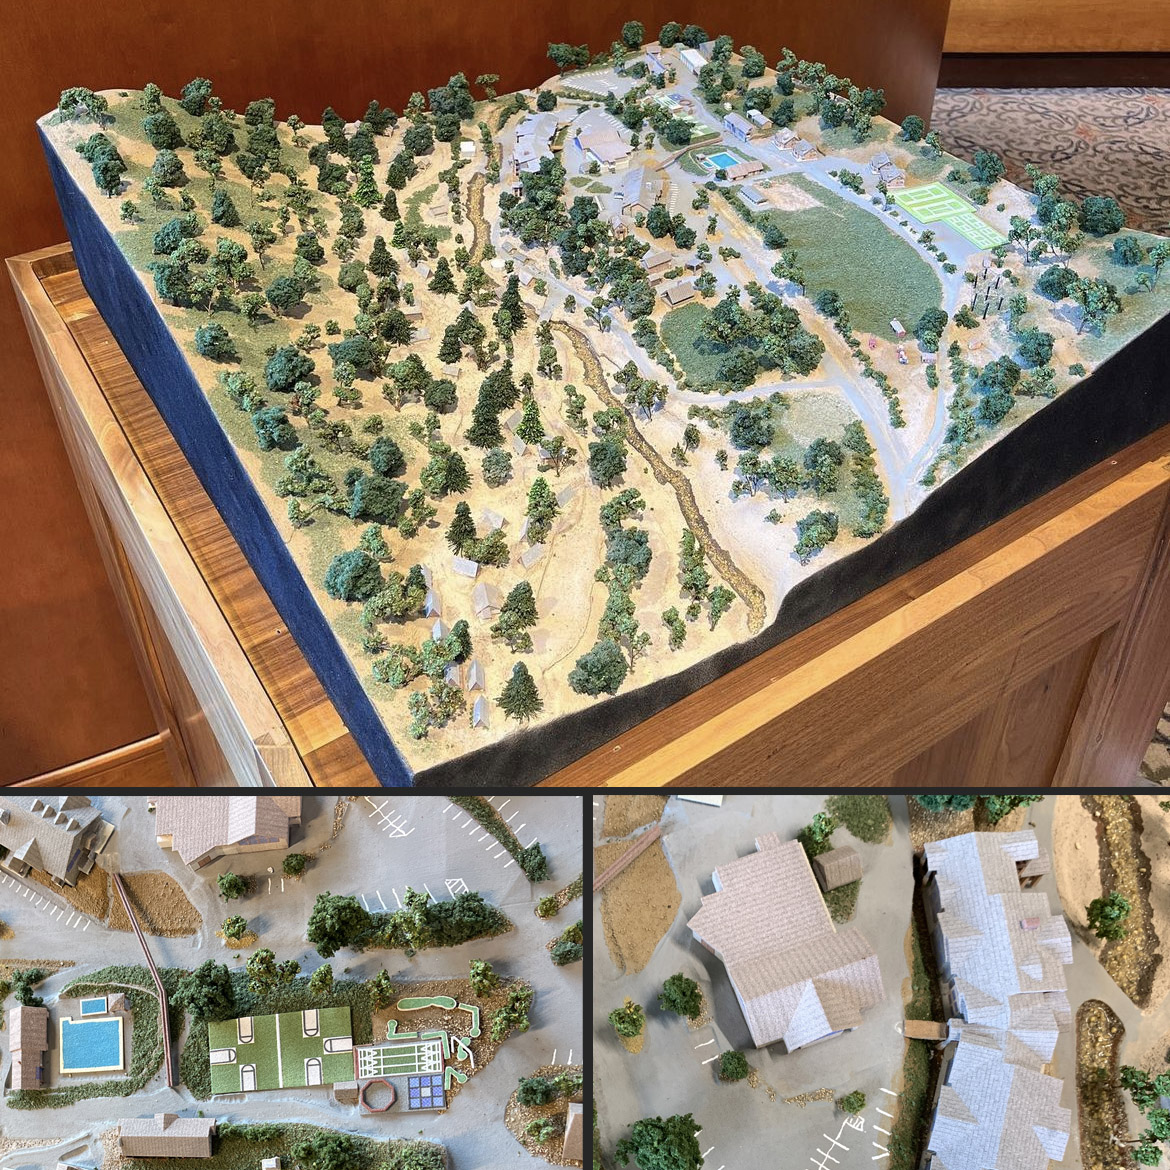
- Can you add homes, buildings, swimming pools, arbors, hardscaping features, etc.? Yes. We can 3D print many of these items and include them in our maps. We refer to these more complex maps as architectural dioramas.
- What is a USGS historical topo map? A USGS historical topo map is a topographical map produced by the United States Geological Survey (USGS). It is a detailed representation of the Earth’s surface, showing the shape and features of the terrain such as hills, valleys, ridges, and other natural and man-made features. USGS historical topo maps use contour lines to indicate changes in elevation, which allows users to visualize the shape of the land. These maps are typically created using aerial photography and other data sources, and are widely used for scientific research, environmental analysis, and outdoor recreation such as hiking, camping, and hunting. They are also used by government agencies, emergency responders, and others for planning and management purposes. USGS topo maps are available in a variety of scales, with the most common being 1:24,000 (also known as 7.5-minute quadrangles). The scale of a map refers to the relationship between the size of the area being mapped and the size of the map itself. A 1:24,000 scale map, for example, means that one unit of measurement on the map represents 24,000 units of measurement on the ground. USGS topo maps are an important tool for exploring and understanding the natural world. By showing the physical features of the land, they provide valuable information for scientists, researchers, and outdoor enthusiasts alike.
- How do I read a USGS historical topo map? Reading a USGS historicaltopo map can be a little bit complicated, but with practice and patience, it becomes easier. Here are the steps to follow:
Get familiar with the map key and scale: The map key explains the symbols used on the map, and the scale tells you how to interpret the distance on the map. Look for the scale bar, usually located in the bottom or top corner of the map.
Identify the contour lines: Contour lines are the most important feature of a topographic map. They are the brown lines that connect points of equal elevation. Each contour line represents a specific elevation, and the closer the lines are, the steeper the slope.
Determine the elevation: Look for the contour line that passes closest to the point you are interested in. The elevation of that point is the elevation of the contour line plus any additional feet or meters between the line and the point.
Find the water features: Blue lines on the map represent rivers, streams, and other bodies of water. The closer the lines are, the larger the body of water.
Look for man-made features: Topographic maps also include symbols for buildings, roads, trails, and other man-made features. These symbols vary depending on the map, so be sure to refer to the map key.
Orient yourself: Use the map’s north arrow or declination diagram to orient the map. This will help you understand the location of features in relation to one another and to your own location.
Plan your route: Once you are familiar with the map, you can use it to plan your route. Identify the elevation changes and terrain features to determine the difficulty of the route.
- How is elevation shown on a USGS historical topographical map? Elevation is shown on a USGS historical topographical map using contour lines. Contour lines are brown lines that connect points of equal elevation. Each contour line represents a specific elevation, and the closer the lines are, the steeper the slope. To help you visualize this, imagine a mountain with a peak at the top. If you were to draw a line around the mountain that connects all the points that are at the same elevation (e.g. 1,000 feet), you would have a contour line. You would then draw another line around the mountain that connects all the points at a different elevation (e.g. 1,500 feet), and you would have a second contour line. On a USGS historical topographical map, the elevation of each contour line is shown in feet or meters. The lines are labeled with the elevation, typically every fifth line. For example, if the contour lines are labeled at 100-foot intervals, you would see a label for 100 feet, 200 feet, 300 feet, and so on. Using the contour lines, you can determine the elevation of any point on the map. You simply need to find the closest contour line to the point of interest and then estimate the elevation based on the spacing of the contour lines. For example, if the contour lines are spaced 20 feet apart and the point of interest is halfway between two contour lines labeled 100 feet and 120 feet, you would estimate that the elevation is 110 feet.
- What do the contour lines on a USGS historical topographical map represent? The contour lines on a USGS historicaltopographical map represent points of equal elevation. They are brown lines that connect all the points on the map that are at the same elevation above sea level.
Each contour line represents a specific elevation, and the vertical distance between adjacent contour lines is called the contour interval. The contour interval is typically labeled on the map and indicates the difference in elevation between two adjacent contour lines. For example, a contour interval of 10 feet means that each contour line represents a difference in elevation of 10 feet.
Contour lines provide important information about the terrain of an area. They show the shape and steepness of the land, as well as the location of ridges, valleys, and other topographic features. For example, if the contour lines are spaced closely together, it indicates a steep slope, while widely spaced contour lines indicate a gentle slope.
- What is the scale of a USGS historical topographical map? The scale of a USGS historicaltopographical map refers to the relationship between the size of the map and the actual size of the area it represents. Specifically, it is the ratio of the distance on the map to the corresponding distance on the ground.
USGS historical topographical maps are available in a variety of scales, ranging from 1:24,000 to 1:1,000,000. The most common scale for USGS topographical maps is 1:24,000, which means that one unit of measurement on the map (such as an inch or a centimeter) represents 24,000 units of the same measurement on the ground.
For example, if the scale of a USGS historical topographical map is 1:24,000, then one inch on the map would represent 24,000 inches (or 2,000 feet) on the ground. This scale is often used for hiking, camping, and outdoor activities in a specific area.
Other common scales for USGS historical topographical maps include 1:100,000 and 1:250,000, which are used for regional planning and navigation. Larger scales, such as 1:1,000,000, are used for general reference and overview maps.
It is important to note that the scale of a USGS historical topographical map affects the level of detail that is shown on the map. Maps with smaller scales (e.g. 1:250,000) show a larger area but with less detail, while maps with larger scales (e.g. 1:24,000) show a smaller area but with more detail.
- How do I calculate gradient on a USGS historical topographical map? To calculate the gradient on a USGS historical topographical map, you need to determine the change in elevation between two points and the distance between those points. The gradient is the ratio of the change in elevation to the distance traveled.
Here’s a simple formula to calculate gradient:
Gradient = Change in Elevation / Distance Traveled
To illustrate this, let’s say you want to calculate the gradient of a hiking trail on a USGS topographical map. You can follow these steps:
Identify two points on the trail that you want to calculate the gradient between. These points can be marked on the map using a pen or pencil.
Determine the elevation of each point using the contour lines on the map. You can find the elevation by looking for the closest contour line and estimating the elevation based on the contour interval. For example, if the contour interval is 20 feet and the closest contour line is labeled 100 feet, the elevation of the point would be 100 feet.
Subtract the elevation of the starting point from the elevation of the ending point to get the change in elevation.
Measure the distance between the two points using a ruler or a scale on the map. Make sure the units of measurement match, such as inches or centimeters.
Divide the change in elevation by the distance traveled to get the gradient. The result will be a ratio, such as 1:10 or 1:20. You can also convert this ratio to a percentage by multiplying it by 100.
For example, if the change in elevation is 200 feet and the distance traveled is 1,000 feet, the gradient would be:
Gradient = Change in Elevation / Distance Traveled Gradient = 200 feet / 1,000 feet Gradient = 1:5
In this case, the gradient would also be 20% (1:5 x 100 = 20%). This means that for every 5 units of distance traveled, there is a 1-unit change in elevation.
- What is the contour interval on a USGS historical topographical map? The contour interval on a USGS historical topographical map is the vertical distance between adjacent contour lines. Each contour line on the map represents a specific elevation, and the contour interval indicates the difference in elevation between two adjacent contour lines.
For example, if the contour interval on a USGS historical topographical map is 10 feet, then each contour line represents a difference in elevation of 10 feet. If the elevation of one contour line is 100 feet, the next contour line above it would represent an elevation of 110 feet, and the contour line below it would represent an elevation of 90 feet.
The contour interval is typically labeled on the map and varies depending on the scale of the map and the topography of the area represented. In areas with steep terrain, the contour interval may be smaller to show more detail, while in areas with gentle slopes, the contour interval may be larger.
Knowing the contour interval is important when reading a USGS historical topographical map because it allows you to determine the elevation of specific points on the map and to visualize the topography of the area. By counting the number of contour lines between two points, you can calculate the difference in elevation between those points.
- How do I add USGS historical topographic maps to Google Earth? To add USGS historical topographic maps to Google Earth, you can follow these steps:
Go to the USGS website and download the topographic map you want to use in KML format. Make sure the map is in KML format, as Google Earth does not support other file formats.
Open Google Earth on your computer.
In the left-hand panel, click on “My Places” to expand the folder.
Right-click on “My Places” and select “Add” > “Folder” to create a new folder for your USGS topographic maps.
Name the folder something like “USGS Topographic Maps” and click “OK” to create the folder.
Right-click on the new folder and select “Import KML File” to add the USGS topographic map to Google Earth.
Browse to the location where you saved the USGS topographic map on your computer and select the KML file.
Click “Open” to add the USGS topographic map to Google Earth. The map will appear in the left-hand panel under the folder you created.
You can now view the USGS historical topographic map in Google Earth by clicking on the map in the left-hand panel. The map will be displayed in the 3D view of Google Earth, and you can zoom in and out and adjust the view as needed.
Repeat steps 4 to 9 for any additional USGS historical topographic maps you want to add to Google Earth.
Note that some USGS historical topographic maps may not be available in KML format, in which case you may need to use a third-party tool to convert the map to KML format before importing it into Google Earth.
- How do I download historical topo maps from USGS? You can download historical topo maps from USGS by following these steps:
Go to the USGS website at https://ngmdb.usgs.gov/topoview/viewer.
In the search bar at the top of the page, enter the location for which you want to download a topo map. You can enter a specific address, city, state, or zip code.
Use the options on the right-hand side of the page to filter your search results by map scale, date, and other criteria if desired.
Click on the map tile for the area you want to download. A preview of the map will be displayed.
There are many options for downloading in the desired file format. Click on the desired file type.
Repeat steps 4-5 for any additional map tiles you want to download.
Note that USGS topo maps are available at a variety of scales, and the specific scale and level of detail will depend on the area and the map you select.
- Why do all USGS historical topographic maps use the same legend? All USGS historical topographic maps use the same legend to maintain consistency and standardization across different maps. The legend provides a standardized way of representing features and symbols on the map, making it easier for users to read and interpret different maps.
The legend used on USGS topographic maps includes a range of symbols and colors that represent different types of features, such as contour lines, roads, water bodies, and vegetation. By using a consistent set of symbols and colors, users can easily recognize and interpret these features regardless of the location or scale of the map.
Additionally, the use of a standardized legend makes it easier for cartographers and surveyors to create new maps and update existing ones. By adhering to a common set of symbols and conventions, the process of map-making is streamlined and more efficient.
Overall, the use of a standardized legend on USGS topographic maps helps to ensure accuracy, consistency, and ease of use for users across a wide range of applications and geographic locations.
- Are standard USGS historical topos in utm or lat/long? USGS historical topographic maps typically include both UTM (Universal Transverse Mercator) and latitude/longitude coordinates, as well as a variety of other geographic information, such as contour lines, geographic features, and elevation data.
The UTM coordinates are often included in the margins of the map and provide a grid-based reference system that can be used to locate specific points on the map. The latitude/longitude coordinates are typically included on the map itself, allowing users to locate their position using a GPS device or other navigation tool.
It is worth noting that the accuracy of the coordinates on USGS historical topographic maps can vary depending on a variety of factors, including the age of the map, the precision of the surveying techniques used, and any changes to the landscape since the map was created. As such, it is important to use caution when relying on map coordinates for navigation or other critical purposes, and to verify your position using other sources of information whenever possible.
- What is the difference between a 7.5-minute and 15-minute USGS historical topographical map? The main difference between a 7.5-minute and 15-minute USGS historical topographical map is the scale and coverage area of the map.
A 7.5-minute USGS topographical map covers an area of approximately 7.5 minutes of latitude by 7.5 minutes of longitude, or approximately 1/4 of a degree in both directions. These maps are typically produced at a scale of 1:24,000, meaning that 1 inch on the map represents 2,000 feet on the ground. As a result, these maps provide a high level of detail and are useful for navigating on foot or by vehicle in relatively small areas, such as parks, wilderness areas, or rural communities.
A 15-minute USGS topographical map, on the other hand, covers an area of approximately 15 minutes of latitude by 15 minutes of longitude, or approximately 1/2 of a degree in both directions. These maps are typically produced at a scale of 1:62,500, meaning that 1 inch on the map represents 5,208 feet on the ground. As a result, these maps provide a broader view of the landscape and are useful for planning trips over larger areas, such as backcountry expeditions, hunting or fishing trips, or driving tours.
- What are some of the symbols on a USGS historical topographical map? There are many symbols on a USGS historical topographical map, but here are some of the most common ones:
Contour lines: These lines connect points of equal elevation and are used to depict the shape of the terrain.
Spot elevations: These are points on the map that indicate the exact elevation of a particular location.
Roads: These symbols indicate different types of roads, including highways, interstates, and smaller roads.
Trails: These symbols indicate different types of trails, including hiking, biking, and horseback riding trails.
Buildings: These symbols represent different types of structures, including houses, schools, and churches.
Water features: These symbols represent different types of bodies of water, including lakes, rivers, and streams.
Vegetation: These symbols represent different types of vegetation, including forests, grasslands, and cultivated fields.
Railroads: These symbols indicate the location of railroads and their routes.
Boundaries: These symbols indicate different types of boundaries, including state lines, county lines, and national park boundaries.
Power lines: These symbols indicate the location of power lines and their routes.
Overall, the symbols on a USGS historical topographical map provide a wealth of information about the landscape and the features that exist within it.
- How do I determine the distance between two points on a USGS historical topographical map? To determine the distance between two points on a USGS historical topographical map, you will need to use a ruler or a string and a scale bar.
Find the scale bar on the map. The scale bar shows the distance that a specific unit of measurement represents on the map. For example, 1 inch may represent 1 mile.
Determine the distance between the two points on the map by using a ruler or a string. Make sure that the ruler or string is lined up with the scale bar and that you are using the correct units of measurement.
Once you have determined the distance between the two points on the map, you can convert it to real-world units of measurement, such as feet or kilometers, by using the scale bar.
It’s important to note that this method will only give you an approximate distance between the two points, as the scale of the map may not be perfectly accurate. Additionally, this method does not take into account any elevation changes or other factors that may affect the actual distance between the two points.
- How accurate are USGS historical topographical maps? USGS historical topographical maps are generally considered to be accurate, but their level of accuracy can vary depending on several factors.
The contour lines on a USGS historical topographical map are typically accurate within a certain range, which is determined by the contour interval. For example, a map with a contour interval of 10 feet will show changes in elevation at increments of 10 feet, but may not accurately represent smaller changes in elevation.
Additionally, topographical maps can be affected by factors such as changes in the landscape due to natural disasters, construction, or other human activity. The accuracy of the maps can also be affected by the scale of the map, as smaller scale maps may not show as much detail as larger scale maps.
To ensure the most accurate information, it is important to use USGS topographical maps in conjunction with other sources of information and to be aware of any potential inaccuracies or limitations. It is also recommended to regularly update your maps and seek out the most recent versions available.
- What are some tips for using a USGS historical topographical map? Here are some tips for using a USGS historical topographical map:
Understand the legend: The legend is key to understanding the information presented on the map. Take some time to familiarize yourself with the symbols and colors used on the map.
Know the scale: The scale of the map will determine the level of detail and the area covered. Make sure you understand the scale before using the map.
Orient yourself: Use a compass or GPS device to orient yourself to the map. This will help you understand the direction of travel and the locations of landmarks.
Use contour lines: Contour lines can help you visualize the terrain and understand the elevation changes. Pay attention to the contour intervals and use them to calculate gradients and estimate elevations.
Identify key features: Look for key features such as rivers, lakes, and mountain peaks. Use these landmarks to orient yourself and navigate through the map.
Consider the season and weather: Seasonal changes and weather can affect the landscape and the accuracy of the map. Take these factors into consideration when using the map.
Use a protective case: If you plan to take the map into the field, consider using a protective case to keep it safe from the elements.
Practice using the map: The more you use the map, the more comfortable you will become with its features and information. Practice using the map in different environments and situations to improve your skills.
- How do I locate landmarks on a USGS historical topographical map? To locate landmarks on a USGS historical topographical map, you can follow these steps:
Look for natural features: The map will often show natural features such as rivers, lakes, mountains, and forests. Use these features to help orient yourself and locate landmarks.
Look for man-made features: The map will also show man-made features such as roads, buildings, and structures. Use these features to help locate landmarks.
Use the legend: The legend on the map will show symbols for various landmarks such as churches, cemeteries, and other important locations. Use these symbols to help locate specific landmarks.
Use a grid reference system: Some maps may have a grid reference system that can help you locate landmarks more precisely. Use the grid reference system to identify the location of a landmark based on its coordinates.
Use a compass or GPS device: A compass or GPS device can help you navigate to a specific location on the map. Use the device to follow a bearing to the landmark.
Use triangulation: If you can see the landmark from multiple locations, you can use triangulation to determine its location. Take bearings to the landmark from multiple locations and use the intersection of the bearings to determine the location of the landmark.
Do you have a question we didn’t answer? Don’t hesitate to contact us at 1-385-206-8700 or [email protected].
Worldwide Delivery
WhiteClouds has delivered maps around the world.
History of USGS Historical Topographic Maps
The United States Geological Survey (USGS) has been producing topographical maps for over a century. These maps have become an indispensable tool for scientists, geologists, land managers, urban planners, and adventurers alike, providing a detailed and accurate representation of the landscape. But how did the USGS topographical maps come to be? Let’s take a look at the history of these iconic maps.
The origins of USGS topographical maps can be traced back to the late 1800s. At the time, there was a growing need for accurate maps of the United States, particularly in the western territories, where new mines and settlements were being established. In response to this need, Congress established the USGS in 1879, with the mission to “classify the public lands and to examine the geological structure, mineral resources, and products of the national domain.”
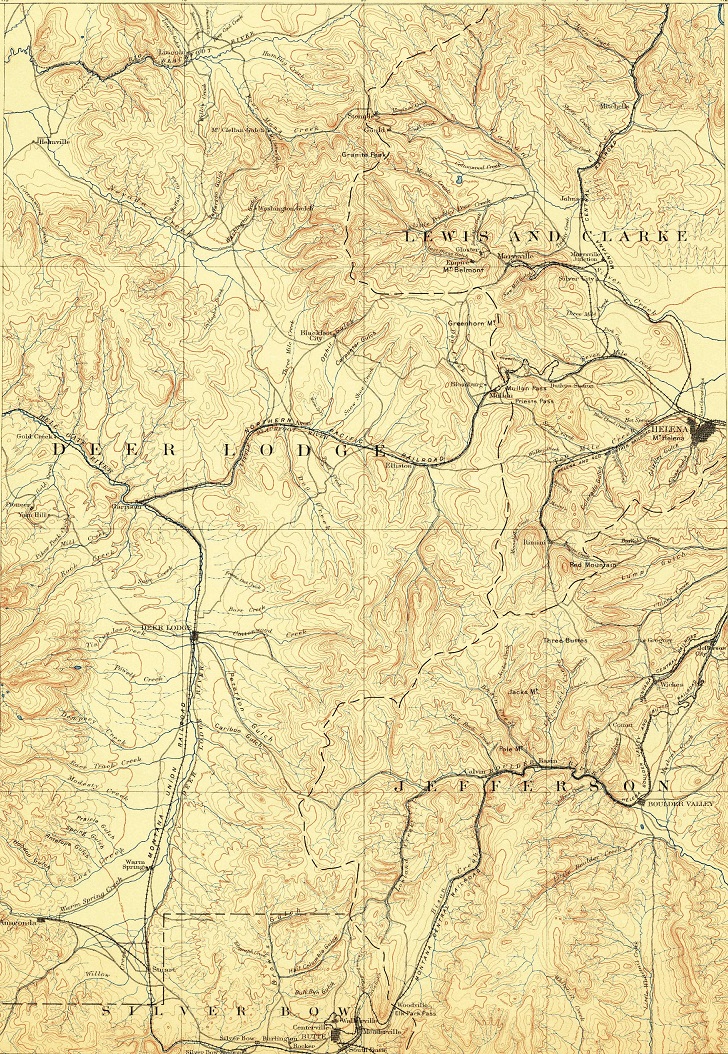
One of the primary tasks of the USGS was to create accurate maps of the United States, and in 1885, one of the first USGS topographical maps was published. This map covered an area of 4,000 square miles in central Montana and was created using the latest surveying and mapping techniques of the time. Over the next few years, the USGS continued to produce topographical maps of various regions, with a focus on the western territories.
By the early 1900s, the USGS had developed a standardized mapping system that would become the foundation for all future topographical maps. This system included a consistent scale of 1:62,500 (one inch equals one mile), a contour interval of 100 feet, and standardized symbols for natural and man-made features.
Throughout the 20th century, the USGS continued to refine and improve their mapping techniques, incorporating new technologies such as aerial photography and remote sensing. They also expanded their coverage to include all 50 states and Puerto Rico, creating a comprehensive library of topographical maps that spanned the entire country.
In recent years, the USGS has shifted their focus to digital mapping, creating online tools and resources that allow users to access and manipulate topographical data in new and innovative ways. However, the legacy of the USGS historical topographical maps lives on, with these iconic maps continuing to be an essential tool for understanding and exploring the United States.
The history of the USGS topographical maps is a story of innovation, dedication, and a commitment to accuracy and detail. From their humble beginnings in the late 1800s to their modern-day digital counterparts, these maps have played an essential role in shaping our understanding of the landscape and will continue to do so for generations to come.