Topographical Maps
What is a Topographical Map?
We build 2D and 3D Topographical Maps
Table of Contents
Topographical Maps
Topographical maps, also known as contour maps, are the ultimate guide to exploring the earth’s terrain. These graphical representations showcase the elevation and relief of the land, providing an unparalleled sense of adventure and excitement. Used for a wide range of purposes, including military planning, engineering projects, environmental studies, and outdoor recreation, topographical maps are an essential tool for anyone who works with the natural environment.
The key feature of topographic maps is their use of contour lines. These magical lines show the shape of the land by indicating the elevation of each point on the map. The lines connect points of equal elevation, allowing the viewer to see the shape of hills, valleys, and other landforms. With the contour lines spaced at regular intervals, such as every 10 meters, and labeled with their elevation above sea level, you can explore every nook and cranny of the terrain with ease.
One of the most thrilling advantages of topographical maps is their ability to convey three-dimensional information on a two-dimensional surface. The use of contour lines to represent elevation gives you a sense of the shape of the land that can be difficult to visualize from other sources. Imagine a satellite image of a mountain range that shows the peaks and valleys, but nothing more. With a topographical map, you can see just how steep the slopes are or how deep the valleys go.
Topographical maps are incredibly flexible and can be used at a range of scales, from small-scale maps that cover entire countries to large-scale maps that show individual buildings or even rooms. This flexibility makes topographical maps the perfect companion for every adventure, from planning a hiking trip to designing a dam.
But that’s not all, topographical maps include a range of other features that are useful for understanding the land. You can find symbols for roads, buildings, and other infrastructure, as well as markers for natural features like rivers and lakes. The maps also include shading or coloration to indicate the steepness of slopes, allowing you to plan your route with confidence.
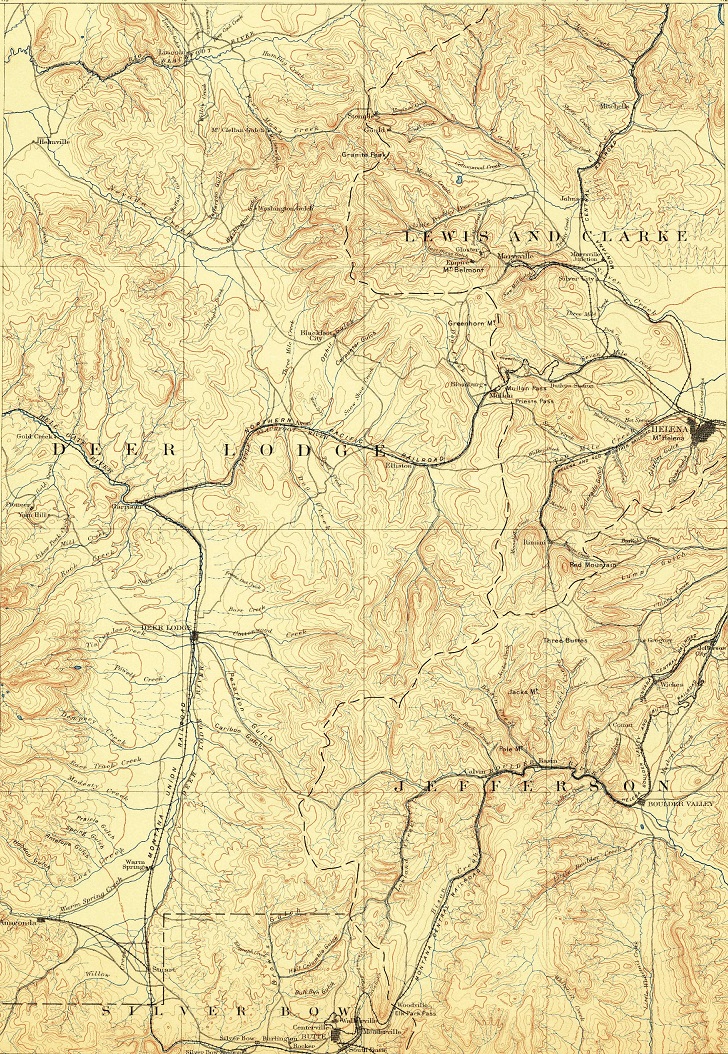
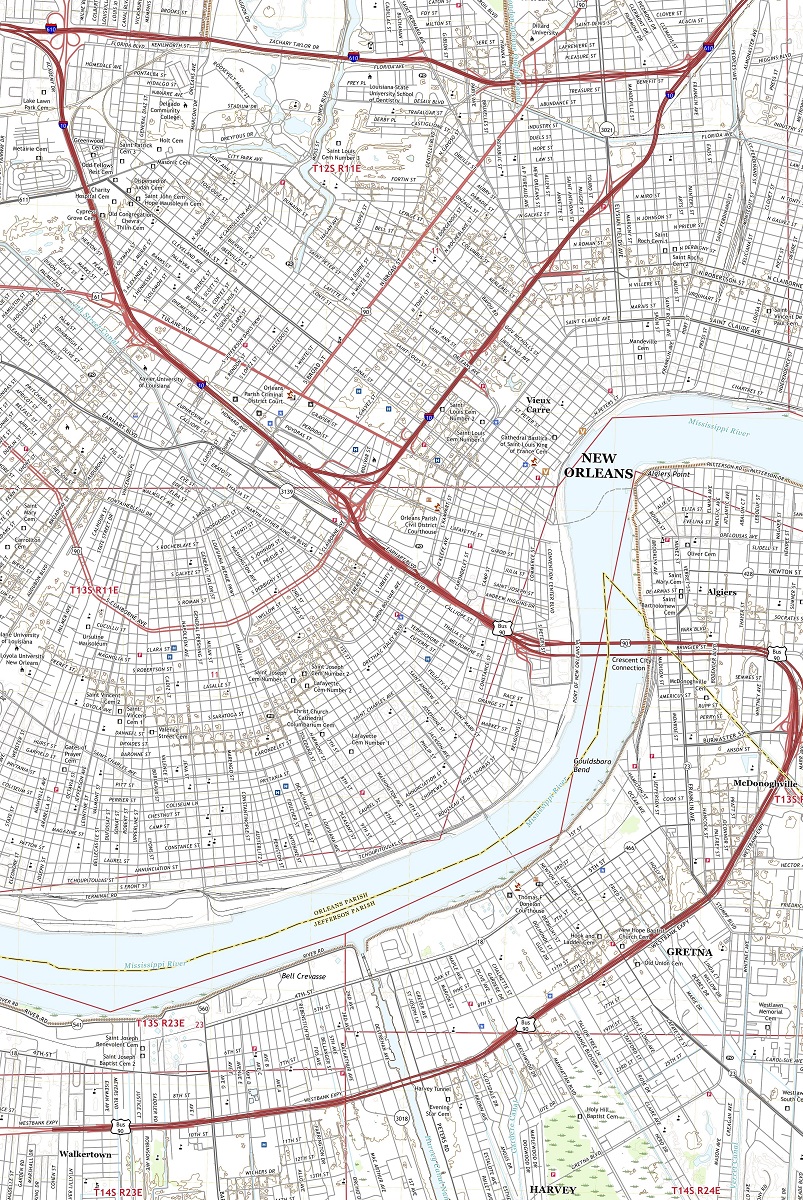
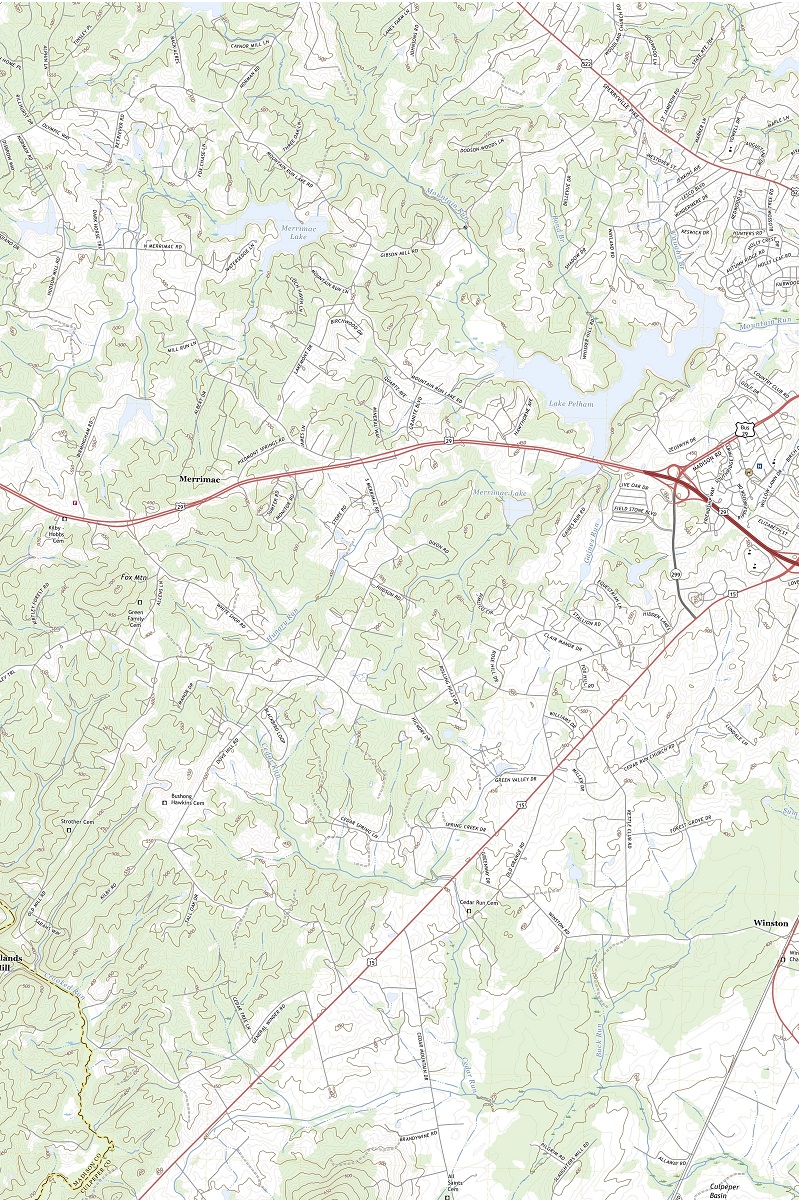
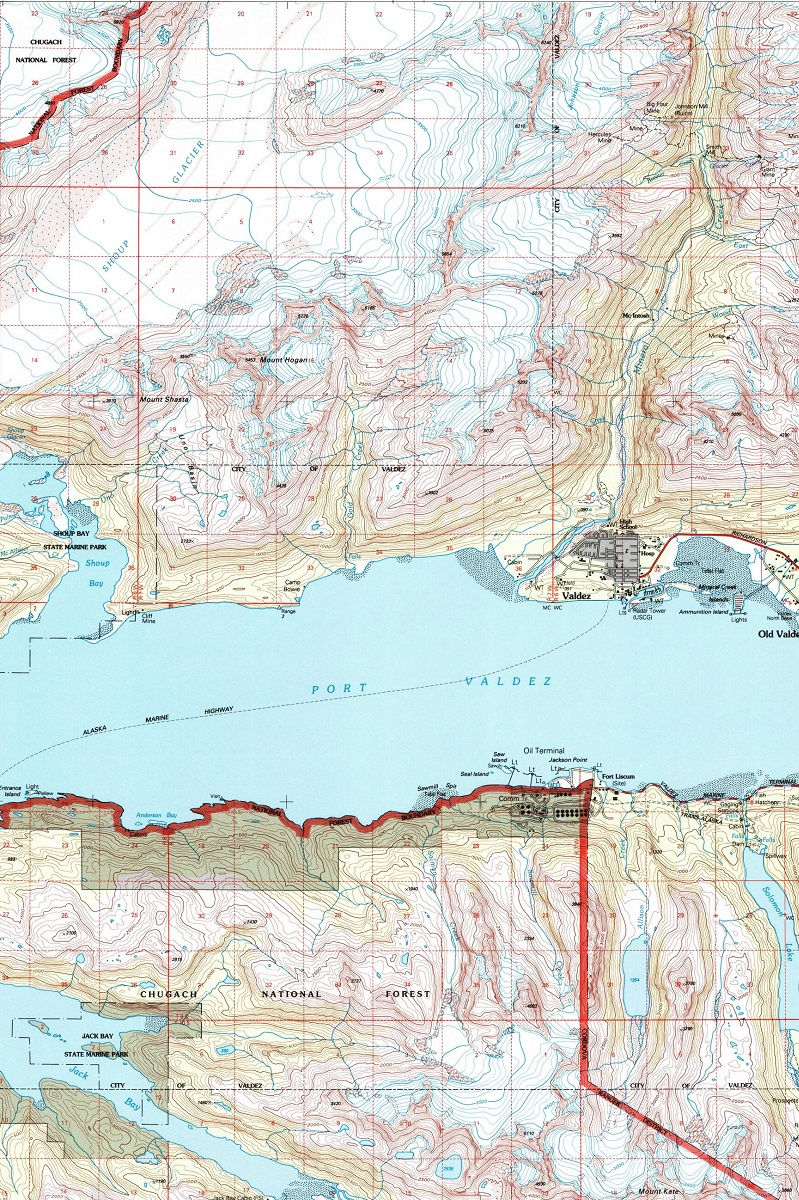
Sample USGS Topographical Maps
New Orleans Louisiana 2020-USGS Topographic Map
Culpeper Virginia 2020-USGS Topographic Map
Valdez Alaska 1996-USGS Topographic Map
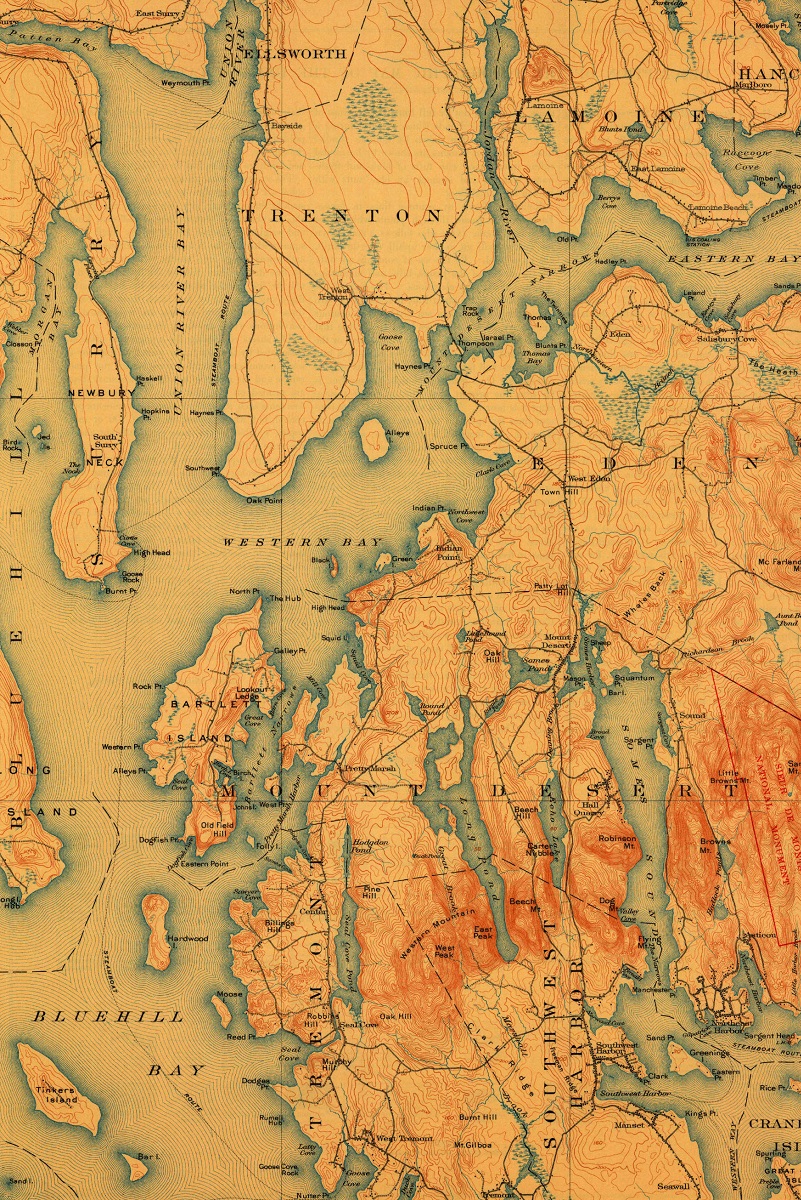
Acadia National Park 1904-USGS Topographic Map
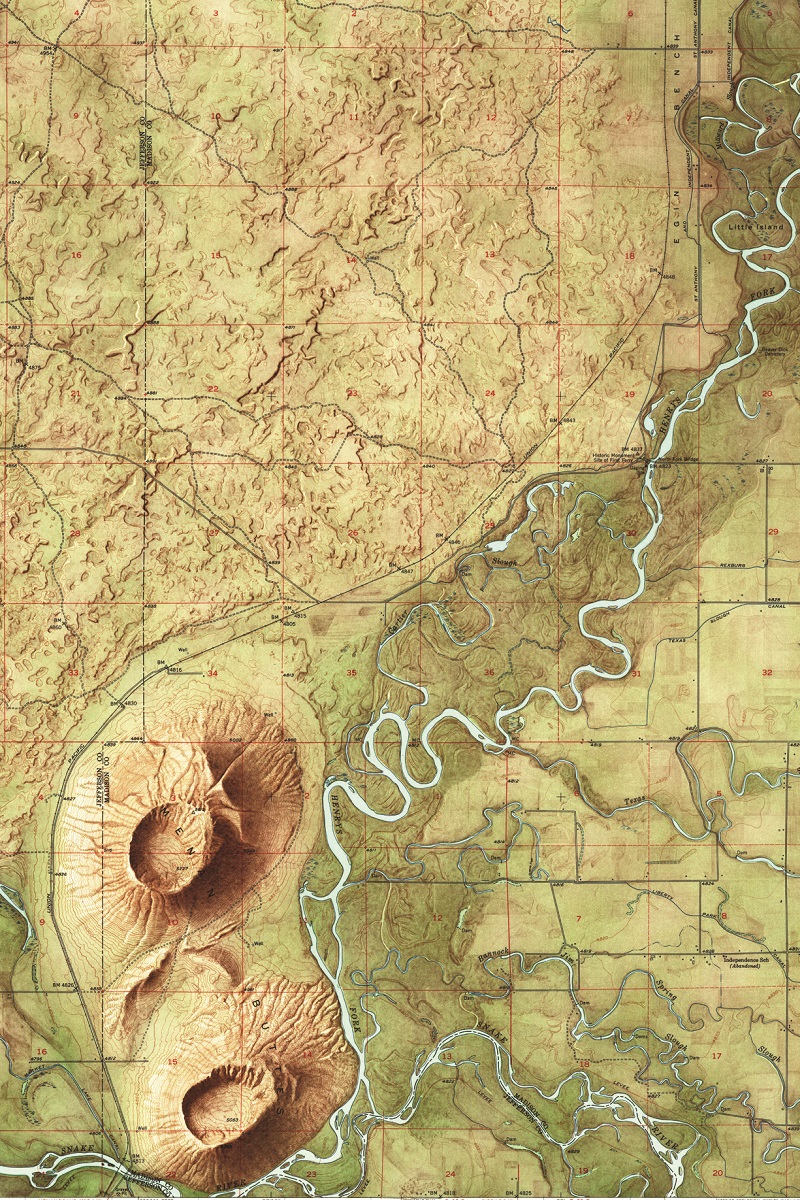
Menan Buttes Idaho 1951-USGS Topographic Map
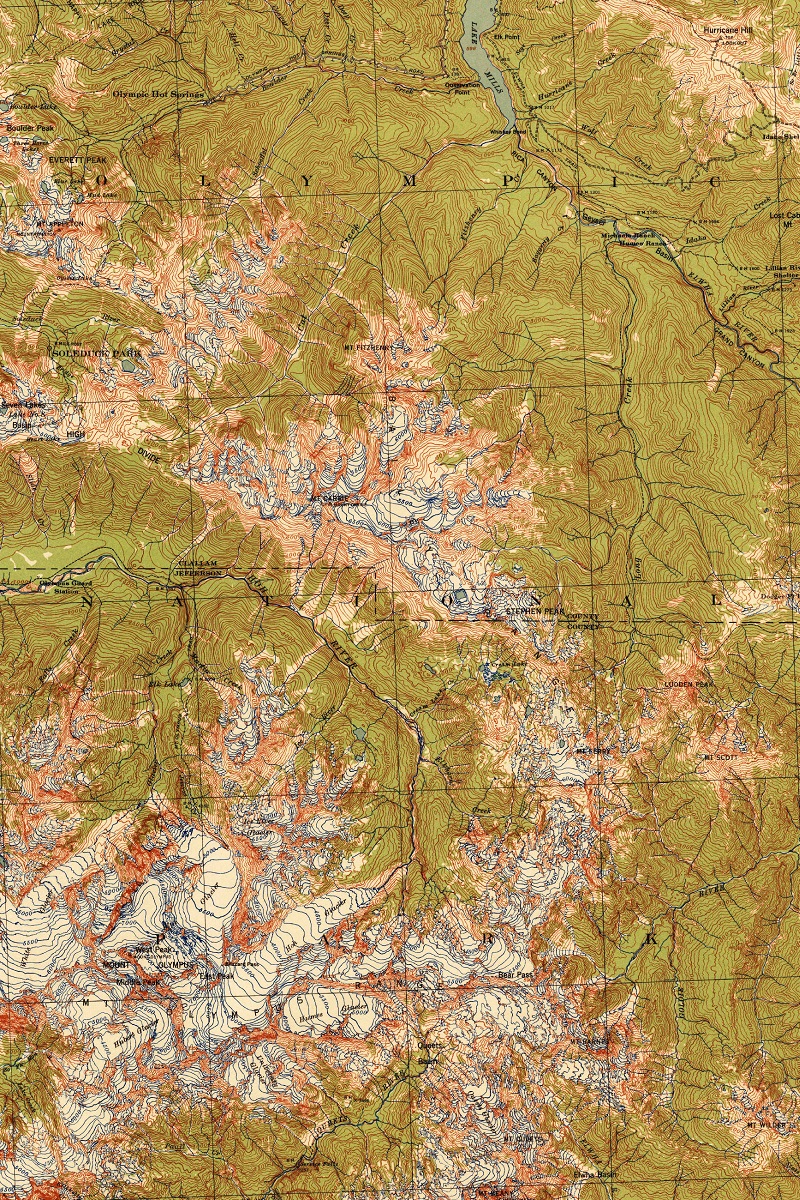
Mount Olympus Washington 1942-USGS Topographic Map
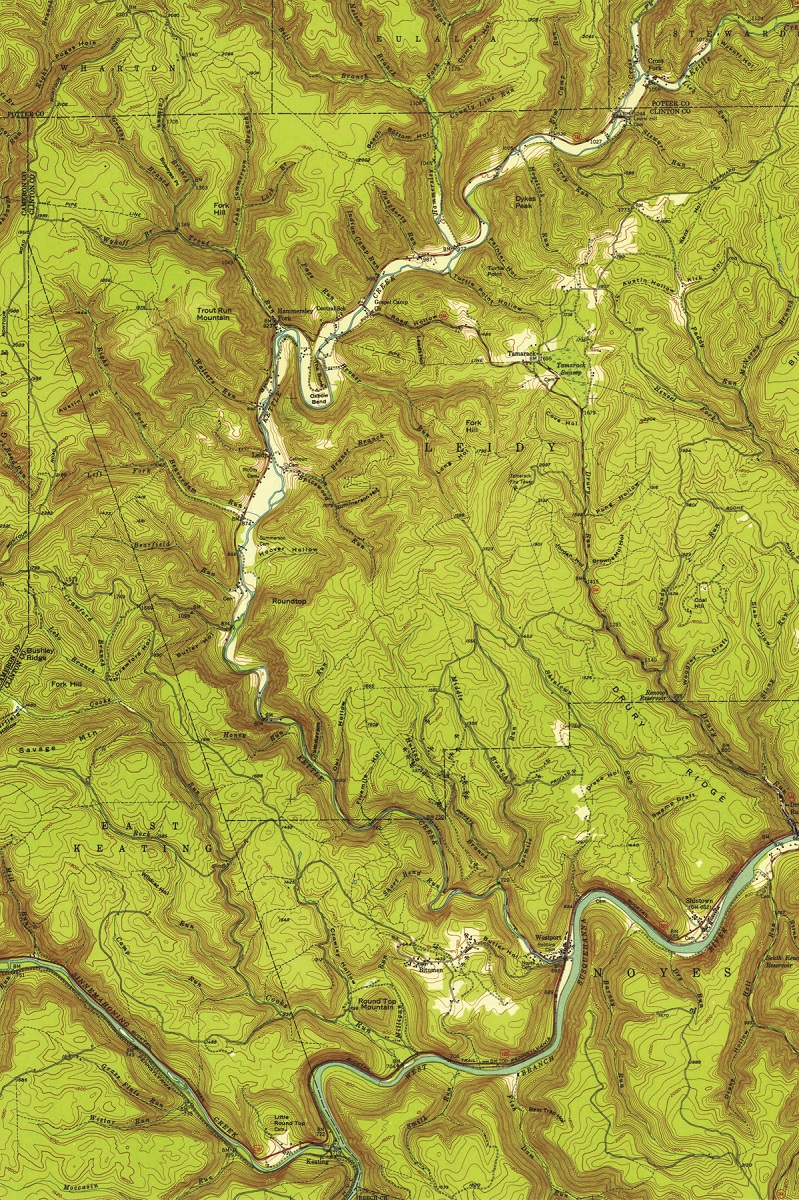
Renovo Pennsylvania 1946-USGS Topographic Map
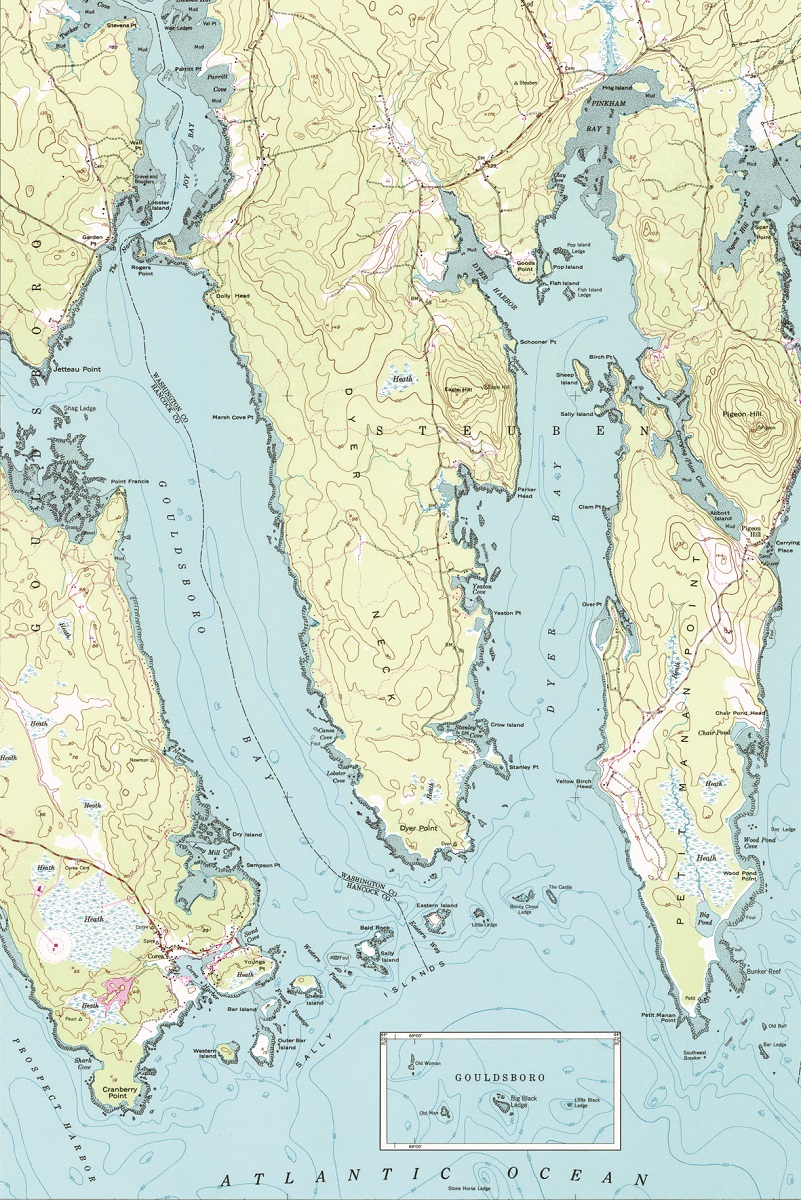
Petit Manan Point Maine 1948-USGS Topographic Map
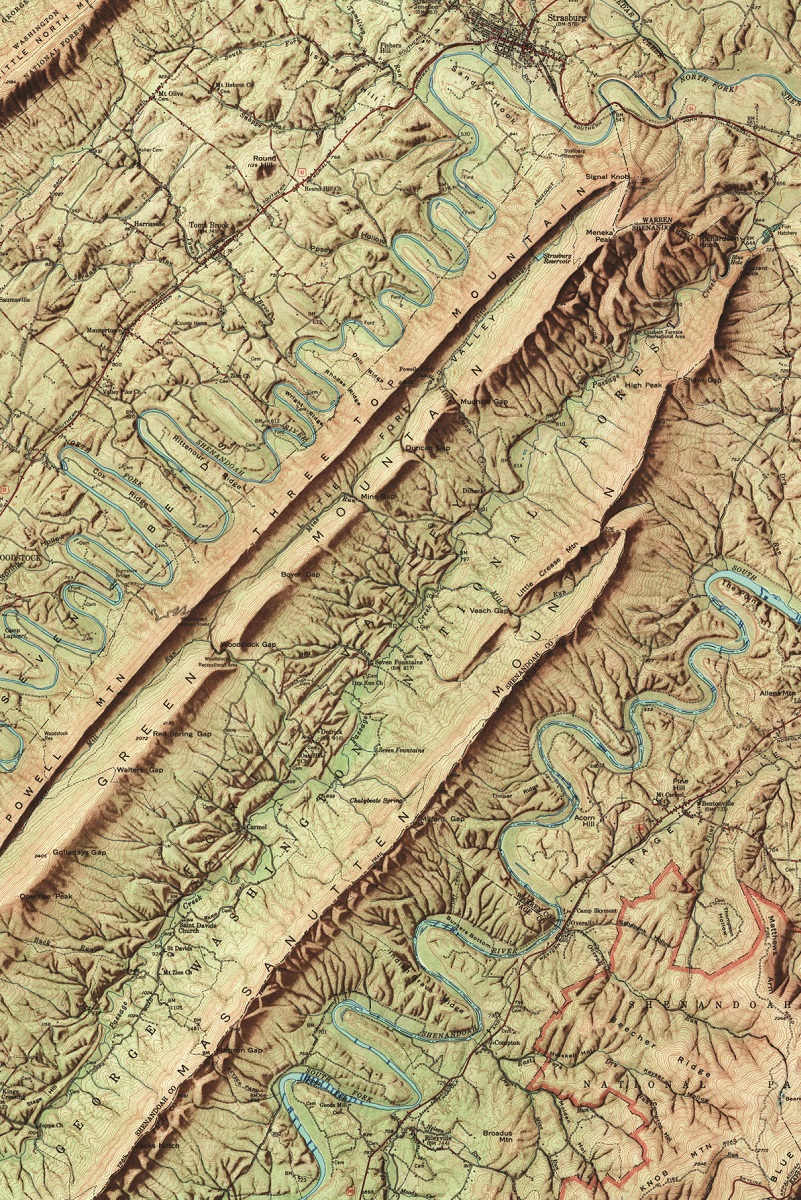
Strasburg Virginia 1947-USGS Topographic Map
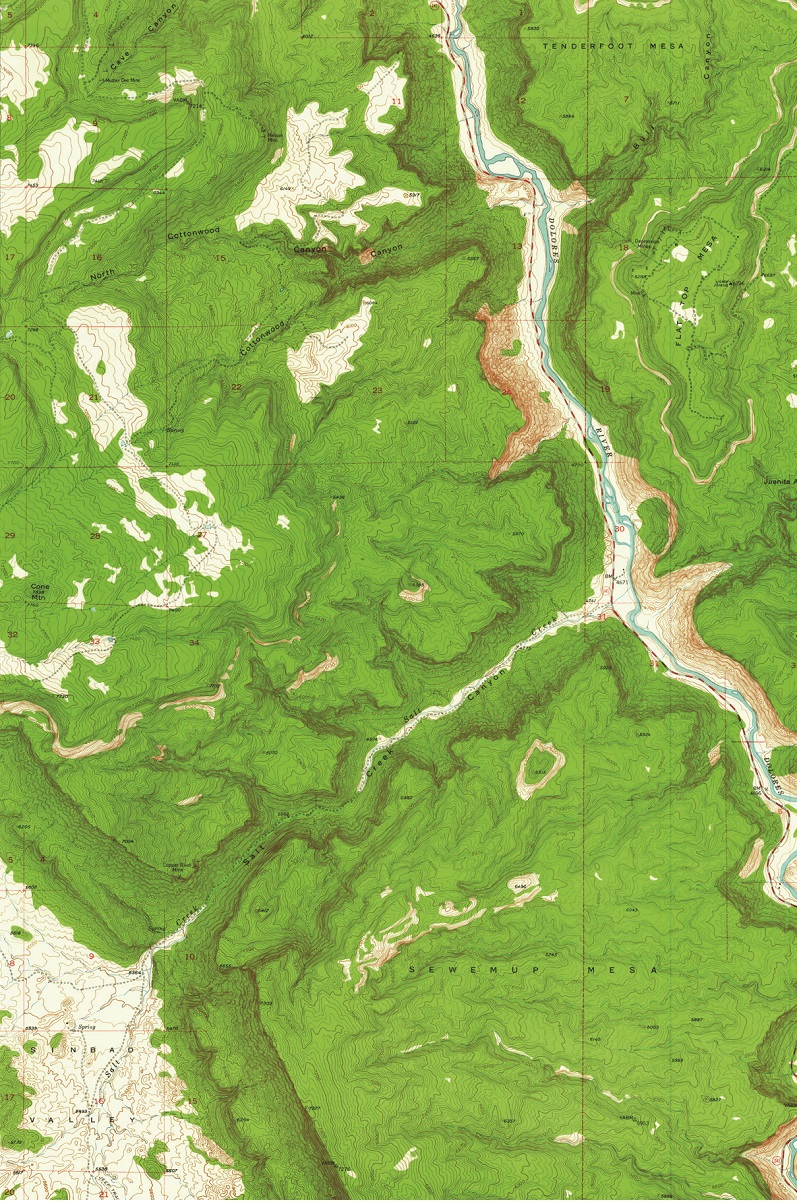
Jaunita Arch Colorado 1960-USGS Topographic Map
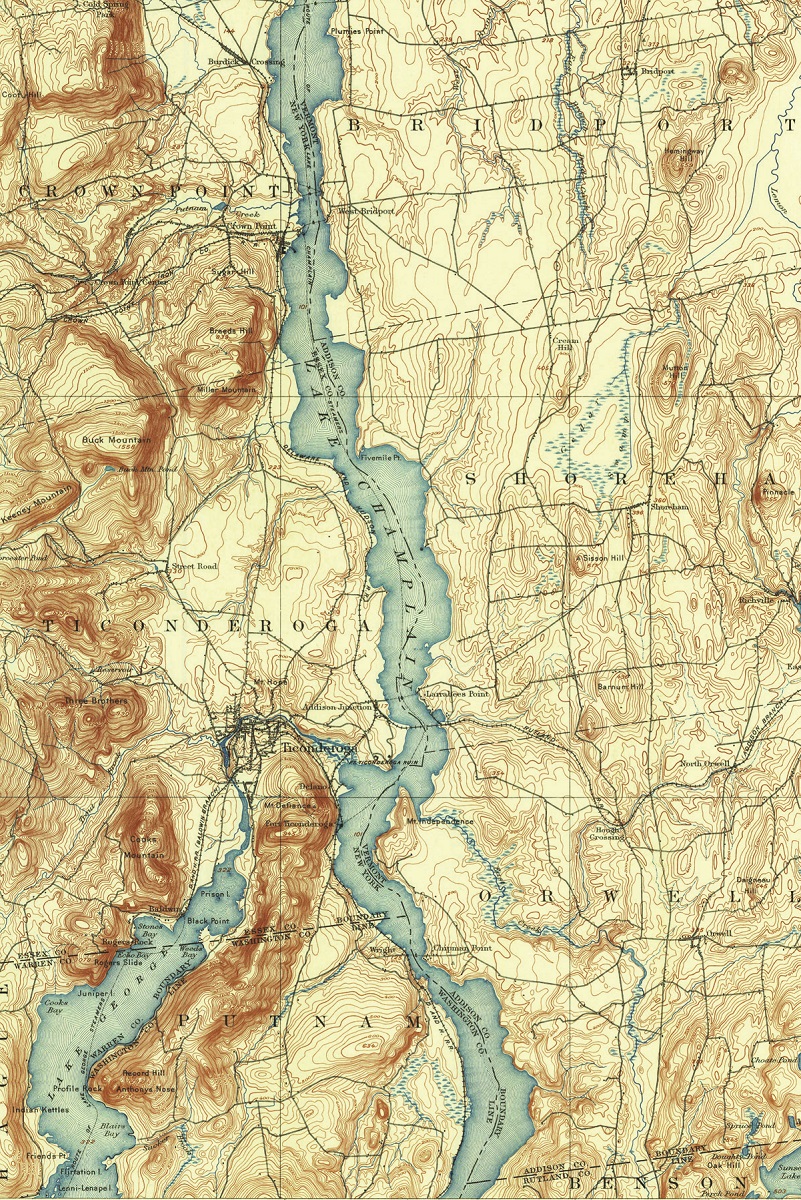
Ticonderoga New York 1894-USGS Topographic Map
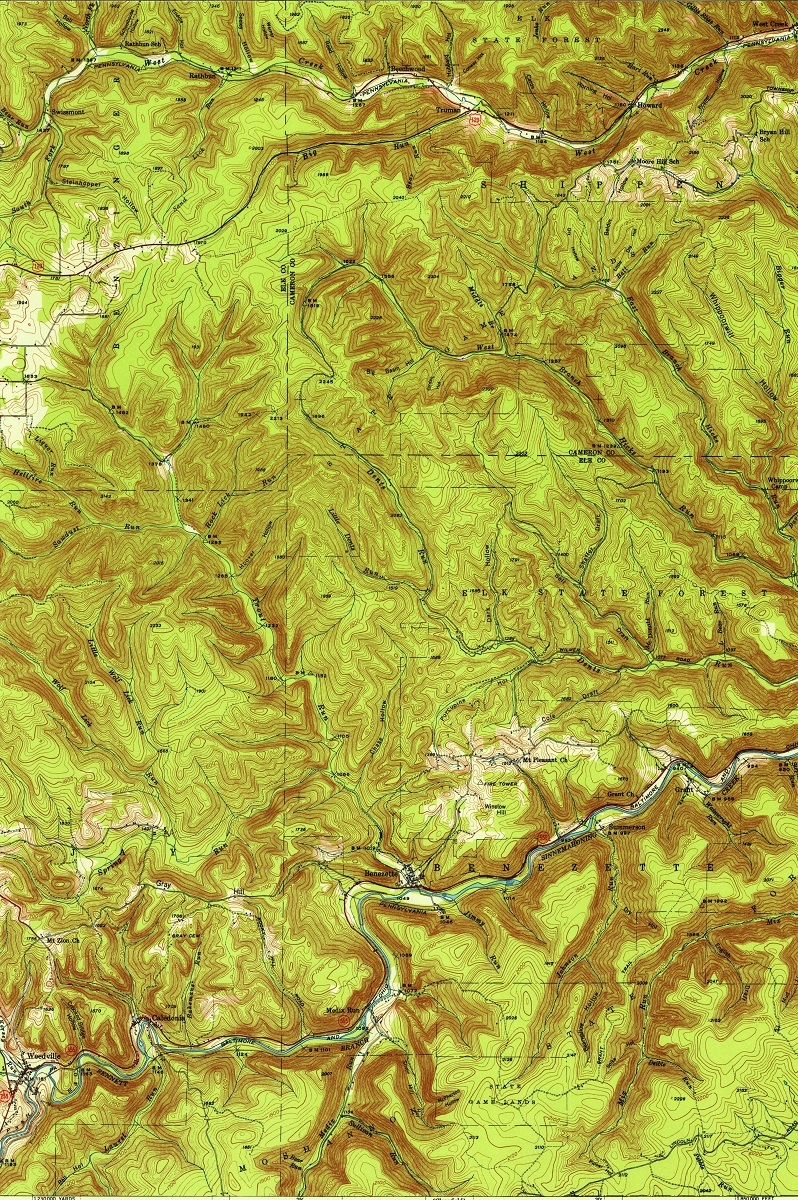
Pennsylvania Civil War Gold-Dent’s Run, Pennsylvania 1941-USGS Topographic Map
Topographical maps are not just about fun and games; they are also about accuracy. In order to be useful for engineering or other precision work, these maps must be as accurate as possible. The creation of these detailed contour maps requires careful surveying of the land, using a combination of ground-based measurements and aerial photography or satellite imagery. The resulting data is then used to create maps with a high degree of accuracy, providing a reliable guide for every adventure.
These topographical maps are not just for outdoor enthusiasts; they are also important tools for scientific research. Geologists, for example, use topographic maps to study the earth’s crust and the processes that shape it, such as erosion and volcanic activity. Similarly, biologists use topographical maps to study the distribution of plant and animal species across different types of terrain. With so much to explore and discover, topographic maps are truly the ultimate guide to the earth’s terrain.
With topographical maps, you can uncover hidden valleys, scale towering mountains, and navigate treacherous terrain with ease. The maps allow you to visualize the world around you in a way that was once impossible, and they offer a wealth of information that can help you make informed decisions about your next adventure. So if you’re looking for the ultimate guide to the earth’s terrain, look no further than topographical maps. With their flexibility, accuracy, and wealth of information, they are the perfect tool for anyone who wants to explore and discover the natural world.
Topographical maps have a wide range of uses and benefits. Here are some of the main ones:
- Navigation: Topographical maps are essential for navigating in the outdoors, whether you’re hiking, camping, or mountaineering. They provide a detailed picture of the terrain, including the elevation, slope, and natural features, making it easy to plan your route and avoid hazards.
- Engineering: Topographical maps are also used extensively in engineering projects, such as building roads, bridges, and dams. They provide crucial information about the land, such as the elevation and slope, which is essential for designing structures that are safe and functional.
- Environmental studies: Topographical maps are used by environmental scientists to study the natural environment, including vegetation, geology, and hydrology. They provide valuable information about the terrain, which is essential for understanding and managing natural resources.
- Military planning: Topographical maps are used extensively by the military for planning operations, as they provide detailed information about the terrain and its features. They are also used for navigation and reconnaissance.
- Scientific research: Topographical maps are used by scientists in a variety of fields, including geology, biology, and archaeology. They provide detailed information about the land, which is essential for studying the natural environment and its history.
The benefits of topographic maps are numerous. Here are some of the key ones:
- Accurate representation of the land: Topographical maps provide an accurate representation of the land, including its elevation, slope, and natural features. This information is essential for a wide range of activities, from navigation to scientific research.
- Flexibility: Topographical maps can be used at different scales, from large-scale maps that show individual buildings to small-scale maps that cover entire countries. This makes them useful for a wide range of applications, from planning a back-country hike or design new roads.
- Easy to read: Topographical maps are designed to be easy to read and understand, with clear symbols and labeling. This makes them accessible to a wide range of users, from outdoor enthusiasts to scientists and engineers.
- Historical information: Topographical maps provide a record of the land and its features over time. This information can be used to study changes in the environment, such as erosion, volcanic activity, and the distribution of plant and animal species.
Overall, topographic maps are a valuable resource for anyone who wants to explore and understand the natural world. Their accuracy, flexibility, and wealth of information make them an essential tool for a wide range of activities, from navigation and outdoor recreation to scientific research and engineering projects.
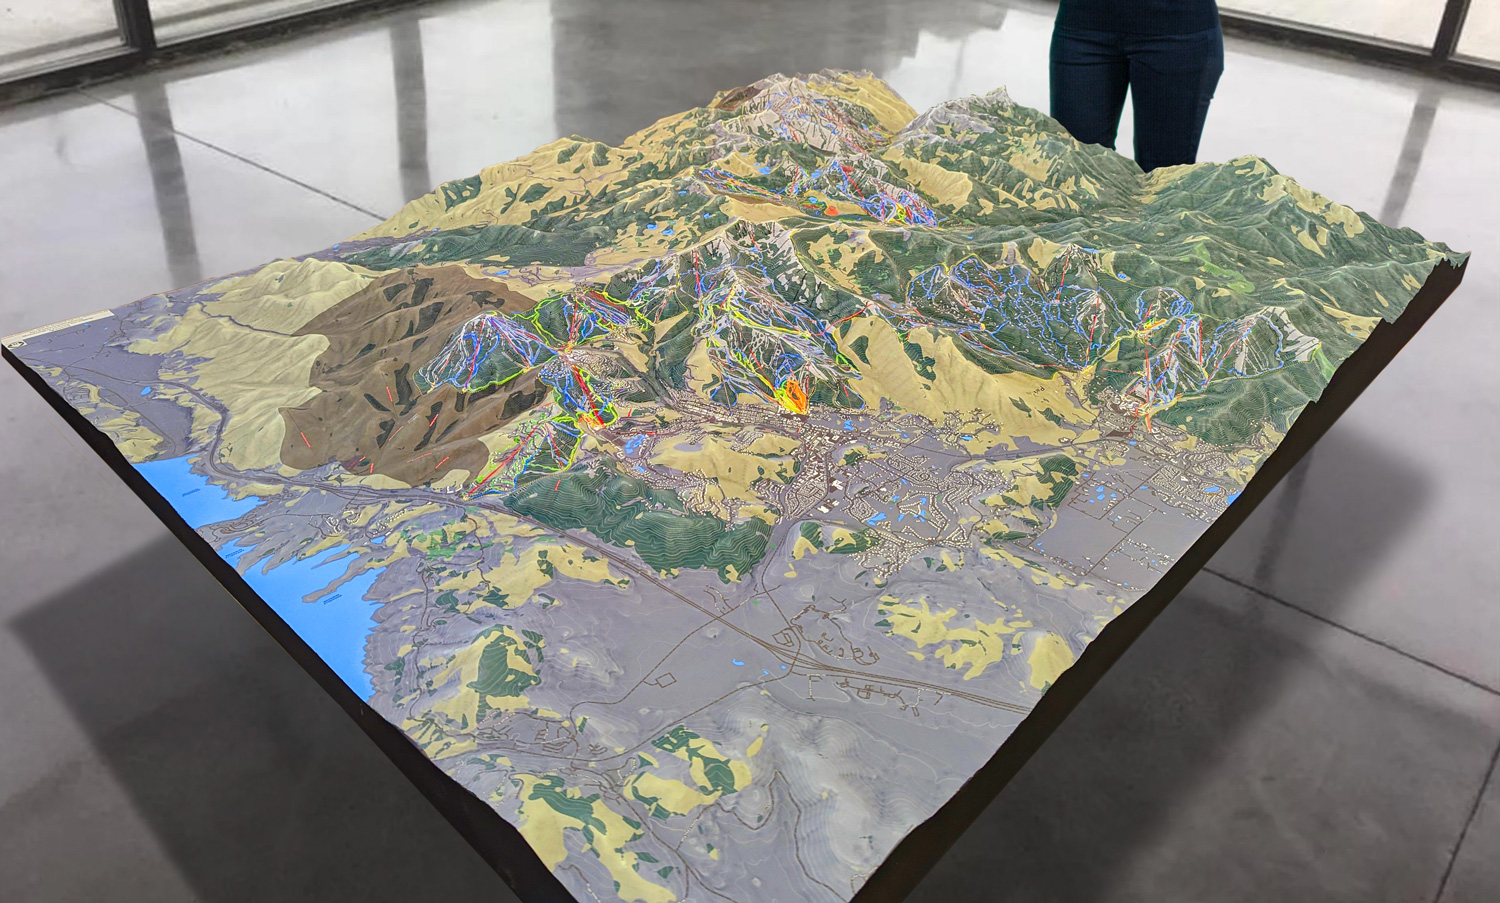
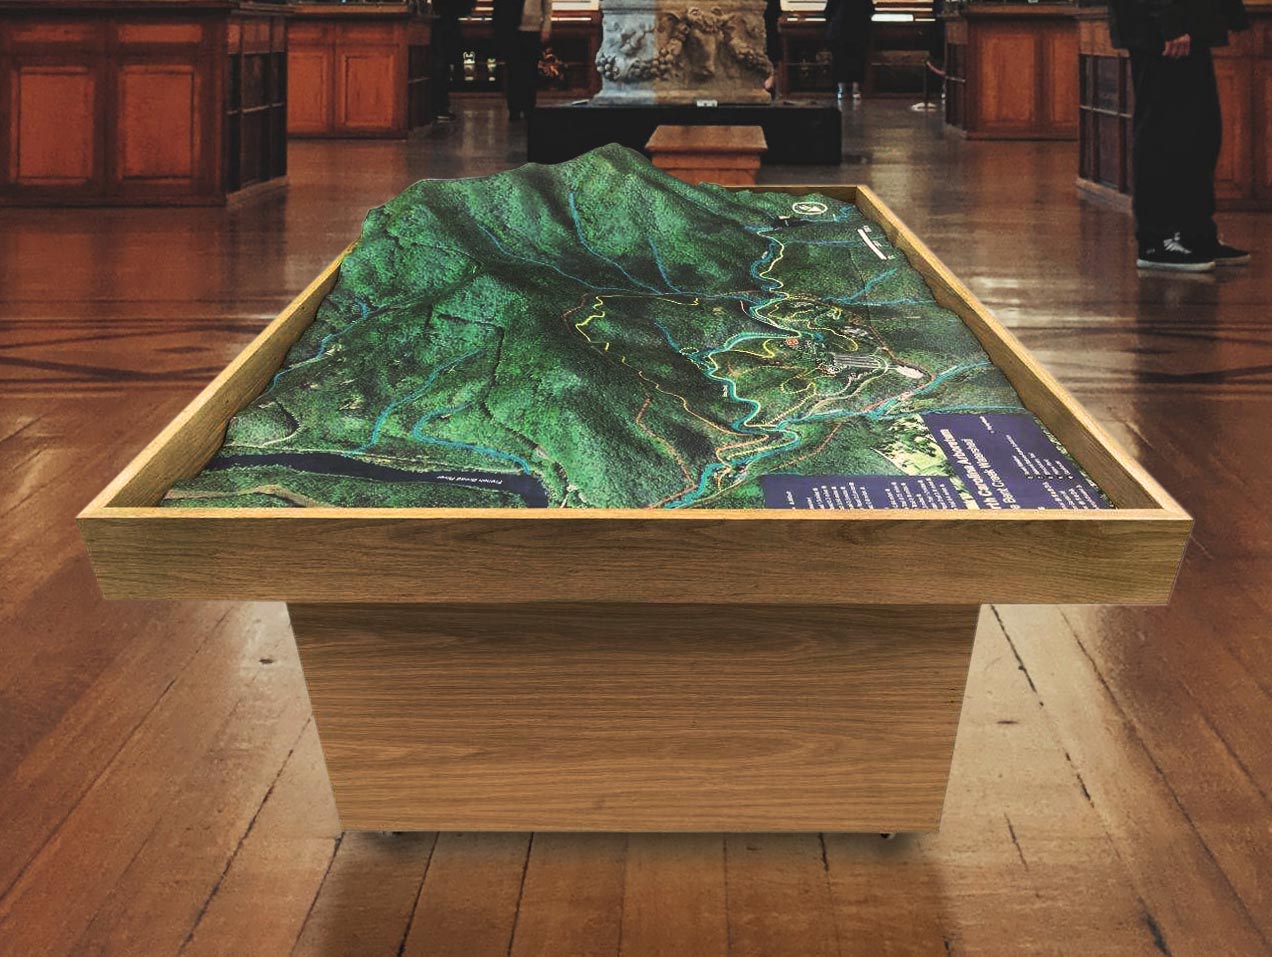
Our high-quality maps and models are on display at museums, national parks, university campuses, sports facilities, hospitals, and research organizations worldwide. One of our more recent raised relief projects was of the Great Smoky Mountains National Park and the surrounding area. This large raised relief map covered over 1.2 million acres in a 91″ x 56″ frame.
We meld top-of-the-line technologies with professional cartography resources to create stunning raised relief terrain maps and models. Our expertise in 3D printing enables us to allow more markets to benefit from purchasing durable, portable, and affordable models.
Gallery of Custom Topographical Projects
Gallery of eCommerce Topographical Maps
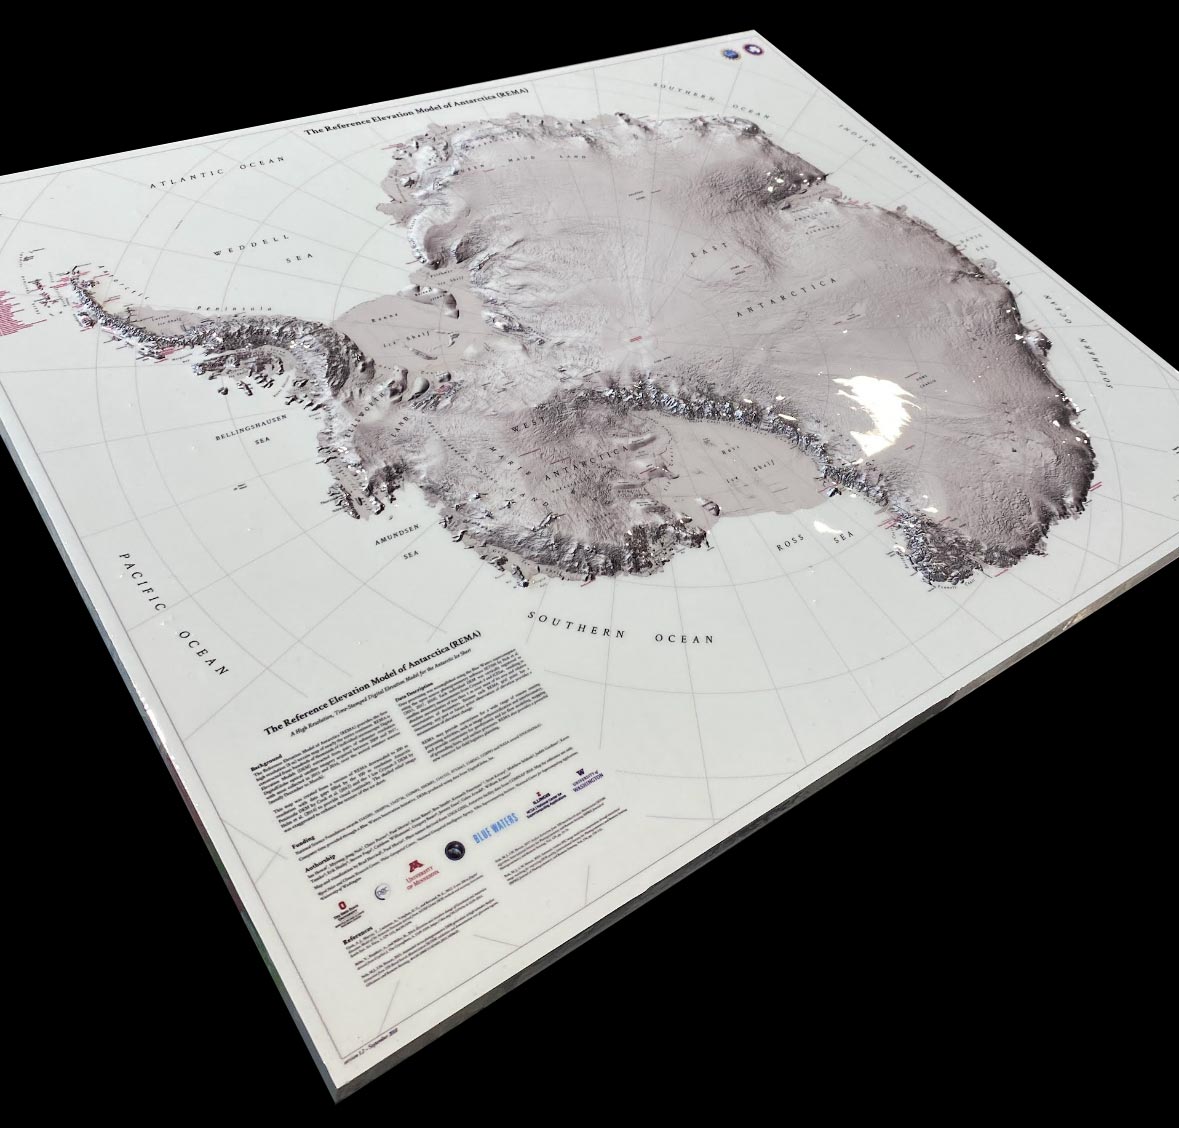
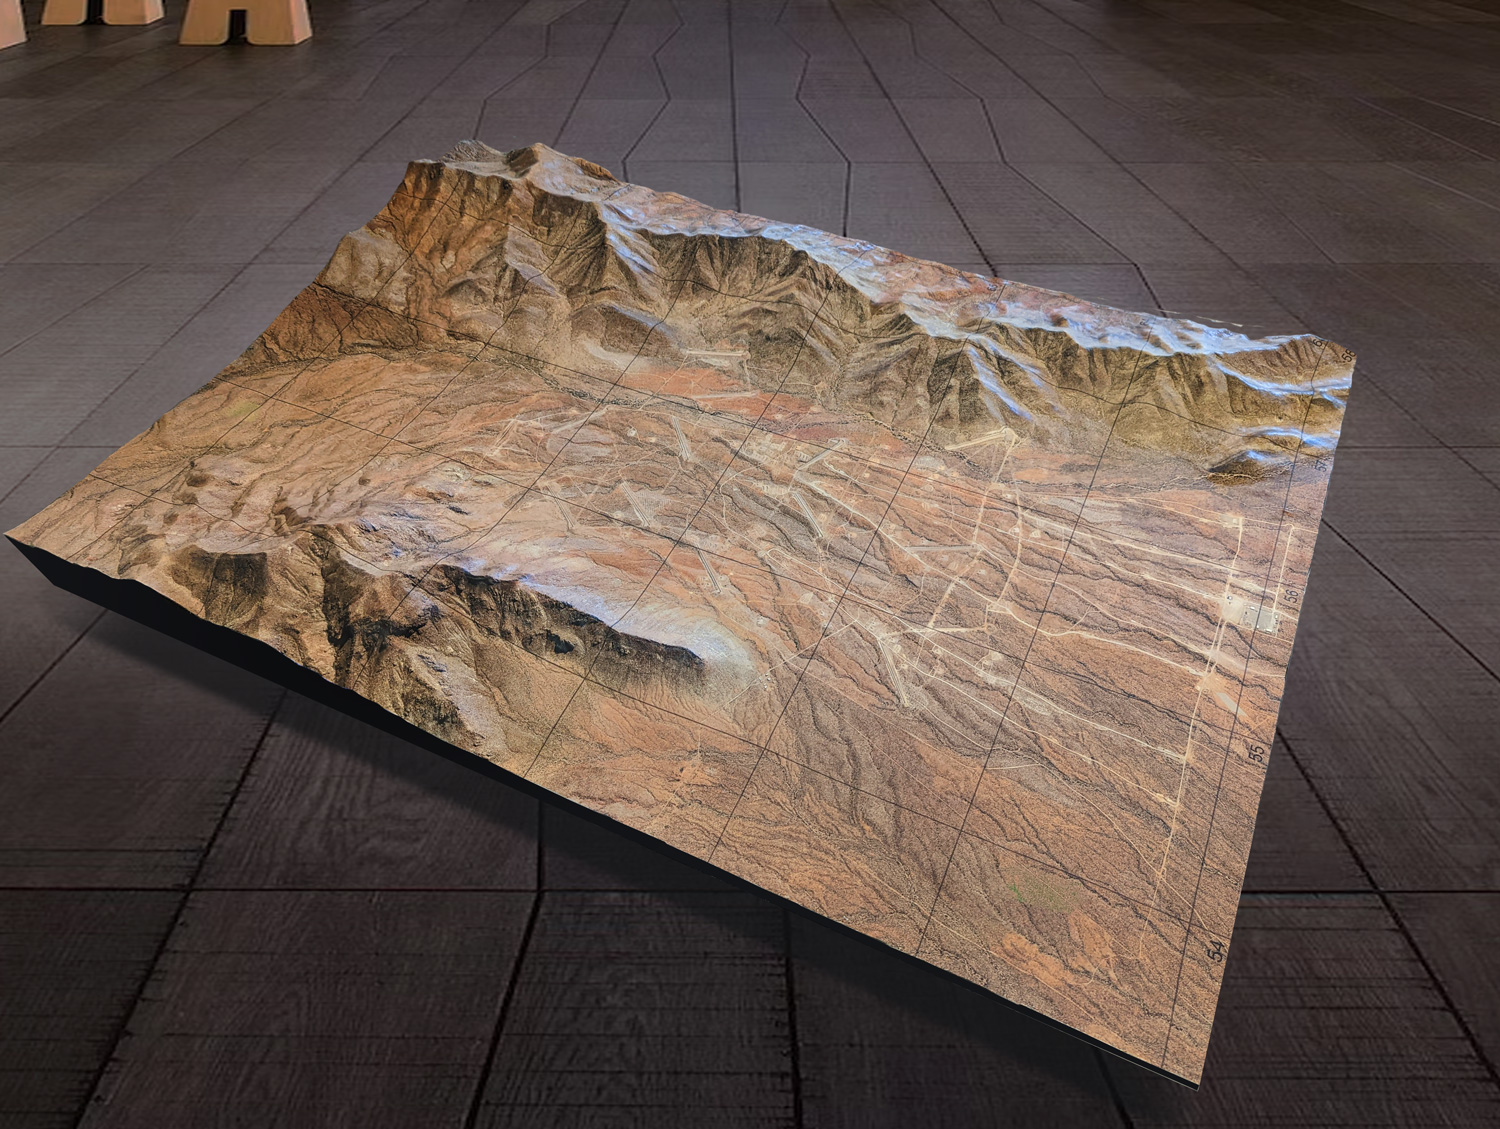
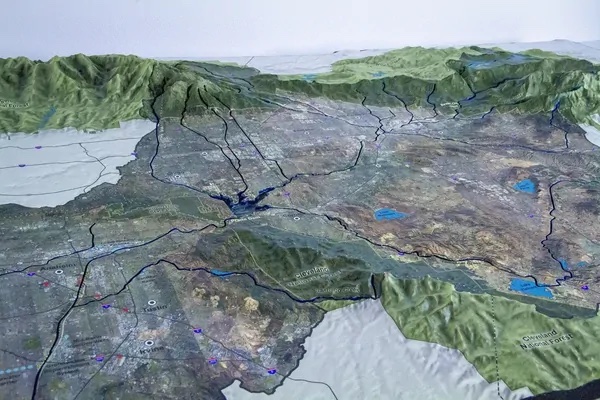
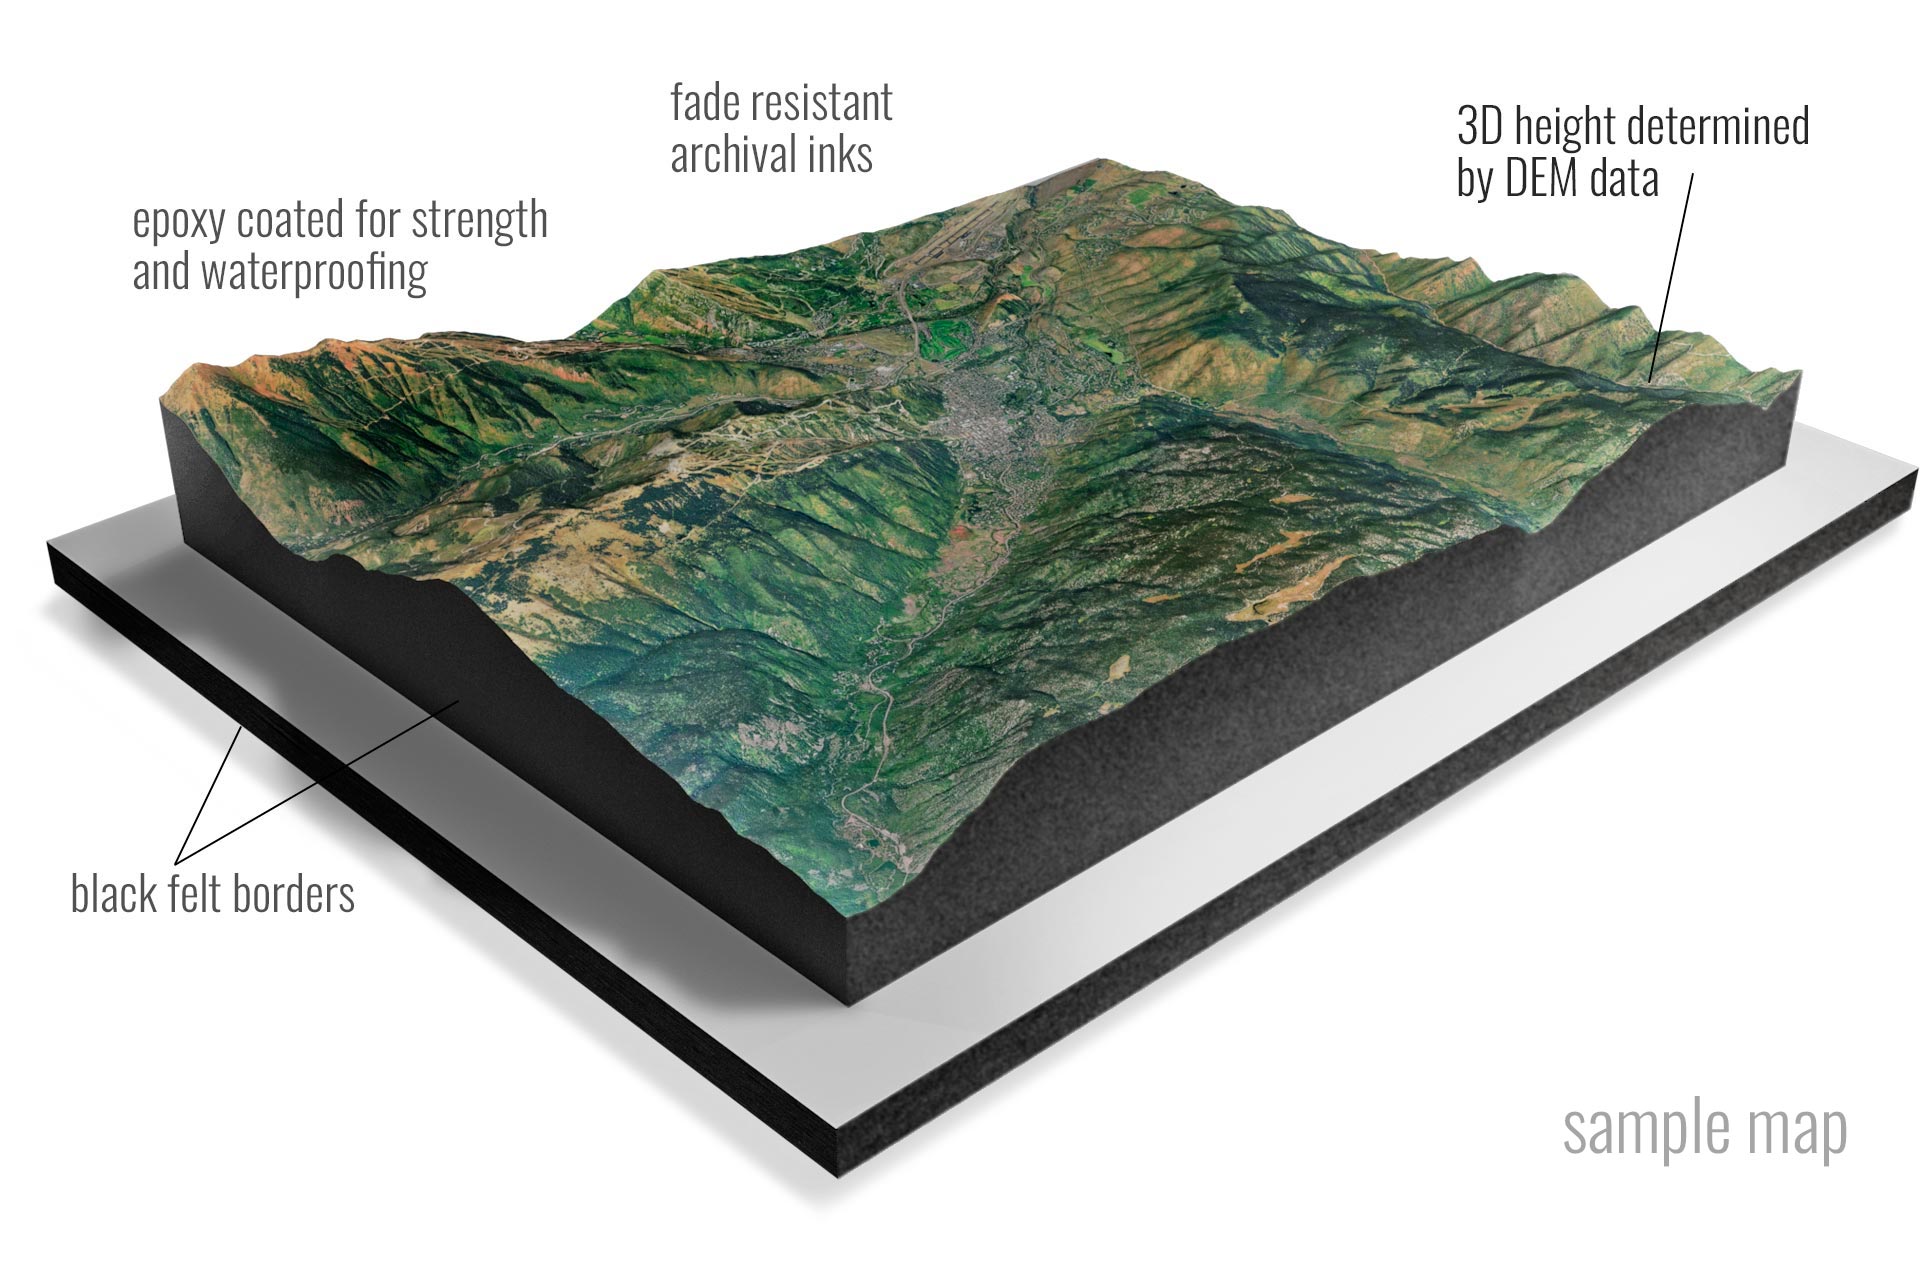
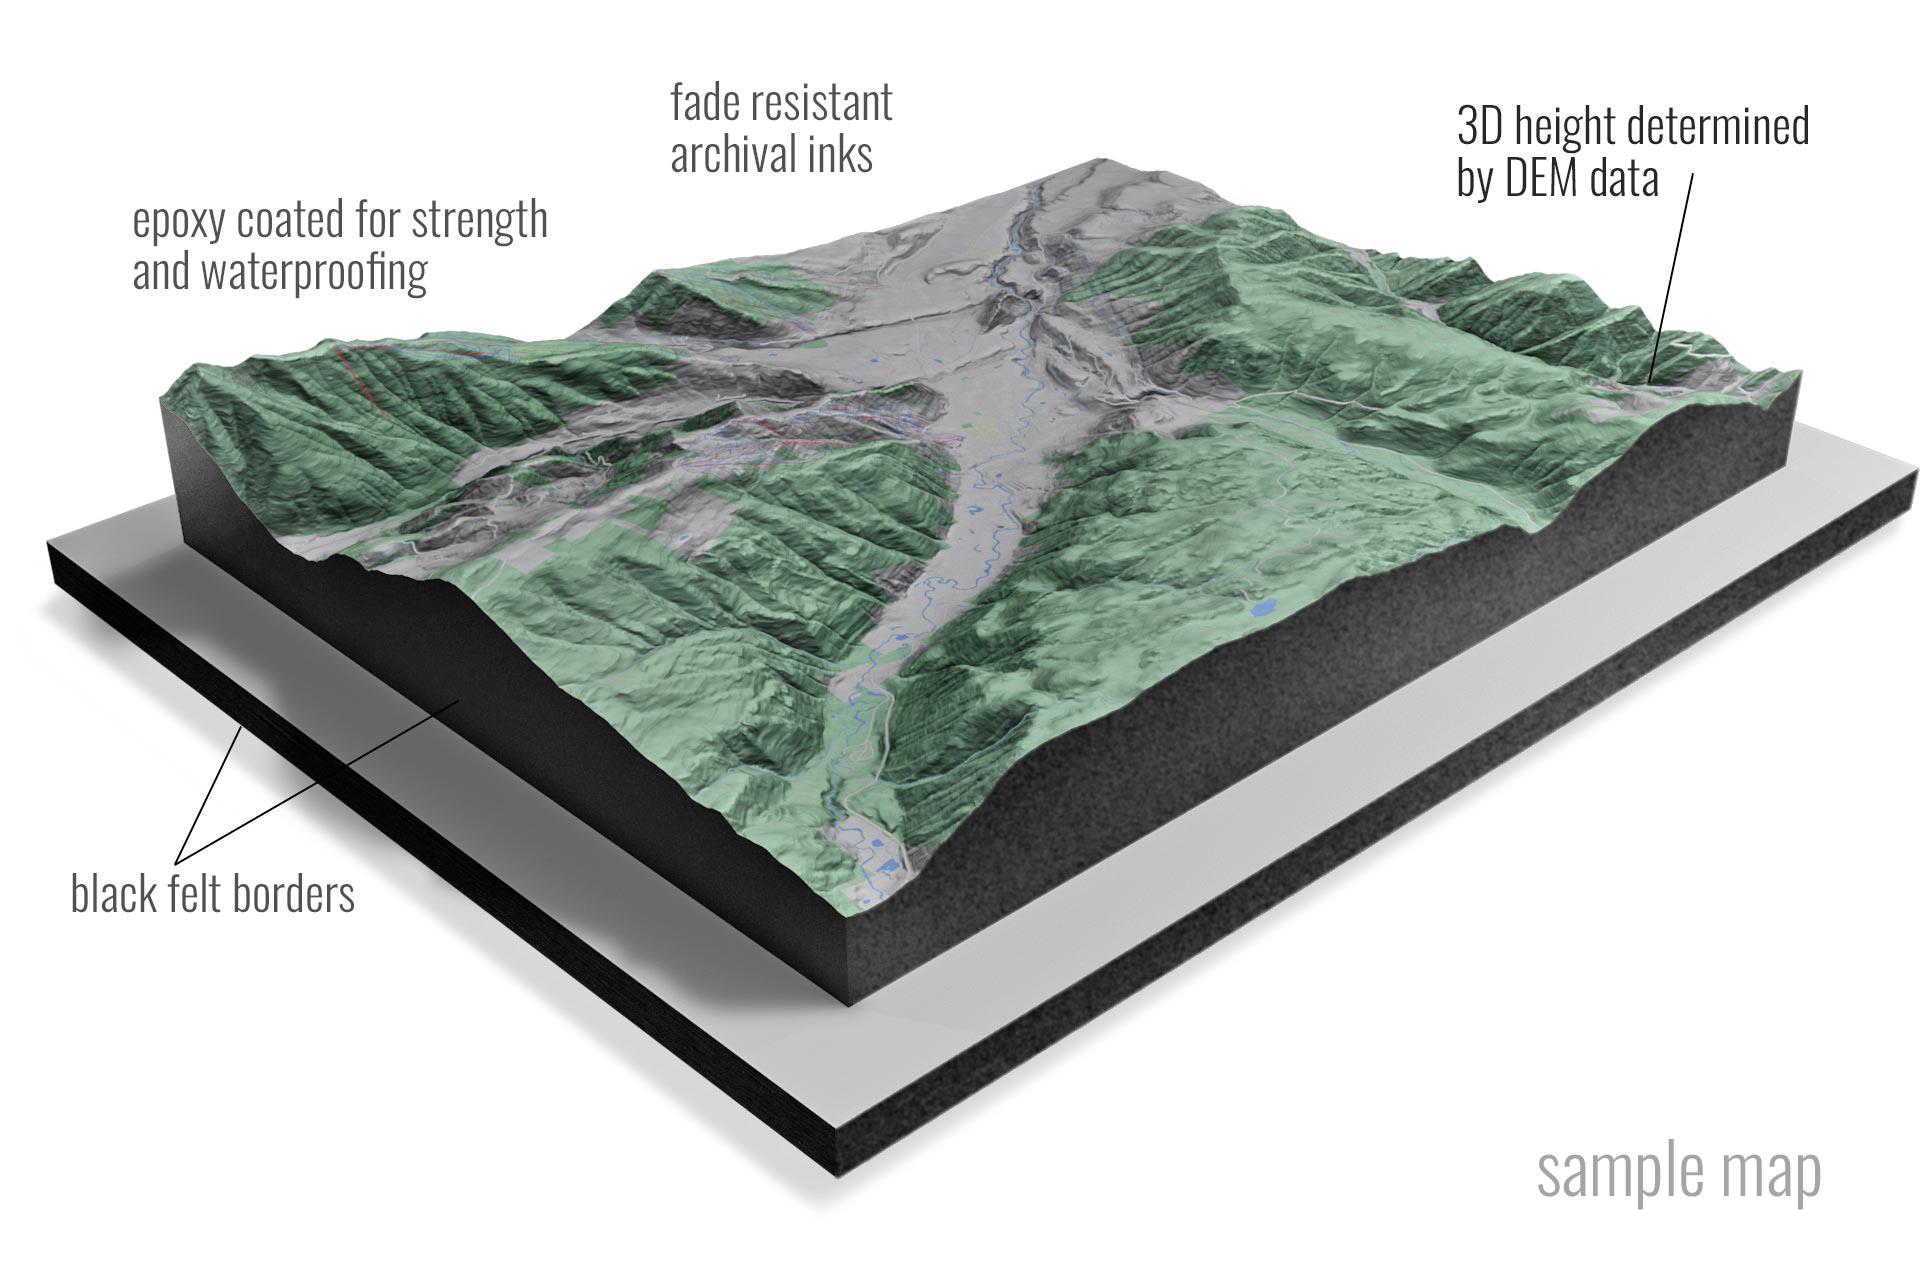
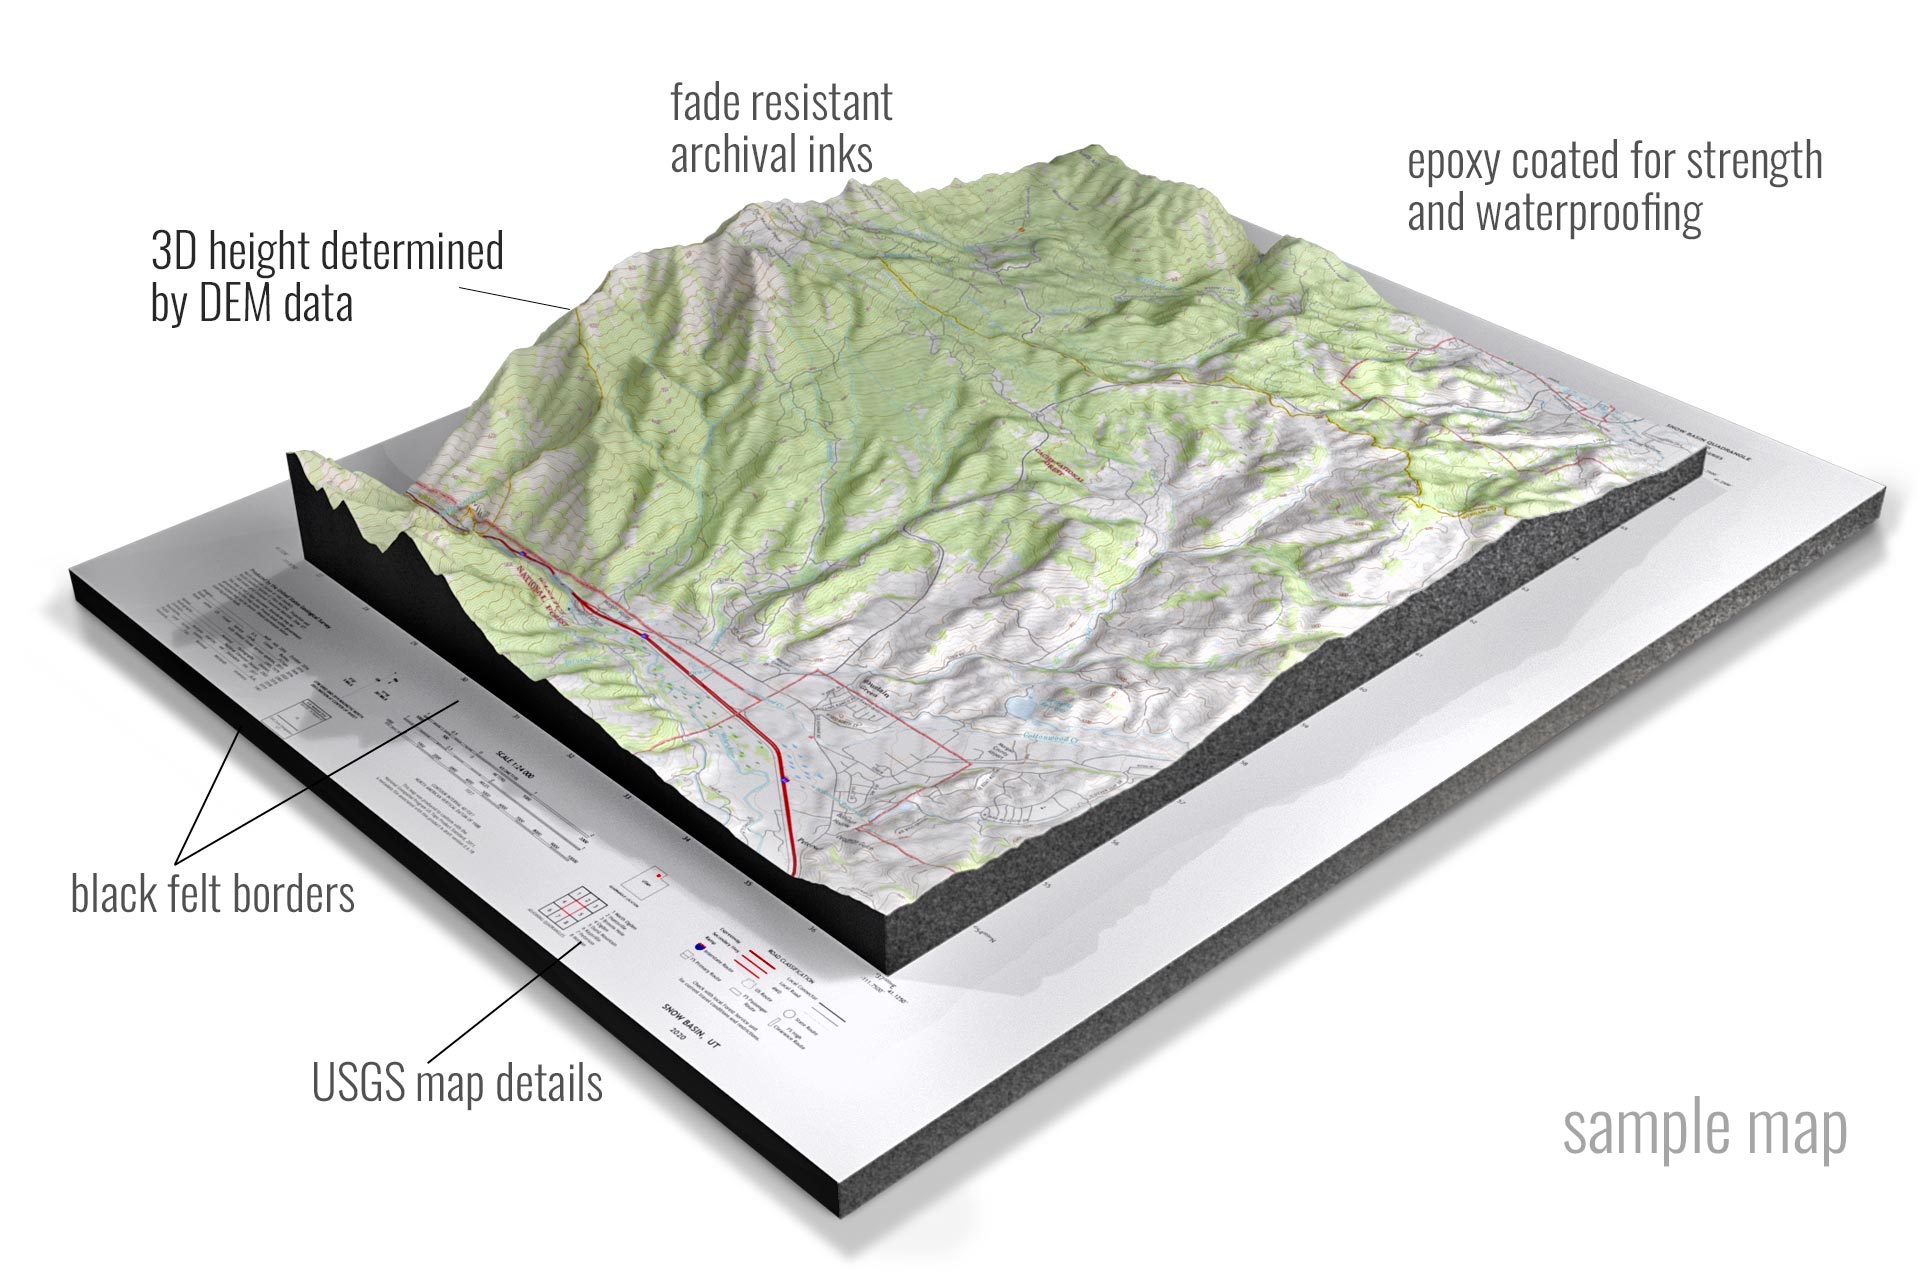
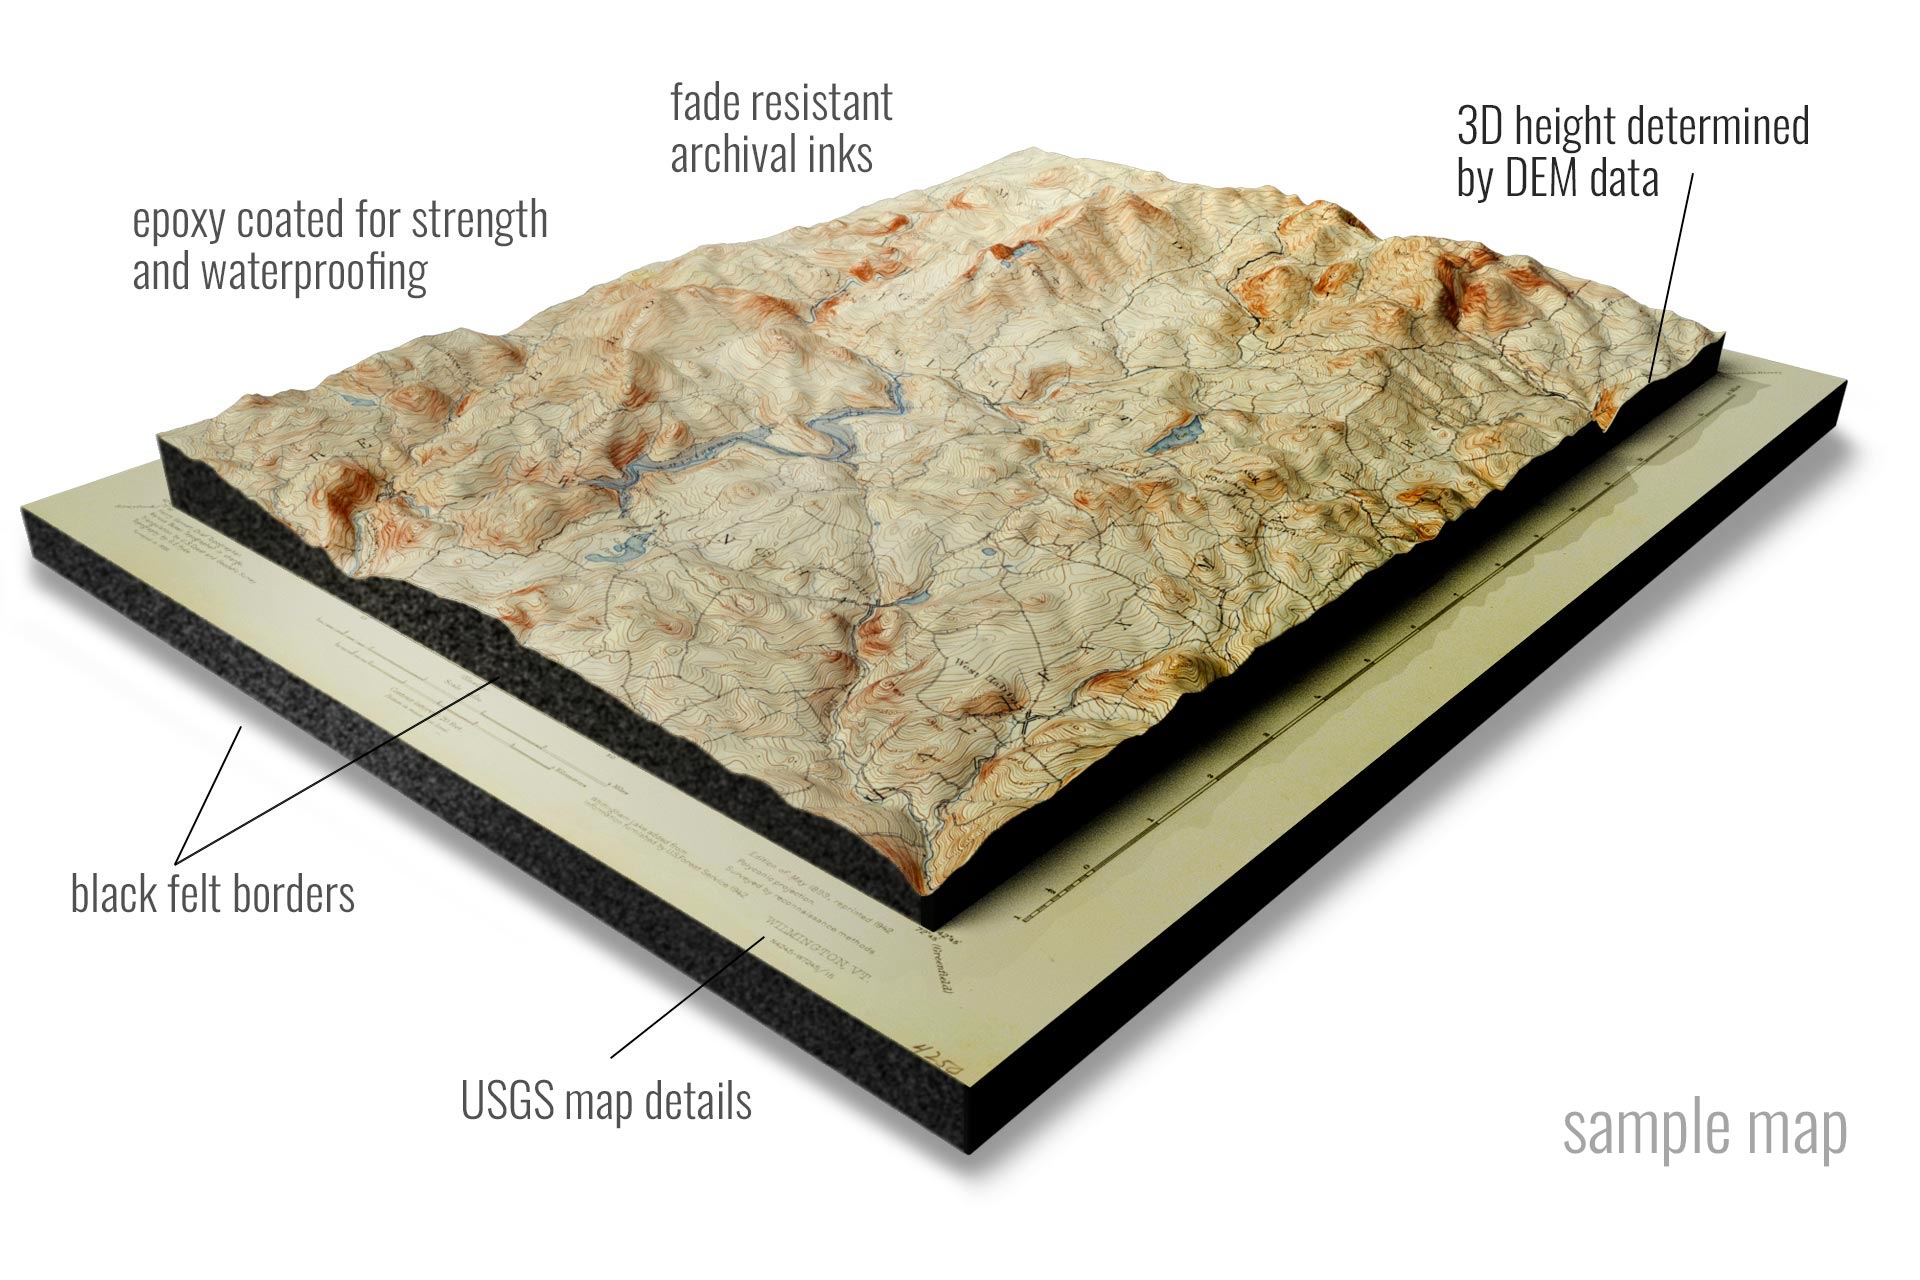
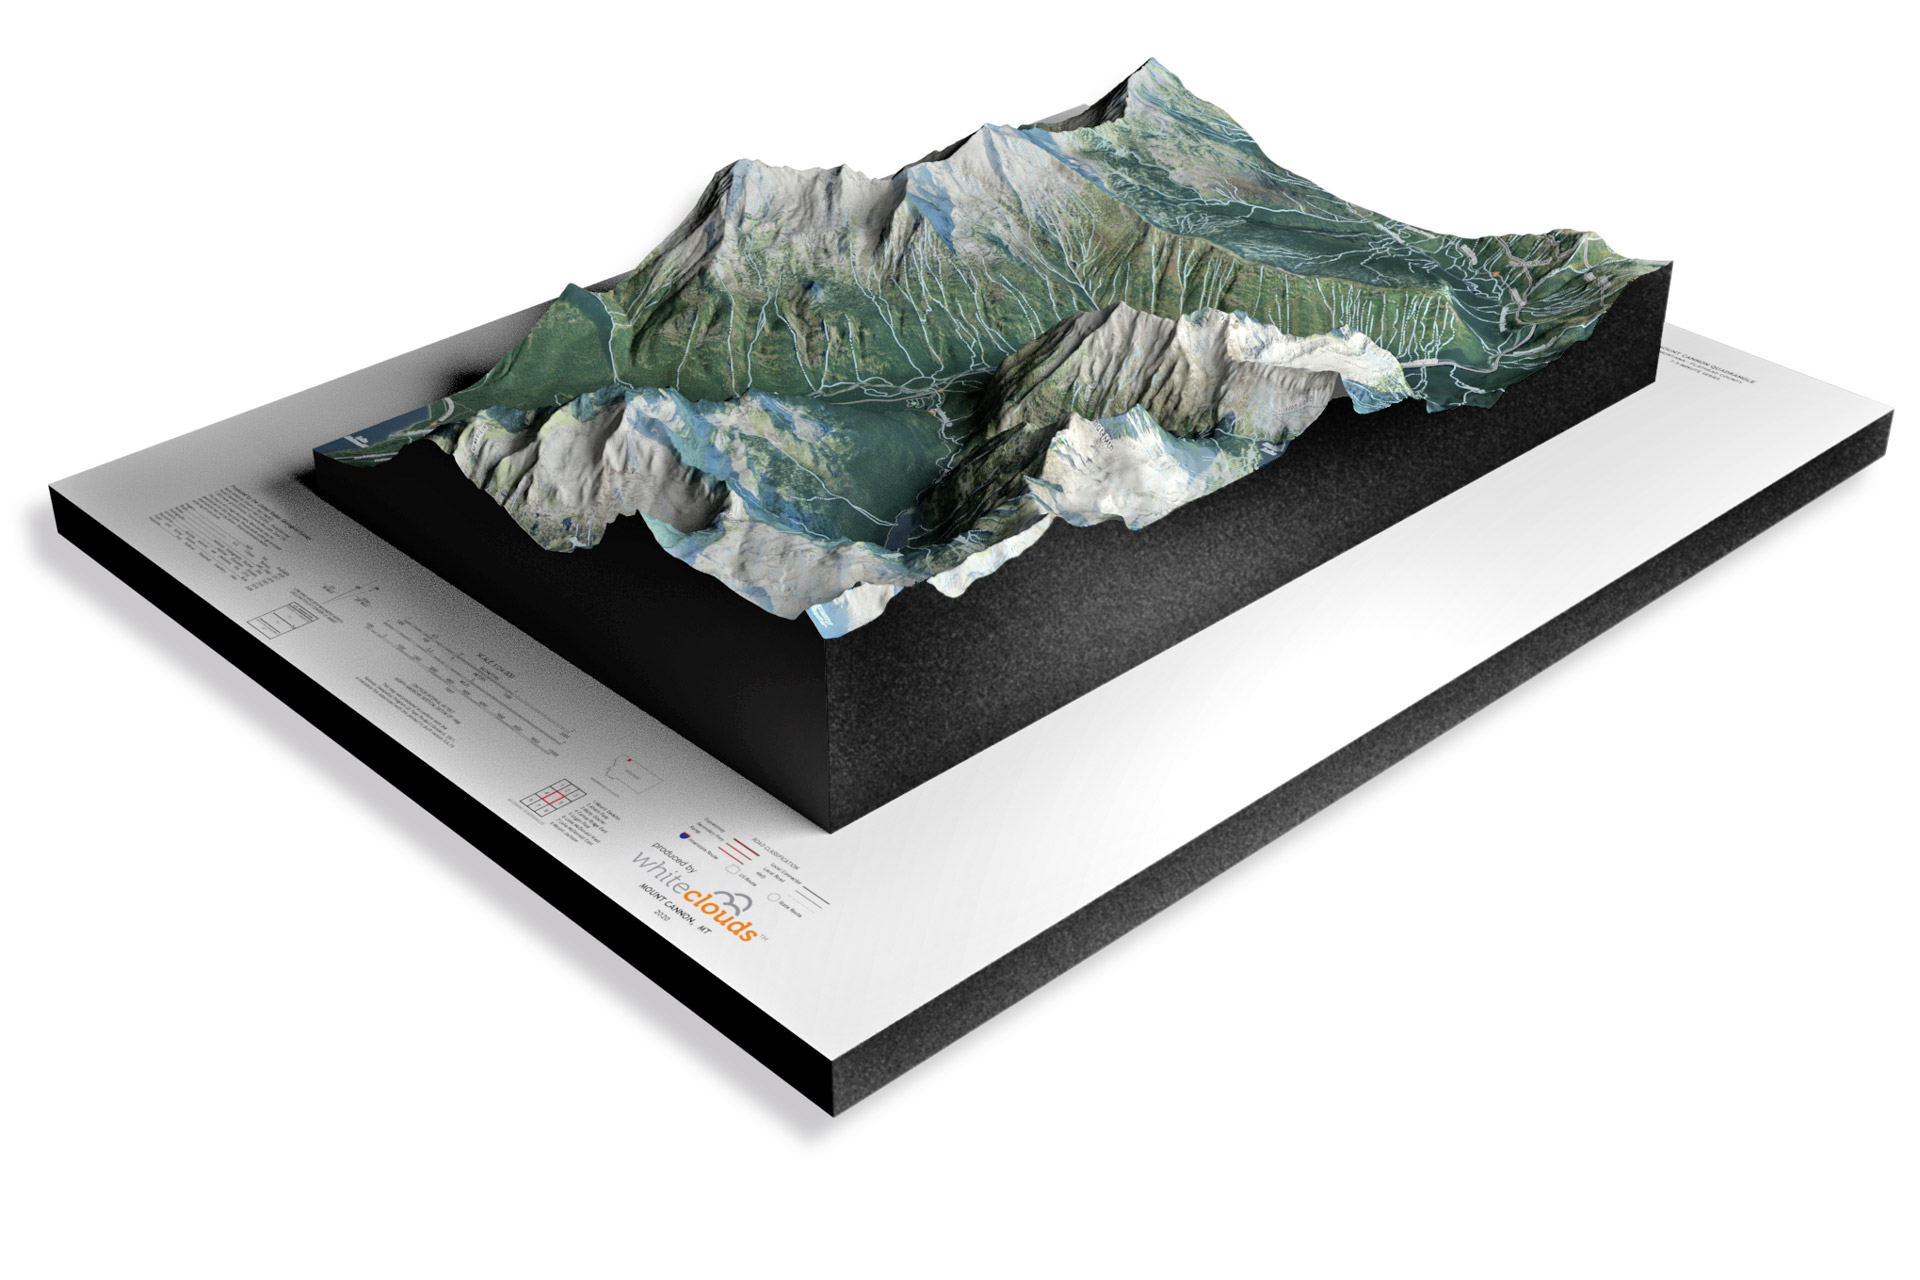
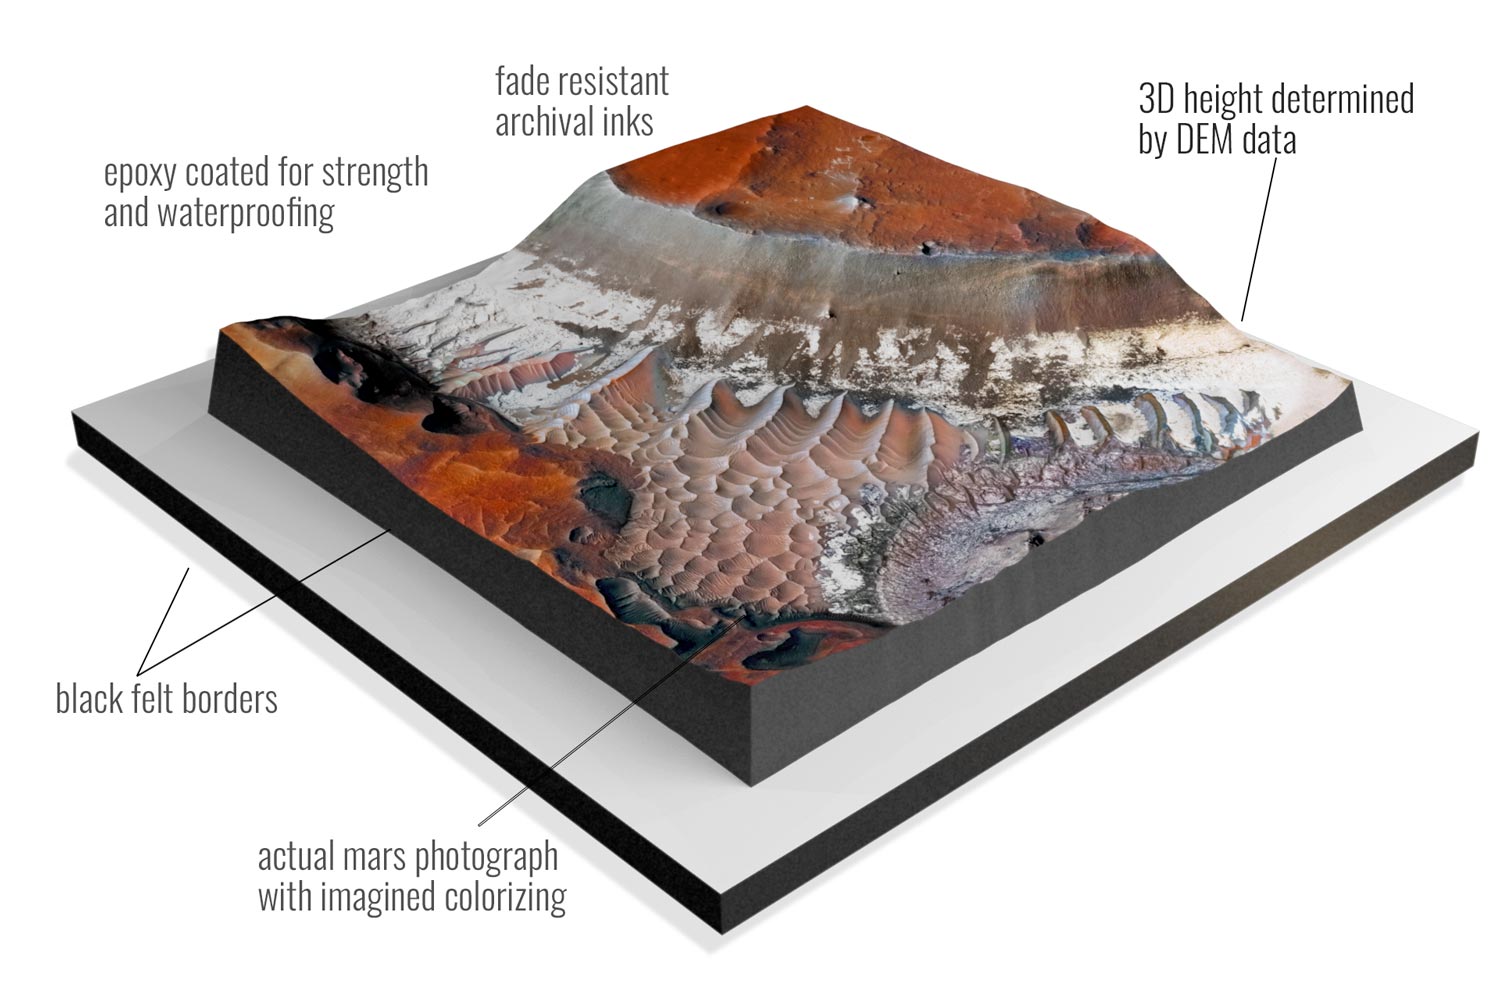
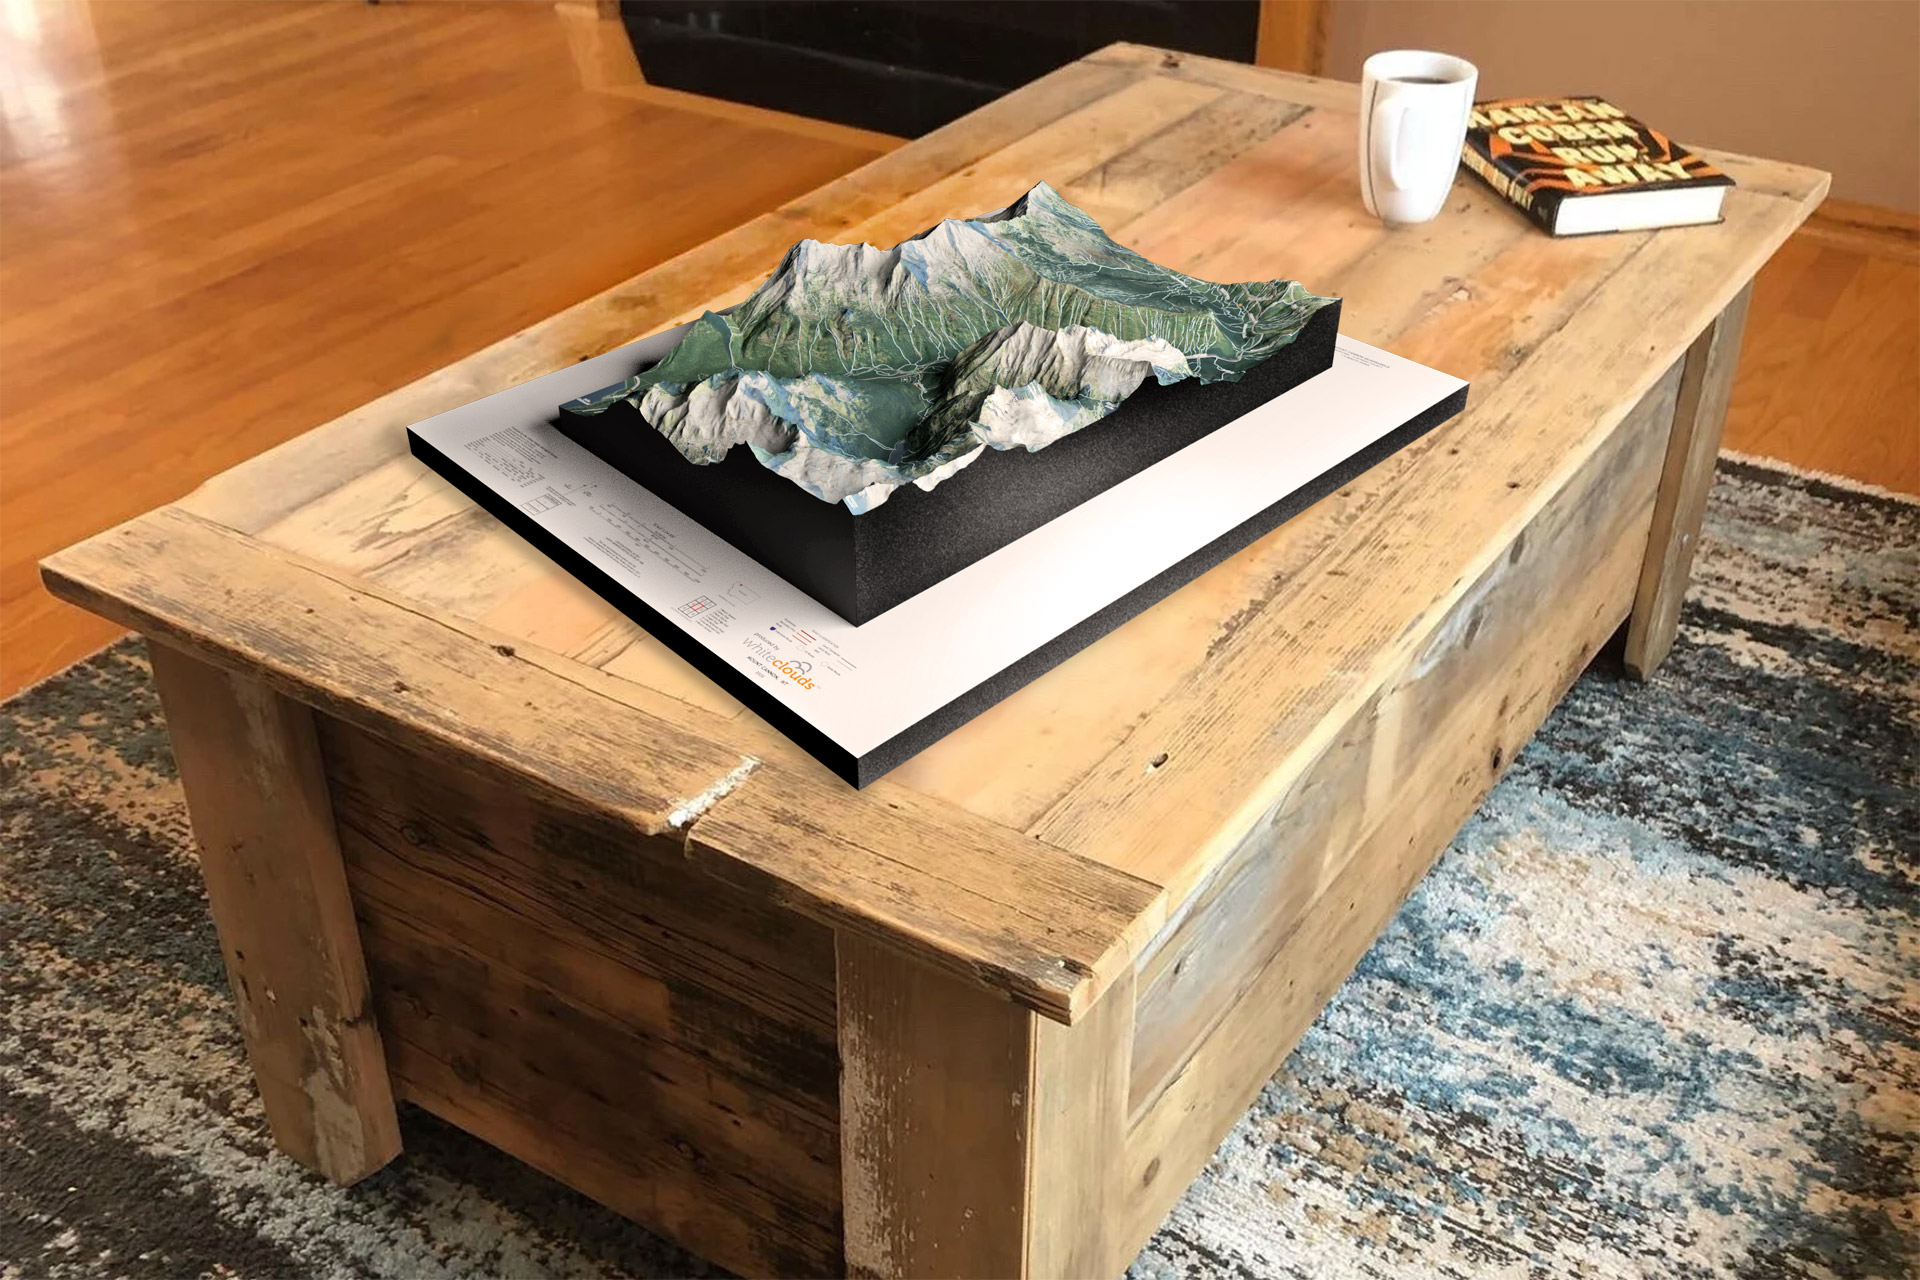
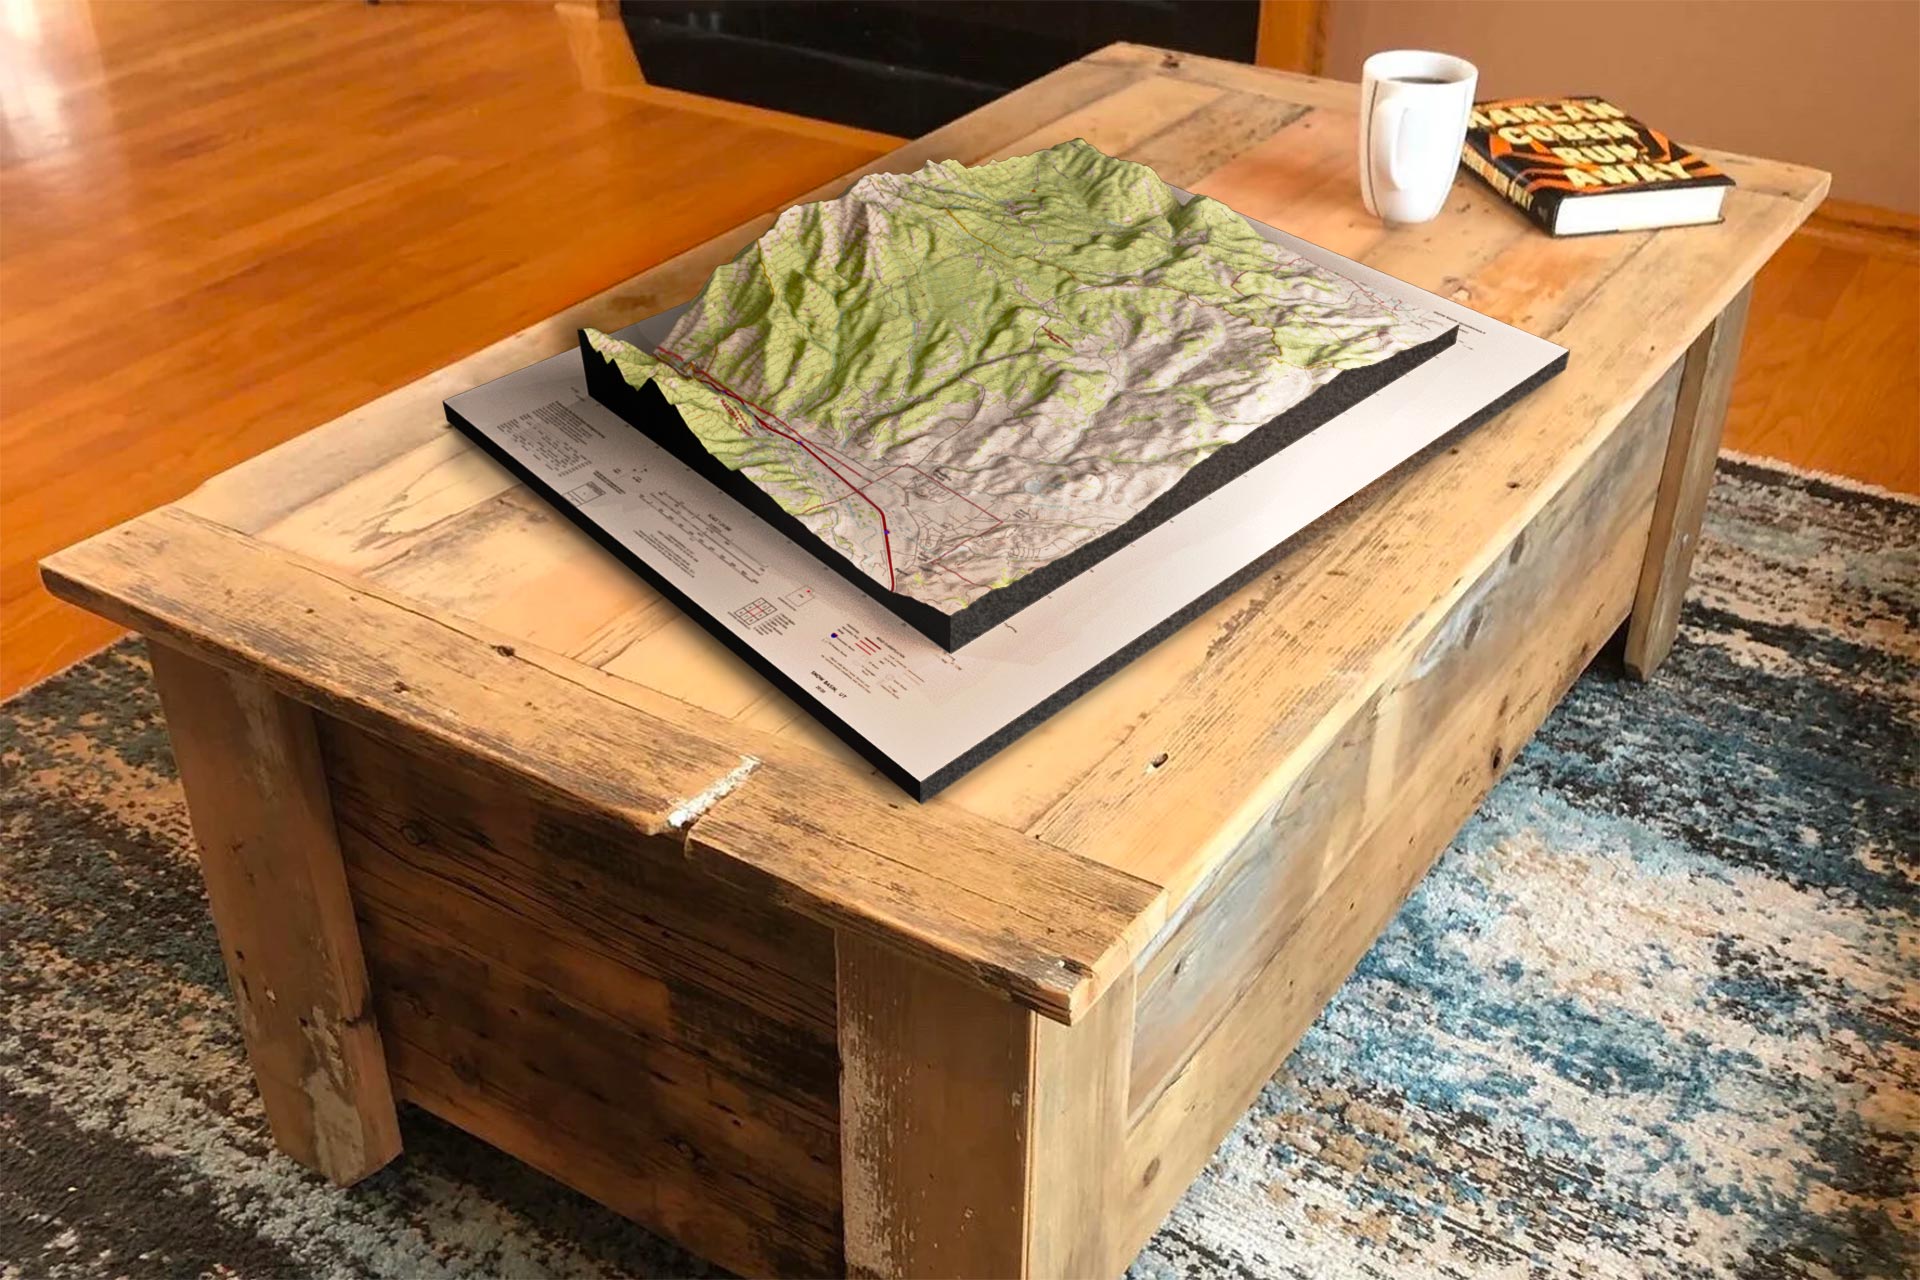
Shop WhiteClouds 3D Topographical Raised Relief Maps with 557,622 three-dimensional maps to choose from. These maps are not flat. They are three-dimensional, with the height being determined by Digital Elevation Model (DEM) data. These 3D maps are built by combining satellite imagery data from the USGS, Google Earth, Google Maps, and DEM data. Make a statement with these beautiful 3D map images from every part of the United States.
How Topographical Maps are Made
There are several techniques used to create topographical maps, and the process can vary depending on the scale and complexity of the map. However, the basic steps involved in making a topographical map are as follows:
- Create a base map. The first step in making a topographical map is to create a base map of the area. This can be done using imagery from a standard two-dimensional map, aerial photographs, or satellite images.
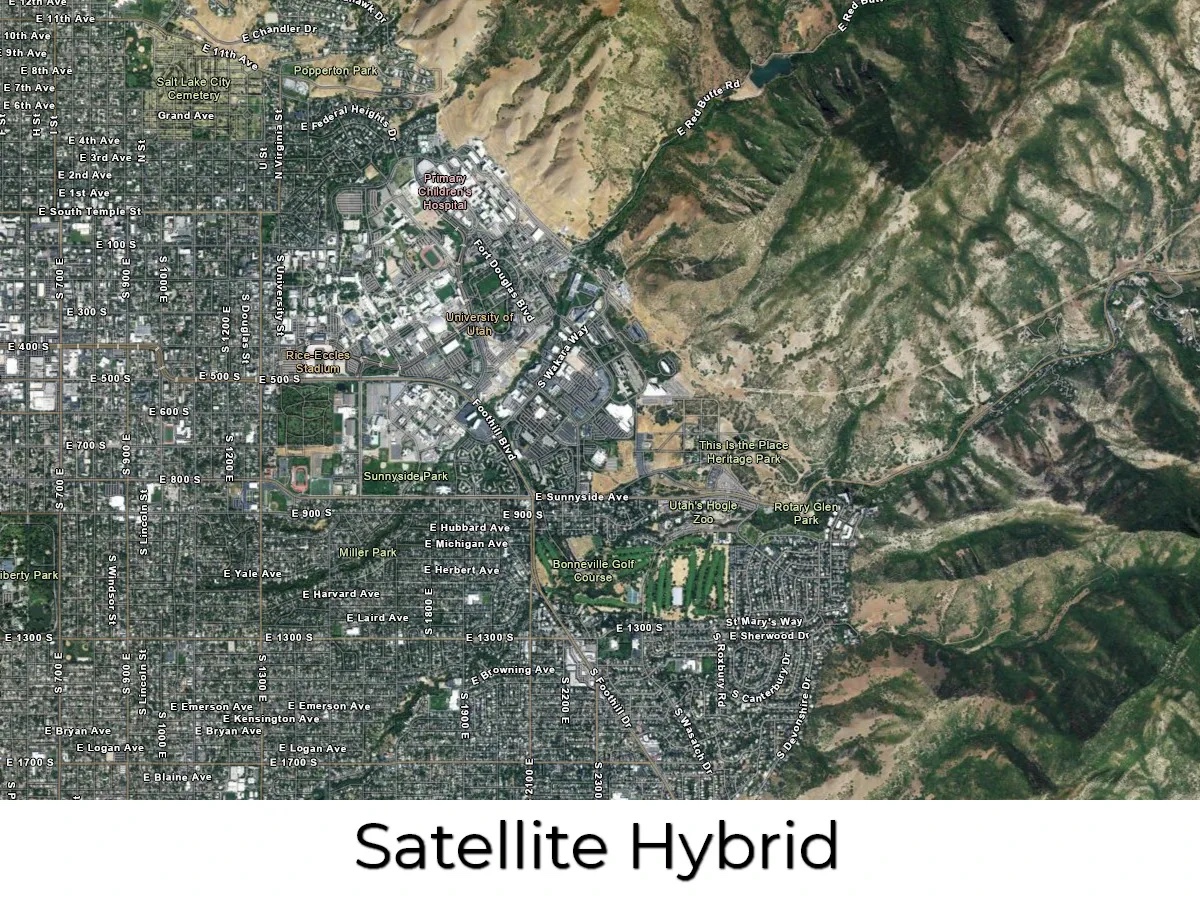
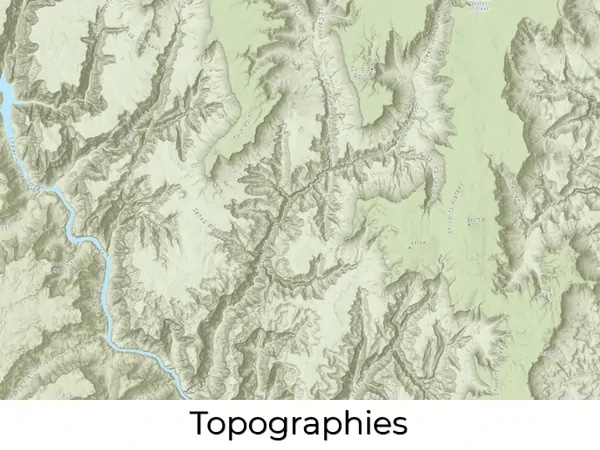
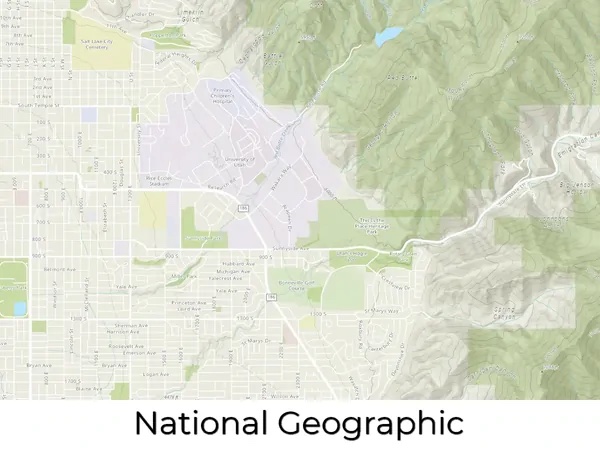
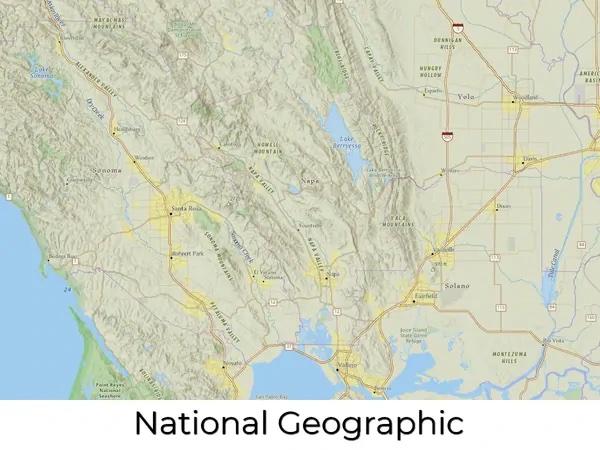
- Determine the design style of the map. There are over 40 styles to choose from. Popular ones include satellite, terrain, topography, raised relief, and satellite hybrid.
- Add any special design features not included in the source map, such as special features, landmarks, legends, roads, cities, symbols, etc.
- Add elevation data. The next step is to add elevation data to the map. This can be done using a variety of techniques, such as contour lines, shading, or digital elevation models (DEMs).
- Print the Map Overlay. Latex vinyl materials are used for the map details and colors.
- Create the 3D physical map. Once the elevation data has been added to the map, a physical 3D structure is created that replicates the topography of the area. This can be done using 3D printed plastic or thermoformed molding/casting. Either approach is combined with the Vinyl overlay.
- Finish the map. This is where any excess materials are cutaway. Any special sealers, matte finishes, hardeners, or UV protection is applied. Wood, metal or plastic bases are built and border flocking may be applied.
Features & Benefits of Topographical Maps
- Remarkably Strong: You can drive a 1-ton truck over our topographical maps.
- Precision: We print our 3D topographical maps to scale as accurately as are the original files and images.
- Excitement: It is much easier to get excited about 3D views of your ski runs or trails than flat printed maps.
- Stain and Water Resistance: Spills are easy to wipe up.
- Communication: Topographical maps are simple to understand with a quick glance.
- Affordability: Our 3D technologies allow you to order custom 3D maps for a reasonable price.
- Testability: 3D technologies are affordable enough to test designs, such as several versions of planned work.
- Consistency: Using modern print and casting technologies, you can easily recreate identical topographical maps.
- Portability: We use lighter materials than what was available in the past, making our topographical maps easy to transport.
Videos of Topographical Maps
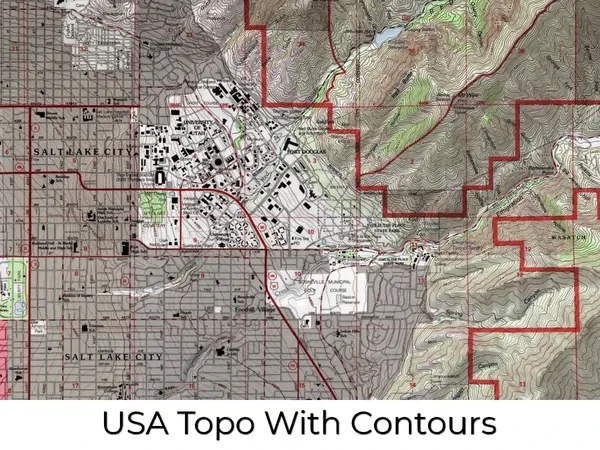
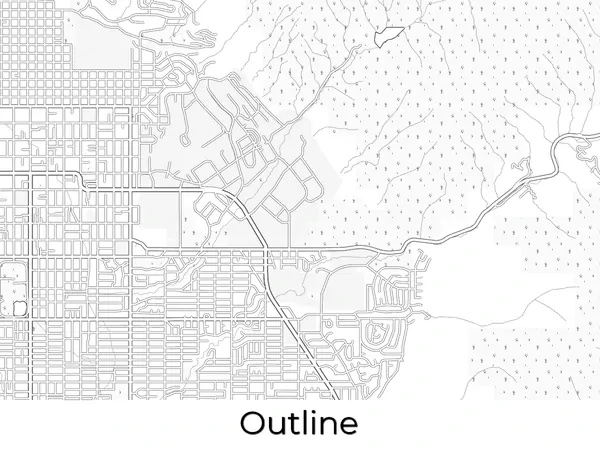
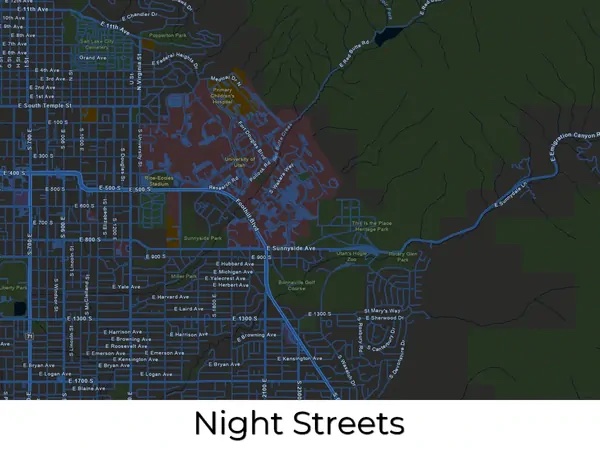
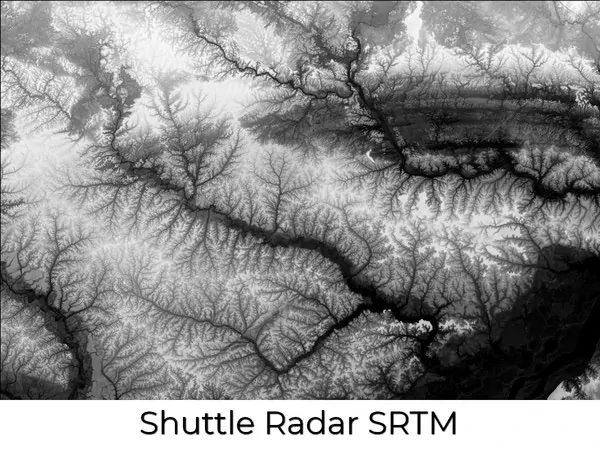
Map Design Styles of Topographical Maps
Many design styles, or base maps, serve as a starting point for your topographical map. We source and create our base maps using the same digital tools that expert cartographers use to create maps. Once you have selected your base map, everything else is fully customizable. We can layer informational text (such as landmarks or other points of interest) and even change the colors to suit your preferences.
Complex layers can be added such as streams and lakes, terrain, roads, and even more detail like political boundaries, religious, and other population-based demographics. Multiple layers can also be added to the same topographical map. For example, community developers and city planners can benefit from a topographical map with layers that include parcel lines, existing building footprints, and utility lines. Take a look at the map style categories below for inspiration.
Technology and Materials Used in Topographical Maps
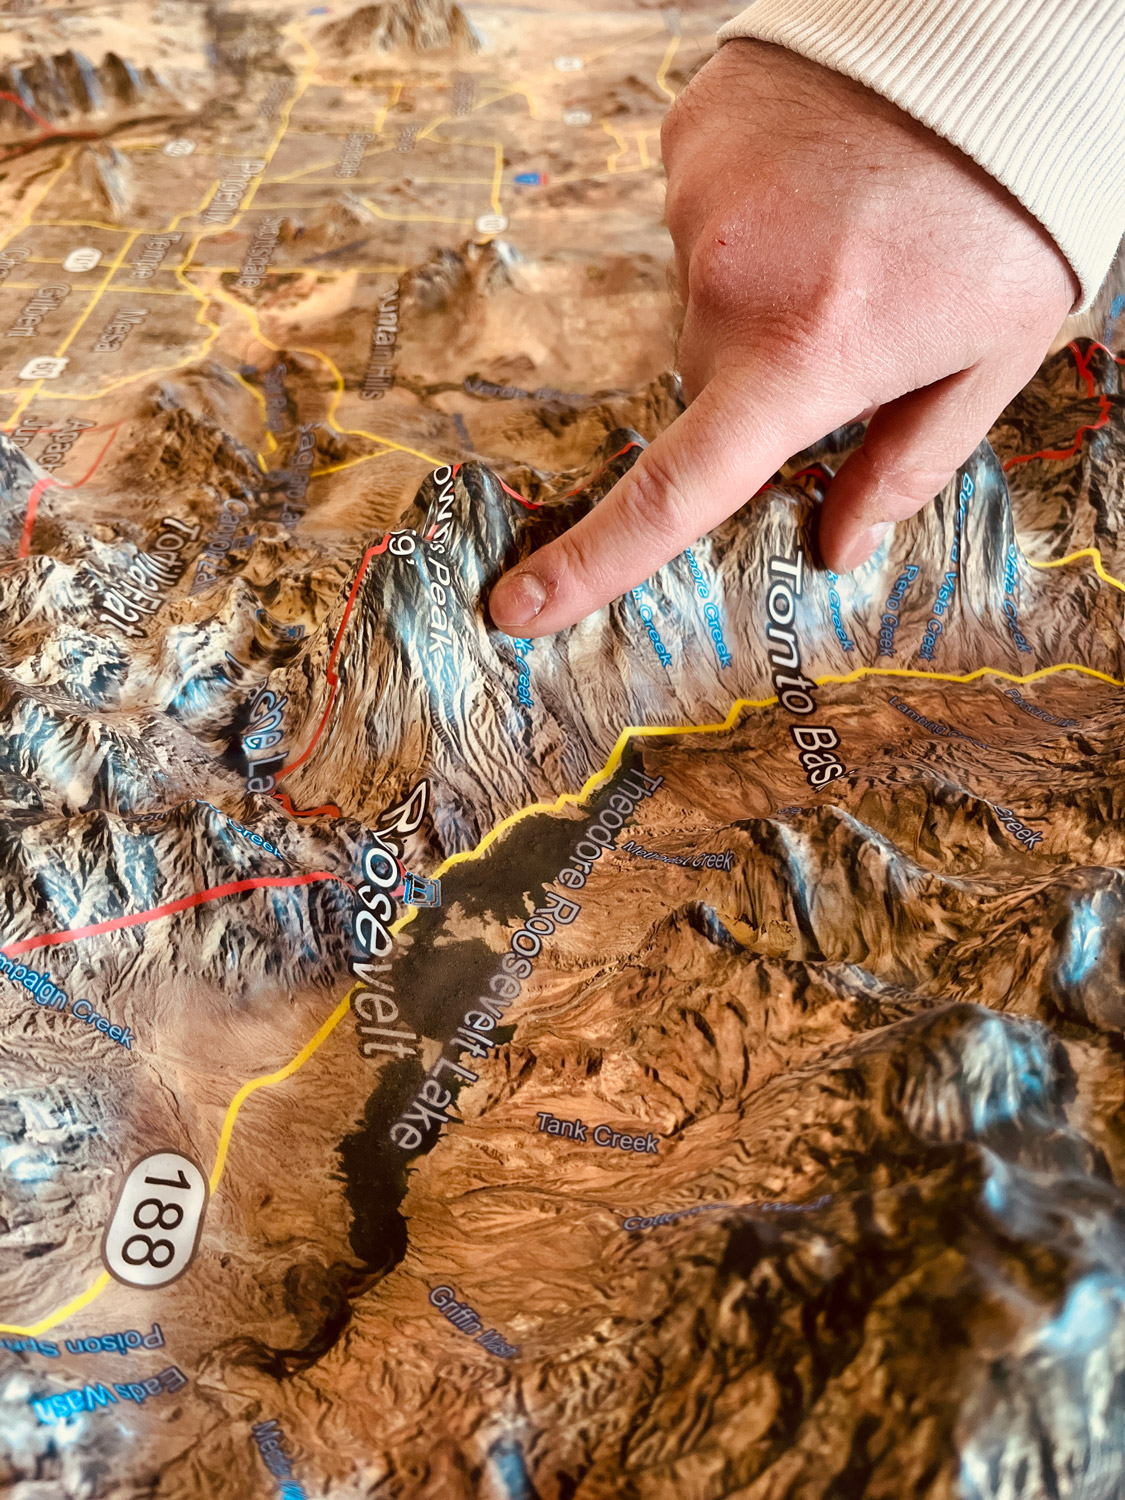
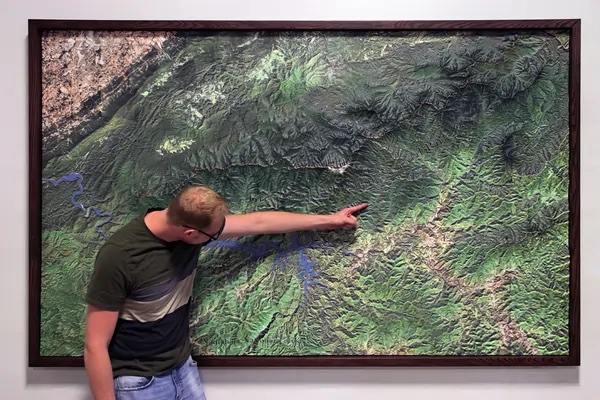
- With 3D printing technology, you are not limited to straight lines and boxes. The curves and cliffs are captured accurately and beautifully in astonishing detail.
- Your vision of the final 3D map determines which materials we will choose to produce the best results. We help you to determine the materials that best suit your project.
- We use fabrication technologies such as 3D printing, CNC cutting, and molding/casting.
- Topographical maps show incredible detail.
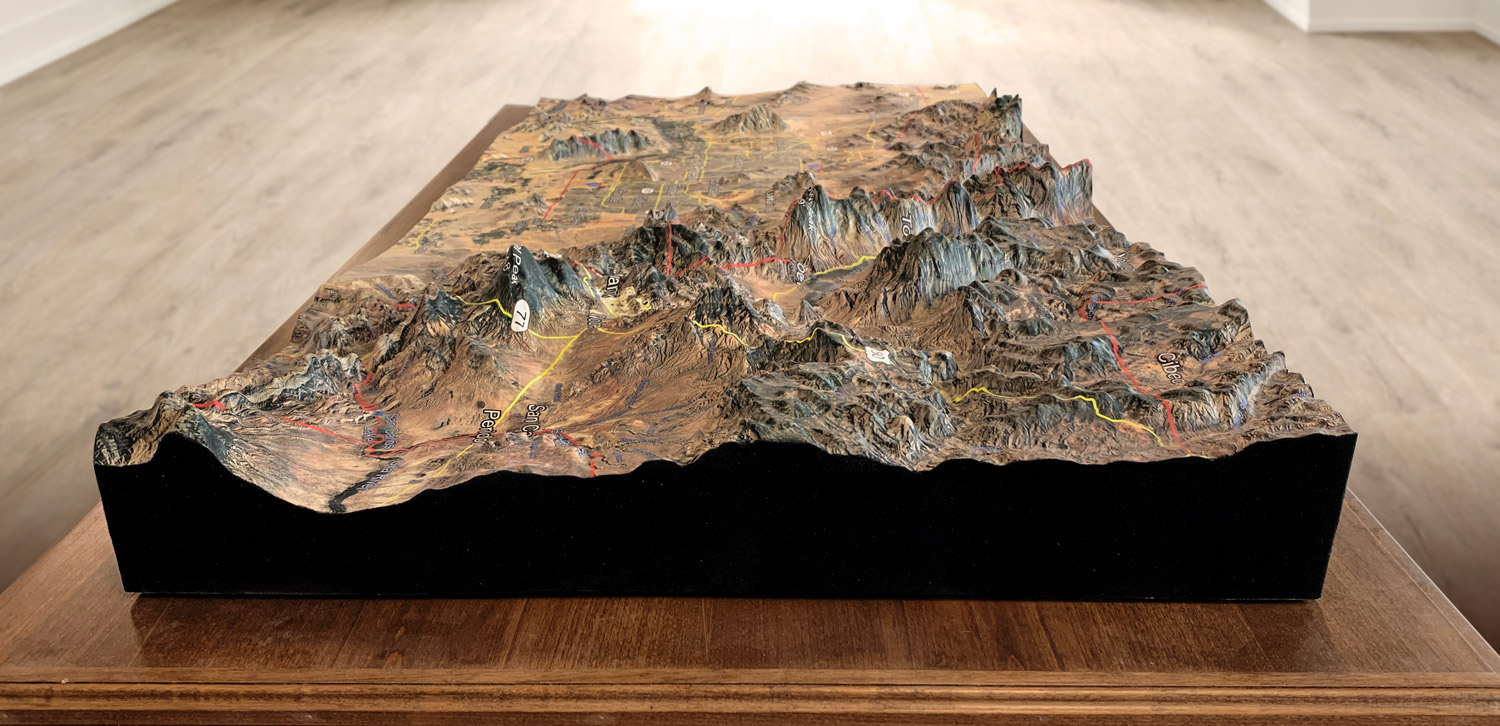
- Our maps are printed in full color (with over 17 million variations of color) for awe-inspiring presentations and displays. No painting required!
- Typically, we use a special process for finishing the sides of the raised relief maps in a suede-like material, similar to the finish of a jewelry box.
- Our in-house paint booth gives us flexibility in different types and grades of paint and finishing capabilities; we can provide UV-resistant coatings to protect the coloration of your 3M map for many years.
- We also offer customized additions to our 3D maps and models. Our in-house carpentry shop will build elegant bases, tables, or cabinetry to display any map you choose. Worried about dust? We can customize a case to protect your display as well. Our skilled artisans can hand-paint details to make your map a true work of art.
Pricing of Custom Topographical Maps
The price of 3D maps and models are generally based on your size requirements, specific design needs, and the amount of work it will take to produce. Each map is custom-built and charged for accordingly. The best way to determine cost is to email us, call us at 385-206-8700, or fill out the form below and let us bid on your project.
Get a Free Price Estimate for a Custom Topographical Map
Custom Fabrication Workflow

Common Questions & Answers
- What is the largest map you can fabricate? There is no limit to the size of a map we can build. There are practical limits that will impact shipping and installation, but we work closely with our customers on these special requirements.
- What type of 3D maps can you fabricate? All types. Satellite Maps, Terrain Maps, Topographical Maps, Raised Relief Maps, USGS Maps, Contour Maps, and many more.
- Can you fabricate with different technologies and materials? Yes. Our most common fabrication technology is 3D Printing, but we can also build 3D Maps with CNC Cutting, 3D Foam, Molding/Casting, Thermoforming, and Sculpting.
- What materials can you 3D print in? We match the correct material and fabrication process to your requirements in terms of presentation, size, and transportability. We can 3D print in PLA, FDM, Full-Color Sandstone, UV-cured resin, plastic, rubber-like, acrylic, and nylon – as well as combining multiple technologies.
- Can you sign a Non-disclosure Agreement that you supply? Yes.
- How long will it take to create my map? That depends on the design and size of the map. A more complex or detailed map will take longer than a simple map, we can’t really say exactly how long it will take until we have the chance to understand what type of map you want fabricated. Generally, smaller standard maps can be a couple of weeks and large museum exhibition maps can be 6 months.
- What do you need from me to start the map fabrication? Boundaries are a good place to start. Determining map styles, sizes, height (may be exaggerated), and cabinetry needs are all part of the process. Special design features can also be added.
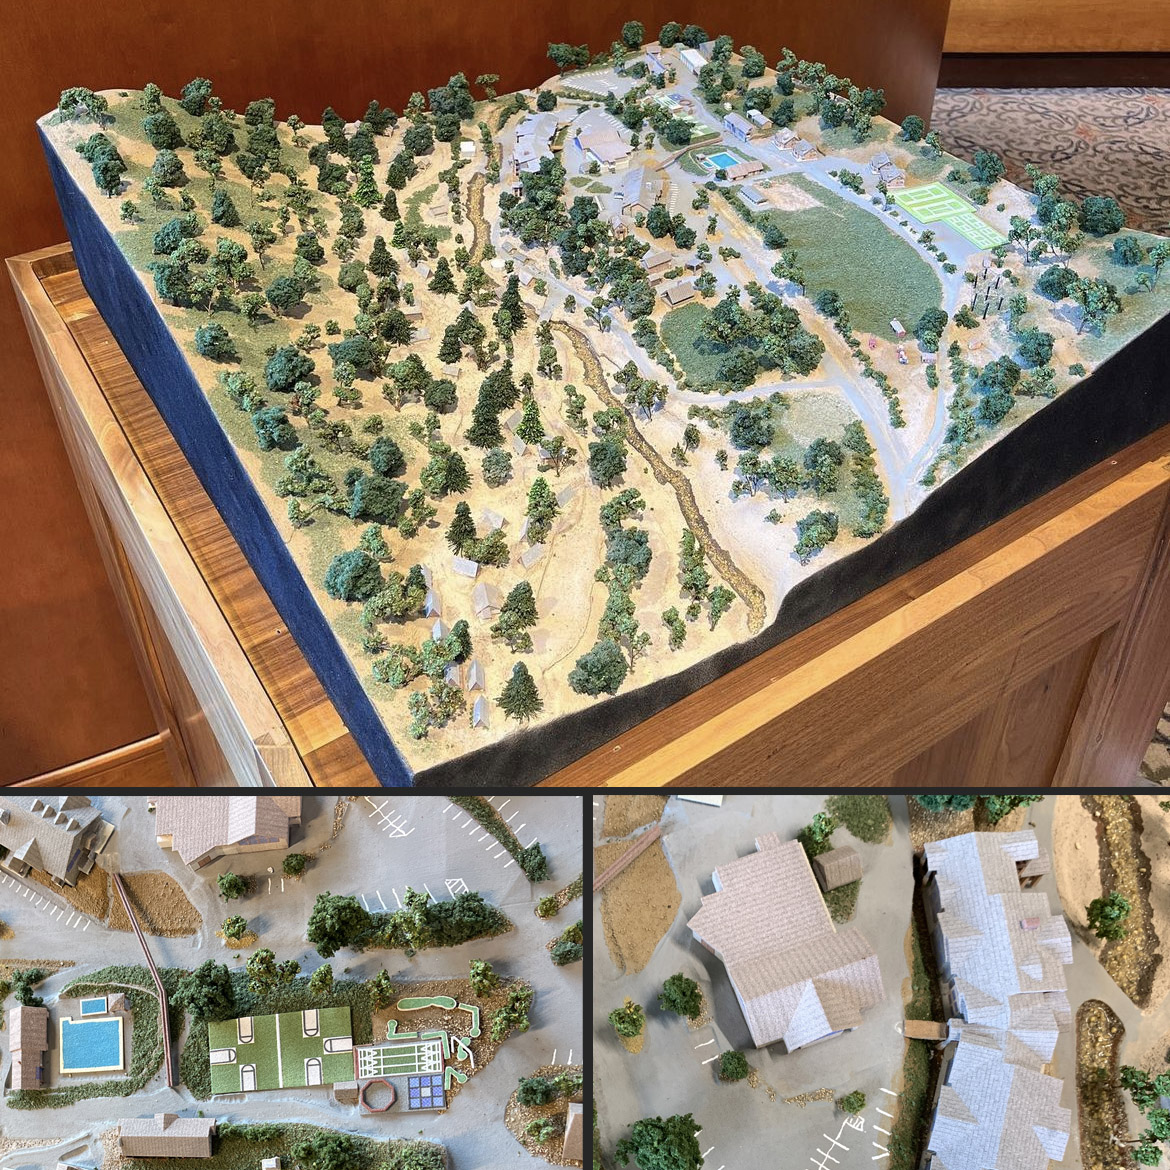
- Can you add homes, buildings, swimming pools, arbors, hardscaping features, etc.? Yes. We can 3D print many of these items and include them in our maps. We refer to these more complex maps as architectural dioramas.
- What is a topography map? A topographic map, also known as a contour map, is a type of map that represents the physical features and terrain of a particular area using contour lines to show changes in elevation. These maps show the shape of the land, including mountains, valleys, ridges, and other features, as well as bodies of water, vegetation, and man-made structures. Topographic maps are typically used for outdoor activities such as hiking, camping, and mountain biking, as well as for scientific purposes such as geology, geography, and environmental studies. They are also useful for land-use planning, urban development, and natural resource management. Topographic maps are created using specialized surveying techniques, including aerial photography, satellite imagery, and ground surveys, and are available in a variety of scales, from small-scale regional maps to large-scale detailed maps of specific areas.
- How do I read a topographic map? Reading a topographic map can be intimidating at first, but it becomes easier with practice. Here are some steps to help you read a topographic map:
Understand the legend: The legend is the key to the symbols and colors on the map. It explains what the various symbols and colors represent, such as contour lines, water bodies, and vegetation.
Look at the contour lines: Contour lines are the most important feature on a topographic map. They represent changes in elevation and help you visualize the three-dimensional shape of the land. Each contour line represents a specific elevation and is usually labeled with the elevation in feet or meters.
Determine the direction of the slope: The direction of the slope is indicated by the shape and spacing of the contour lines. If the contour lines are close together, the slope is steep, and if they are far apart, the slope is gradual. The contour lines that form a “V” shape point uphill, and the contour lines that form a “U” shape point downhill.
Locate water bodies and vegetation: Water bodies such as rivers, lakes, and streams are usually shown in blue, while vegetation such as forests and grasslands are shown in green.
Identify man-made features: Man-made features such as roads, buildings, and power lines are usually shown in black or brown.
Use the scale to estimate distances: The scale on the map tells you how to convert map distance to real-world distance. This can be useful for estimating how far you need to travel to reach a particular feature on the map.
By following these steps and practicing with different topographic maps, you can become more confident in your ability to read and interpret topographic maps.
- How are contour lines used on a topographical map? Contour lines are used to show the elevation and shape of the land on a topographical map. They connect points of equal elevation and help the reader visualize the three-dimensional shape of the terrain.
- What is the scale of a topographical map? The scale of a topographical map indicates the ratio between the distance on the map and the corresponding distance on the ground. For example, a map with a scale of 1:50,000 means that one unit of distance on the map (such as an inch or centimeter) represents 50,000 units of distance on the ground (such as feet or meters).
- How can you determine the elevation of a point on a topographical map? Locate the point on the map and then find the contour line that passes through that point. The elevation of the point is equal to the elevation of the contour line plus a fraction of the distance between the contour lines.
- What other information can be found on a topographical map? In addition to contour lines and elevation information, topographical maps can also include symbols and labels for features such as roads, buildings, and landmarks. They may also include information about vegetation, land use, and other aspects of the natural and built environment.
- What does a topographic map show? A topographic map shows the physical features and terrain of a geographic area. These maps use contour lines to represent changes in elevation, showing the heights and depths of mountains, valleys, and other landforms. Additionally, topographic maps may include other information such as bodies of water, roads, and man-made structures. These maps are commonly used in outdoor activities such as hiking and camping, as well as in scientific research and urban planning.
- What is a topographic map used for? A topographic map is used to provide a detailed and accurate representation of the physical features and terrain of a geographic area. It is used by hikers, campers, and other outdoor enthusiasts to plan routes and navigate through unfamiliar terrain. Topographic maps are also used in scientific research, such as geological surveys, environmental studies, and land management. They can be used by engineers and urban planners to plan infrastructure projects and assess the impact of human development on the environment. Additionally, topographic maps can be used for military and defense purposes to plan and execute operations in various terrain and landscape conditions.
- What is a contour interval on a topographic map? A contour interval on a topographic map is the vertical distance between adjacent contour lines. Contour lines connect points of equal elevation, and the contour interval determines how much elevation change is represented by each contour line. For example, a map with a contour interval of 10 feet means that every contour line represents a change in elevation of 10 feet. A map with a smaller contour interval, such as 5 feet, will have more contour lines and provide a more detailed representation of the terrain. Contour intervals are typically listed in the map’s legend and can vary depending on the scale and level of detail of the map.
- What is a topographic map used for? A topographic map is used to provide a detailed and accurate representation of the physical features and terrain of a geographic area. It is used by hikers, campers, and other outdoor enthusiasts to plan routes and navigate through unfamiliar terrain. Topographic maps are also used in scientific research, such as geological surveys, environmental studies, and land management. They can be used by engineers and urban planners to plan infrastructure projects and assess the impact of human development on the environment. Additionally, topographic maps can be used for military and defense purposes to plan and execute operations in various terrain and landscape conditions.
- How is elevation shown on a topographic map? Elevation is shown on a topographic map using contour lines. Contour lines are lines that connect points of equal elevation above sea level. Each contour line on the map represents a specific elevation, and the distance between adjacent contour lines represents the change in elevation. Typically, contour lines are labeled with their corresponding elevation in feet or meters. The contour lines are often drawn in brown color and are spaced at regular intervals depending on the map’s scale and level of detail. The closer the contour lines are to each other, the steeper the slope or terrain of the area represented on the map.
- How do I draw a topographic map?
Drawing a topographic map requires specialized knowledge, skills, and tools. It is typically done by cartographers, surveyors, and other professionals who have training and expertise in creating maps.
Here are some general steps to draw a topographic map:
Survey the area: The first step is to survey the area to be mapped using various techniques such as field observations, aerial photography, satellite imagery, and LiDAR data.
Determine the contour interval: The contour interval should be chosen based on the scale of the map, the level of detail desired, and the terrain of the area being mapped.
Draw the contour lines: Using the survey data, draw the contour lines on the map. Each contour line represents a specific elevation, and they should be evenly spaced based on the chosen contour interval.
Label the contour lines: Label each contour line with its corresponding elevation in feet or meters.
Add other features: Add other features to the map such as bodies of water, roads, buildings, and vegetation.
Finalize the map: Once all features have been added, finalize the map by adding a title, a legend, and a scale bar.
It’s important to note that drawing an accurate and detailed topographic map requires specialized training, equipment, and software. Therefore, it’s not a task that can be done easily by individuals without proper training and resources.
- What is one element a topographic map shows? One element that a topographic map shows is the elevation of the terrain. This is represented by contour lines that connect points of equal elevation, with each contour line indicating a specific elevation above sea level. The contour lines are typically labeled with their corresponding elevation in feet or meters. By analyzing the spacing and shape of the contour lines, users can determine the steepness, slope, and shape of the terrain, which is essential information for planning and navigating outdoor activities such as hiking and mountaineering.
- How do I calculate gradient on a topographic map?
To calculate the gradient on a topographic map, you will need to determine the change in elevation between two points and the distance between those points. Here are the steps to follow:
Identify the two points on the map between which you want to calculate the gradient. Locate these points on the map and note their elevations.
Determine the change in elevation between the two points. Subtract the elevation of the lower point from the elevation of the higher point. For example, if one point is at an elevation of 500 feet and the other is at an elevation of 700 feet, the change in elevation would be 200 feet.
Measure the distance between the two points. You can use a ruler, a string, or a compass to measure the distance on the map.
Divide the change in elevation by the distance between the two points. This will give you the gradient or slope between the two points. For example, if the change in elevation is 200 feet and the distance between the two points is 1 mile (5,280 feet), the gradient would be 200/5280 = 0.038 or 3.8%.
Note that gradient can also be expressed as a ratio or a percentage. In the example above, the gradient could also be expressed as 1:26 or 1 unit of rise for every 26 units of run.
- What is a contour line on a topographic map? A contour line on a topographic map is a line that connects points of equal elevation above sea level. Contour lines represent the shape and elevation of the terrain on the map. Each contour line represents a specific elevation, and the spacing between contour lines indicates the slope and steepness of the terrain. For example, closely spaced contour lines indicate a steep slope, while widely spaced contour lines indicate a gradual slope.
Contour lines on a topographic map are typically drawn in brown or black and are labeled with their corresponding elevation in feet or meters. They are often used by hikers, mountaineers, and other outdoor enthusiasts to plan routes and navigate through unfamiliar terrain. Contour lines are an essential tool for understanding the shape and elevation of the land on a map, and they provide important information for safety and navigation in the outdoors.
- What data is shown on topographic maps? Topographic maps show a variety of data related to the shape, elevation, and features of the land. Here are some of the main types of data that are typically shown on topographic maps:
Elevation: Topographic maps show the elevation of the land using contour lines that connect points of equal elevation above sea level. The contour lines are labeled with their corresponding elevation in feet or meters.
Terrain features: Topographic maps show various terrain features such as hills, valleys, ridges, and depressions. These features are represented by the shape and spacing of the contour lines.
Bodies of water: Topographic maps show rivers, lakes, ponds, and other bodies of water.
Vegetation: Topographic maps show the types of vegetation that are present in the area, such as forests, grasslands, and wetlands.
Man-made features: Topographic maps show man-made features such as roads, buildings, bridges, and trails.
Geographic coordinates: Topographic maps show the latitude and longitude coordinates of specific locations on the map.
Magnetic declination: Topographic maps show the difference between magnetic north and true north at a given location. This is important information for compass navigation.
Topographic maps are used for a variety of purposes, including outdoor recreation, geological and environmental research, land-use planning, and civil engineering.
Why are topographic maps useful? Topographic maps are useful for a variety of purposes because they provide detailed information about the shape, elevation, and features of the land. Here are some of the main reasons why topographic maps are useful:
Outdoor recreation: Topographic maps are essential tools for hikers, backpackers, and other outdoor enthusiasts who need to plan routes and navigate through unfamiliar terrain. The contour lines on the map provide valuable information about the slope and steepness of the land, which can help hikers plan safe and efficient routes.
Geology and environmental research: Topographic maps are used by geologists and other researchers to study the structure and composition of the Earth’s crust. The maps provide information about the elevation of the land, which is important for understanding geological processes such as erosion and plate tectonics.
Land-use planning: Topographic maps are used by urban planners and other professionals to make decisions about land use and development. The maps provide information about the shape and slope of the land, which can help planners determine the best uses for different areas.
Civil engineering: Topographic maps are used by civil engineers to design roads, bridges, and other infrastructure projects. The maps provide information about the elevation of the land and the location of waterways and other features, which is important for determining the best route for a road or bridge.
Emergency response: Topographic maps are used by emergency responders such as firefighters and search and rescue teams to navigate through rugged and remote terrain. The maps provide information about the elevation of the land and the location of features such as rivers and lakes, which can be critical in emergency situations.
- How do I get a topographic map of my property? To get a topographic map of your property, you have a few options:
Order from WhiteClouds: Complete the “Get a Free Price Estimate” above, or contact us at 1-385-206-8700 or [email protected].
Online mapping tools: There are several websites that allow you to generate custom topographic maps of your property. One popular option is CalTopo, which allows you to create detailed topographic maps for free. To use CalTopo, simply enter your property address or location and customize the map as desired.
USGS topographic maps: The United States Geological Survey (USGS) publishes detailed topographic maps of the United States. You can order a printed copy of a USGS topographic map of your property from the USGS Store.
Local government agencies: Your local government may have topographic maps available for your property. Contact your county or city planning department to see if they have any maps available or can provide recommendations for where to find them.
Surveyor: If you need a highly accurate topographic map for your property, you may want to hire a licensed surveyor. A surveyor can create a detailed map of your property using advanced surveying techniques and equipment.
Before obtaining a topographic map of your property, be sure to research the various options available to determine which one is best for your needs and budget.
How do I measure distance on a topographical map? To measure distance on a topographic map, you will need a ruler or a piece of string and a scale. Here are the steps to follow:
Locate the scale on the map: The scale is usually located in the legend and tells you how to convert map distance to real-world distance. For example, if the scale is 1:50,000, this means that 1 unit of measurement on the map (e.g. 1 inch) represents 50,000 units of measurement in the real world (e.g. 50,000 inches or about 0.79 miles).
Determine the distance you want to measure: Identify the two points on the map between which you want to measure distance. You can use a ruler or a piece of string to mark the distance.
Measure the distance on the map: Place the ruler or string on the map and line it up with the two points you want to measure. Use the scale to convert the map distance to real-world distance. For example, if the distance between the two points on the map is 2 inches and the scale is 1:50,000, the real-world distance between the two points is 100,000 inches or about 1.57 miles.
Take into account changes in elevation: If the two points you are measuring are at different elevations, you will need to factor in the change in elevation when calculating the real-world distance. To do this, you can use the contour lines on the map to estimate the vertical distance between the two points and add it to the horizontal distance you measured in step 3.
By following these steps, you can measure the distance between two points on a topographic map and determine the real-world distance between them.
Do you have a question we didn’t answer? Don’t hesitate to contact us at 1-385-206-8700 or [email protected].
Worldwide Delivery
WhiteClouds has delivered maps around the world.
History of Topographical Maps
The history of topographical maps dates back to the 16th century, when cartographers began to develop techniques for accurately depicting the three-dimensional features of the land on two-dimensional maps. However, it wasn’t until the 19th century that the modern topographic map as we know it today began to take shape.
One of the key developments in the history of topographical maps was the creation of contour lines. Contour lines are lines that connect points of equal elevation on the land, and they allow cartographers to depict the shape of the land in a way that is both accurate and easy to read. The concept of contour lines was first developed by the French engineer Gaspard de Prony in the late 18th century, and it was later refined by the German geographer Carl Friedrich Gauss and others.
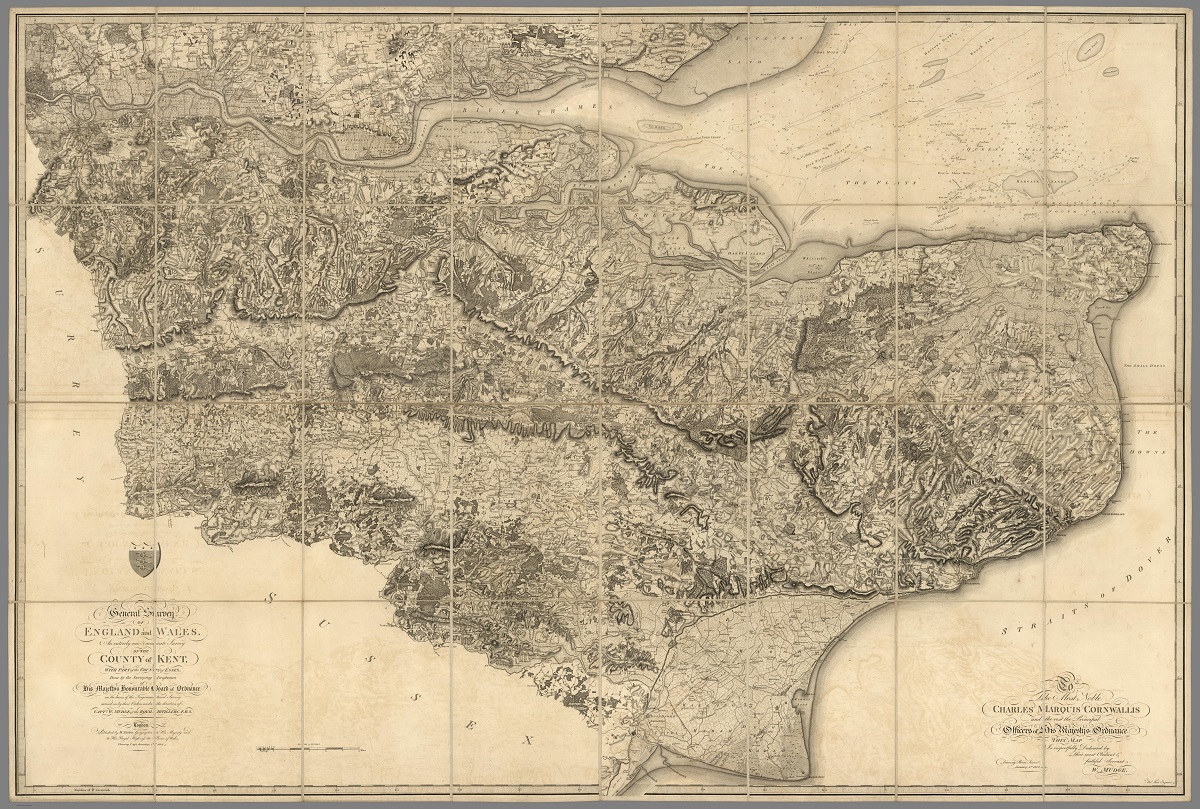
In the 19th century, several countries began to produce topographical maps on a large scale. One of the first was the Ordnance Survey in the United Kingdom, which was established in 1791 to create maps for military and civilian use. The Ordnance Survey developed a highly accurate system of surveying the land and creating detailed topographical maps, which served as a model for other countries.
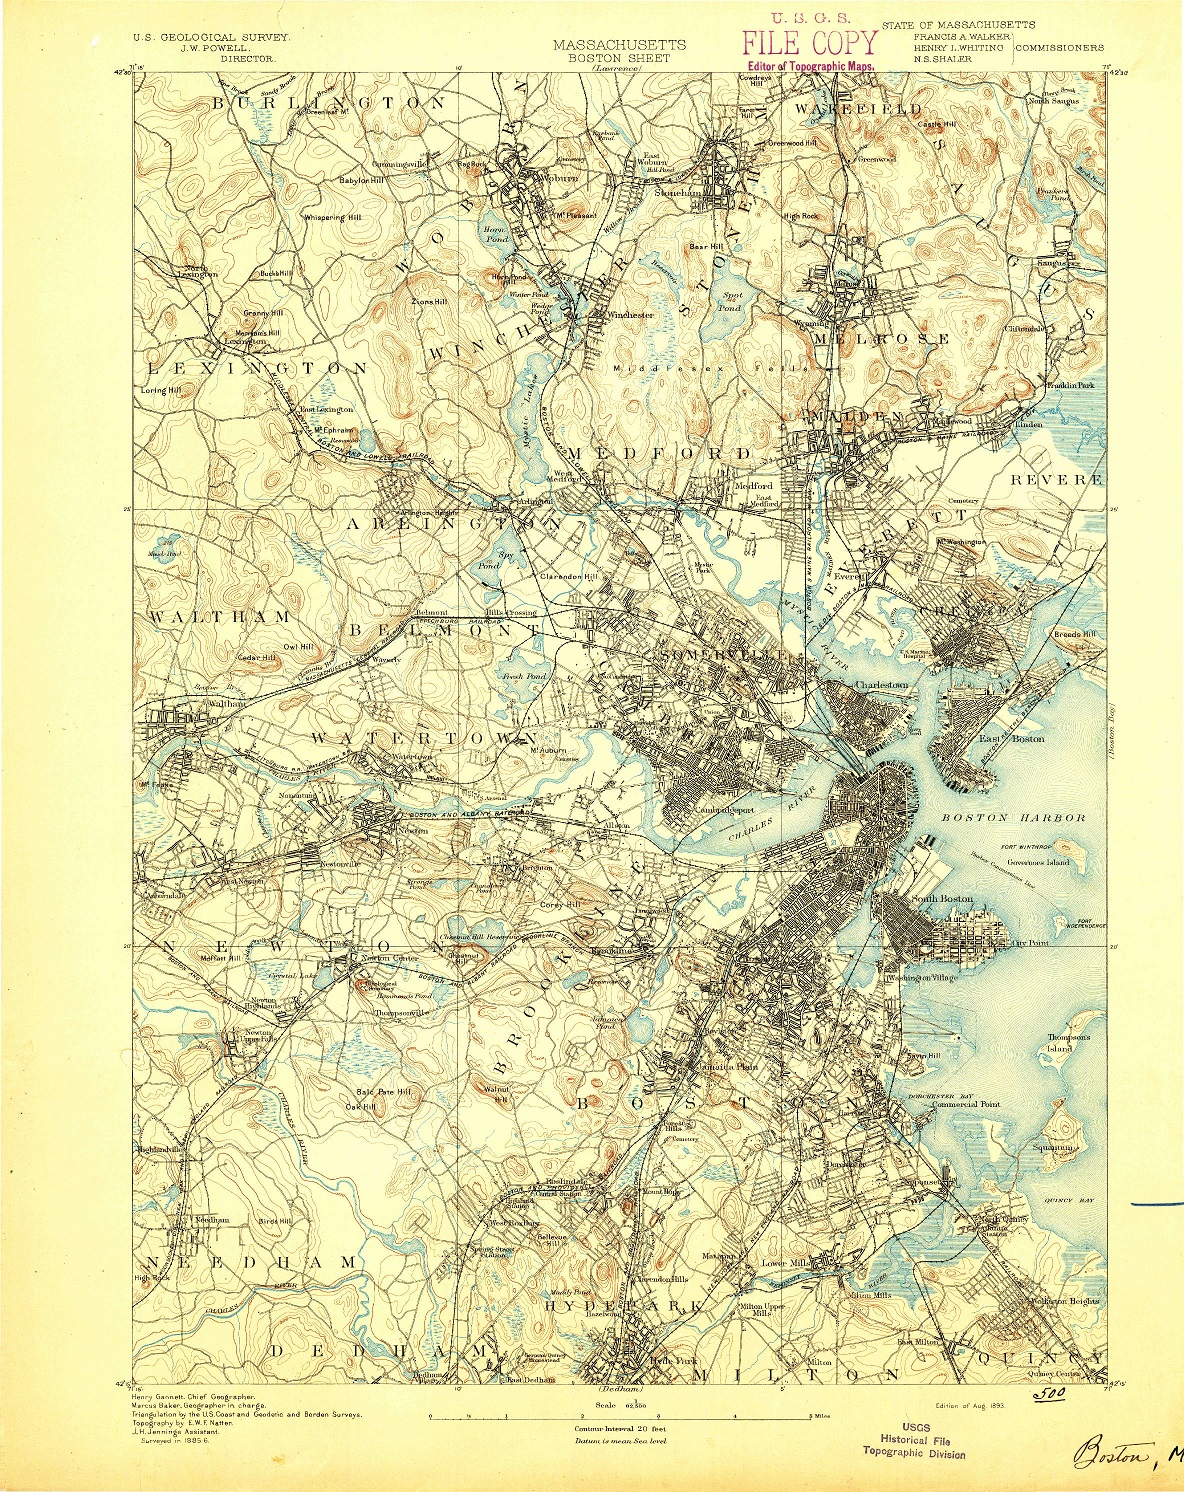
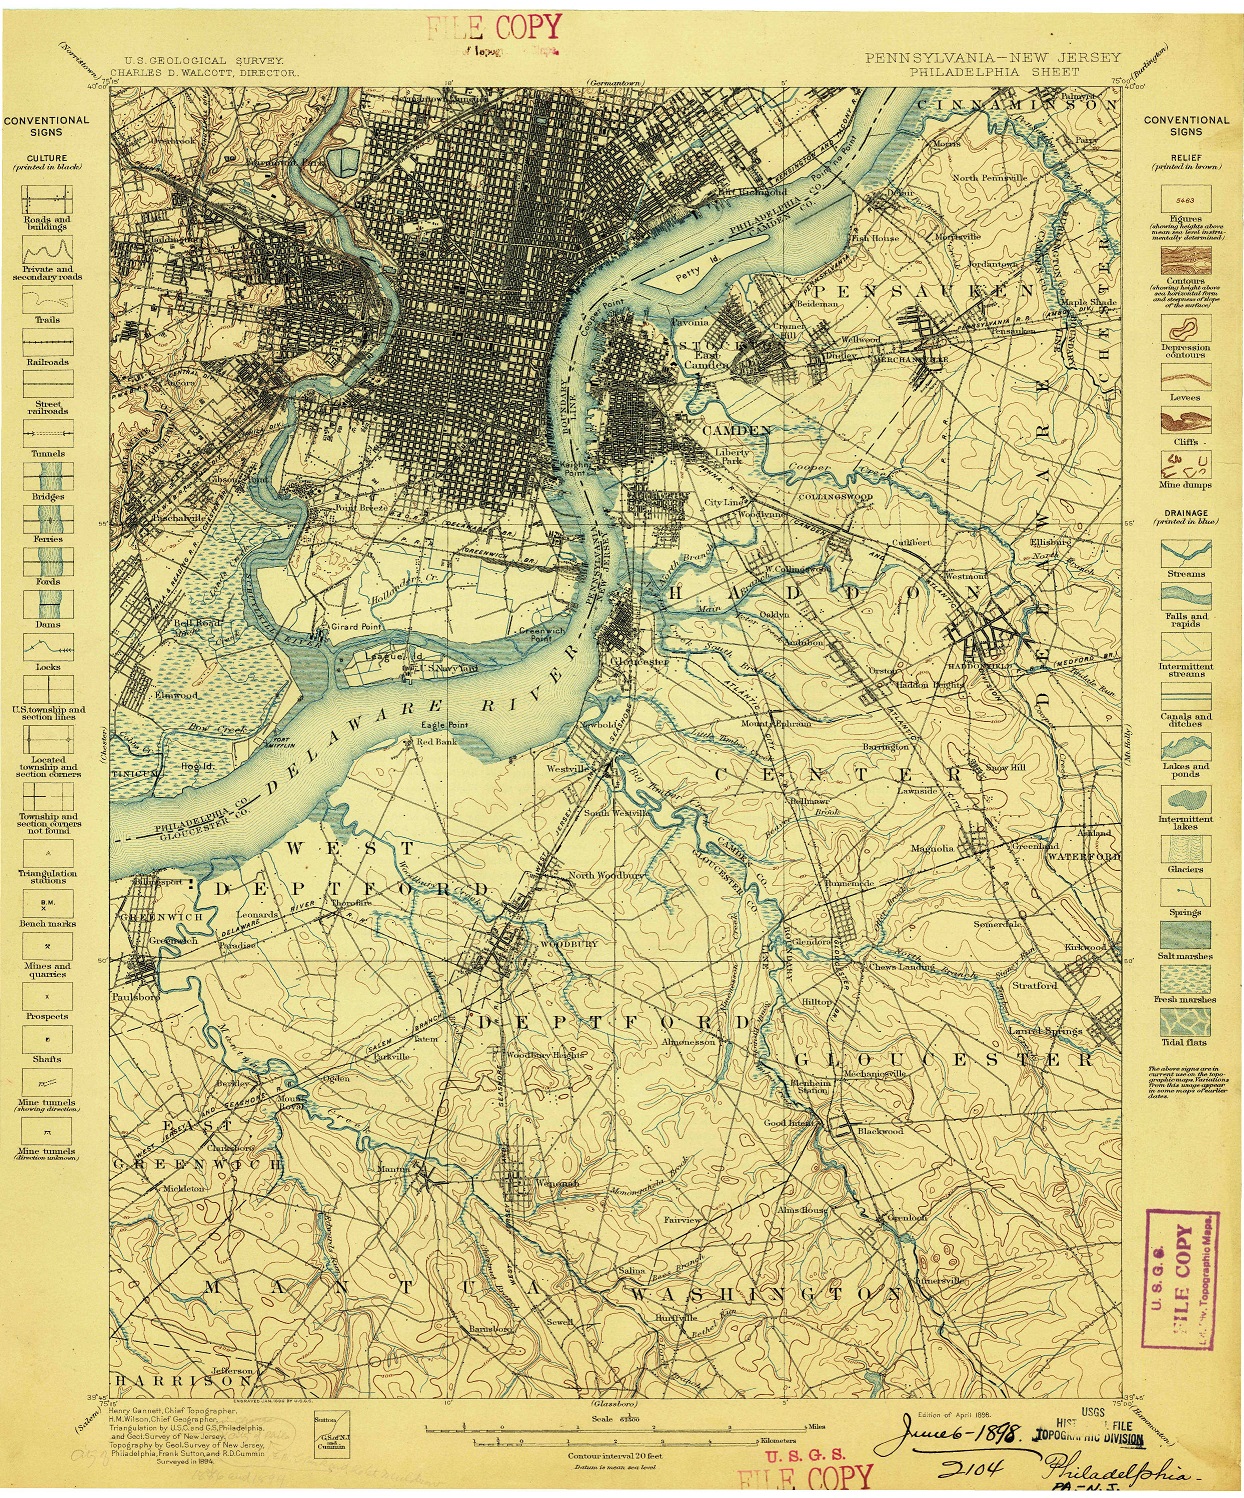
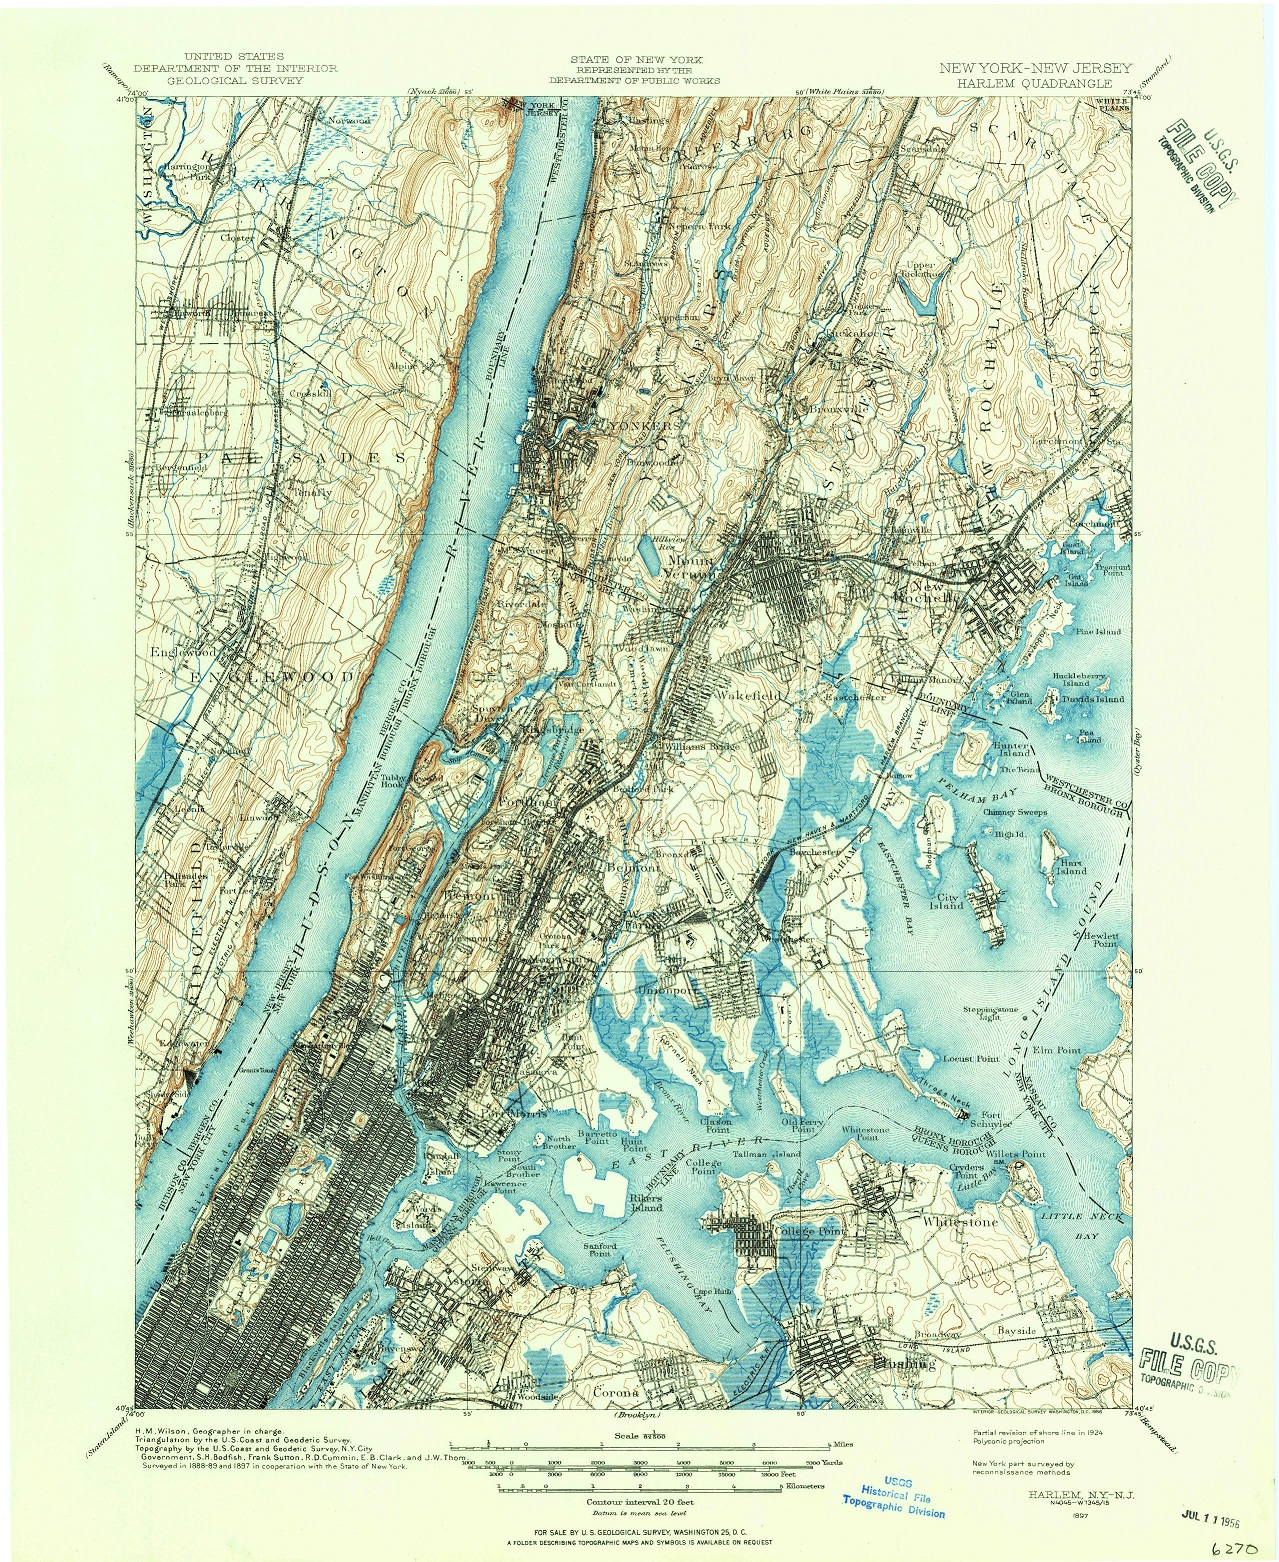
In the United States, the United States Geological Survey (USGS) was established in 1879 to create topographical maps of the country. The USGS developed a system of surveying the land using triangulation, which involved measuring the angles between landmarks using specialized equipment. This allowed the USGS to create highly accurate topographical maps of the United States, which are still in use today.
In the early 20th century, topographic maps became even more important with the growth of aviation and the need for accurate maps for pilots. The first aeronautical charts were created by the USGS in the 1920s, and these maps were used by pilots to navigate and avoid obstacles while flying. Topographical maps played a critical role in military operations. The accurate depiction of the land was essential for planning and executing military campaigns, and topographic maps were used to plan everything from troop movements to artillery placements.
Today, topographic maps are widely used by a variety of professionals, including geologists, engineers, architects, and environmental scientists. They are also an essential tool for outdoor enthusiasts, such as hikers, campers, and hunters, who use them to plan routes and navigate through unfamiliar terrain. With the advent of digital mapping technologies, topographic maps have become even more accessible and versatile, and they are now available in a variety of formats, including online maps, smartphone apps, and GPS devices.
In summary, the history of topographic maps is a long and fascinating one, spanning centuries of technological and scientific development. Today, these maps remain an essential tool for understanding and navigating the natural world, and they continue to evolve and adapt to the changing needs of society.