NOAA Maps
What are NOAA Maps?
We build 2D and 3D NOAA Maps
Table of Contents
NOAA Maps
NOAA (National Oceanic and Atmospheric Administration) maps are a treasure trove of information for anyone interested in the oceans, atmosphere, and climate of our planet. These maps are created by some of the world’s leading experts in oceanography, meteorology, and geospatial science, and are used by scientists, policymakers, and the general public alike.
From tracking hurricanes and tsunamis to mapping marine habitats and fisheries, NOAA maps provide a wealth of information that helps us better understand and manage our planet’s natural resources. With their stunning visuals and cutting-edge technology, these maps are a testament to the power of science and the human drive to explore and understand the world around us.
Weather Forecasting: One of the most important uses of NOAA maps is in weather forecasting. NOAA’s National Weather Service produces a wide variety of maps that provide real-time information on current weather conditions, as well as maps that help meteorologists predict future weather events. These maps are used by meteorologists to forecast weather events such as hurricanes, tornadoes, and blizzards, and help the public prepare for these events by providing information on storm paths, wind speeds, and other factors that can affect the severity of the storm.
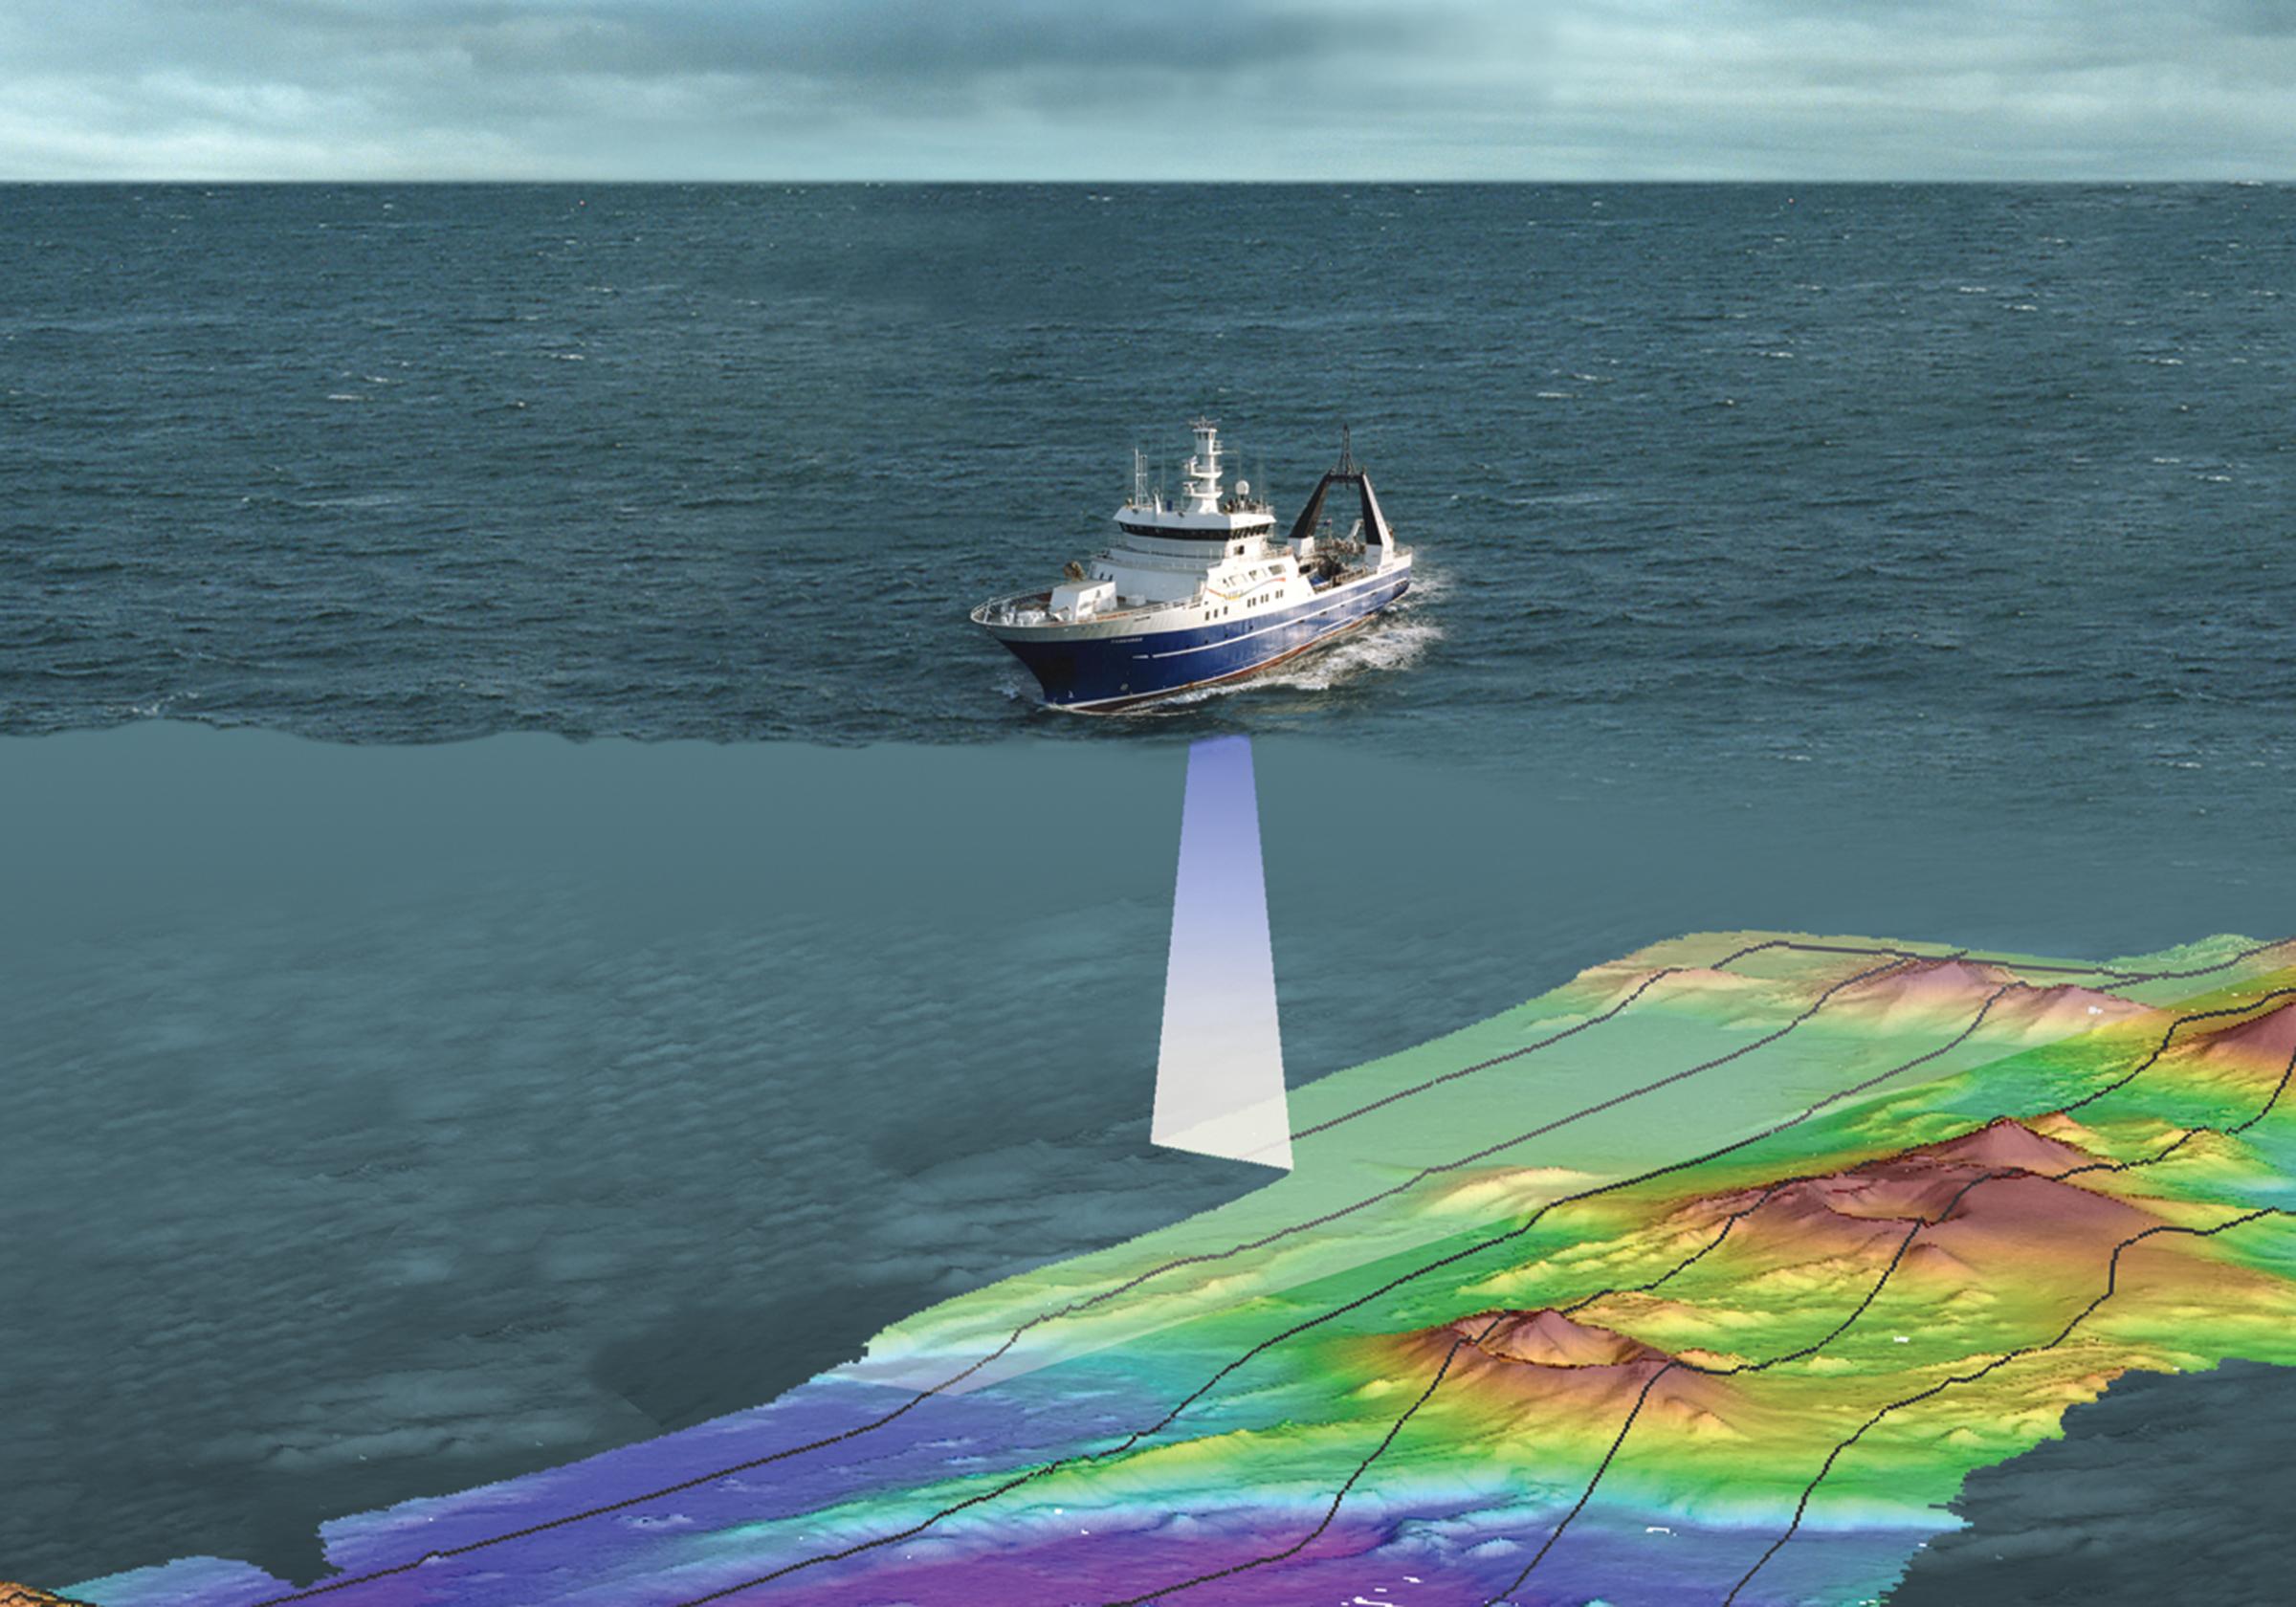
Marine Navigation: NOAA is also responsible for producing a wide range of marine charts and maps, including nautical maps and bathymetric maps. These charts provide detailed information on water depth, navigational hazards, and other features of the ocean floor, and are used by commercial and recreational boaters, fishermen, and other marine users to navigate safely and efficiently on the water.
Climate Research: NOAA maps are also essential for climate research. NOAA produces a variety of climate maps that provide information on long-term weather patterns and climate trends. These maps are used by scientists to study climate change and to identify areas that are particularly vulnerable to its effects. For example, the National Centers for Environmental Information produces a variety of climate maps that provide information on temperature, precipitation, and other climate variables over time. These maps help scientists identify trends and patterns in the climate that can provide insight into the causes and effects of climate change.
Severe Weather Response: Finally, NOAA maps are essential for responding to severe weather events such as hurricanes, tornadoes, and floods. These maps provide real-time information on the location, strength, and predicted path of severe weather events, allowing emergency responders and other stakeholders to take appropriate precautions and evacuate if necessary. For example, the National Hurricane Center produces a variety of maps that provide information on the location and predicted path of hurricanes, as well as information on wind speed and other factors that can affect the severity of the storm. This information is used by emergency responders and policymakers to coordinate response efforts and ensure the safety of the public.
Marine Ecology: NOAA also produces a variety of maps to study marine ecology, including ecosystem maps that provide information on the distribution of marine species and their habitats. These maps are used by scientists to study marine biodiversity and to identify areas that are important for conservation and management. For example, the Marine Protected Areas Center produces a variety of maps that identify areas that are designated as marine protected areas (MPAs). These maps help policymakers and other stakeholders identify areas that are important for the conservation of marine ecosystems and help guide management decisions to ensure their long-term sustainability.
Gallery of NOAA Maps
NOAA has 29 different map viewers available. Examples of each map are shown below. Access to NOAA’s map viewers are located here: NOAA Web Mapping Applications Gallery.
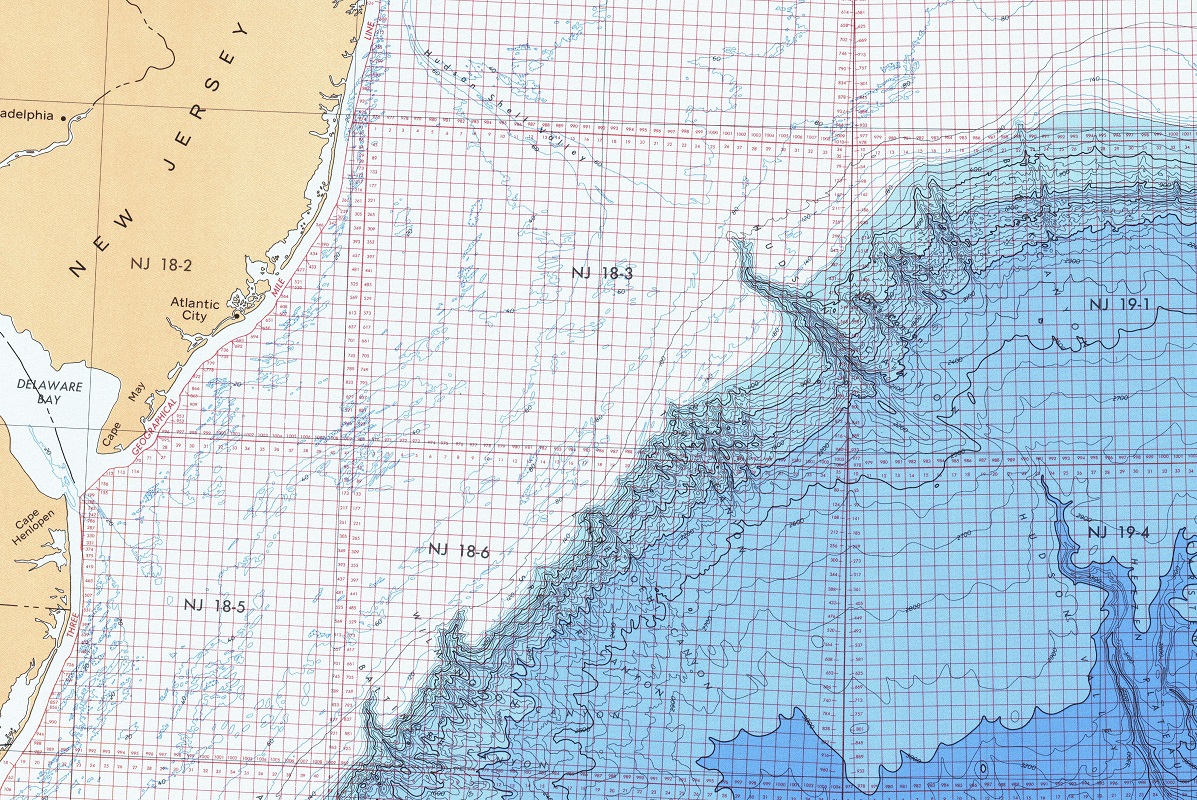
2D NOAA Maps - Marine Geology, Geophysics, and Bathymetry
Previous
Next
2D NOAA Maps - Ecosystems, Natural Resources, and Natural Hazards
Previous
Next
2D NOAA Maps - Climate Monitoring
NOAA (National Oceanic and Atmospheric Administration) maps are an invaluable resource. These maps provide a wealth of information on the oceans, atmosphere, and climate, helping us better understand and manage our planet’s natural resources.
Weather Maps: One of the most well-known types of NOAA maps is weather maps. These maps track weather patterns, including temperature, precipitation, and wind speed, across the United States and the world. They are used by meteorologists to forecast weather events and help the public prepare for severe weather conditions such as hurricanes, tornadoes, and blizzards. NOAA’s National Weather Service produces a wide variety of weather maps, including surface weather maps, radar maps, and satellite maps. These maps provide real-time information on current weather conditions and are updated regularly to ensure accuracy.
Marine Charts: NOAA is also responsible for producing a wide range of marine charts, including nautical maps and bathymetric maps. Nautical maps provide detailed information on water depth, navigational hazards, and other features of the ocean floor, while bathymetric maps provide a 3D view of the seafloor. These charts are used by commercial and recreational boaters, fishermen, and other marine users to navigate safely and efficiently on the water. They are also used by scientists to study ocean currents, marine habitats, and other aspects of the marine environment.
Ecosystem Maps: NOAA also produces a variety of ecosystem maps, which provide information on the distribution of marine species and their habitats. These maps are used by scientists to study marine biodiversity and to identify areas that are important for conservation and management. One example of an ecosystem map produced by NOAA is the Coral Reef Conservation Program’s Habitat Priority Planner. This interactive mapping tool allows users to identify areas of the seafloor that are important for coral reef ecosystems and to prioritize conservation efforts accordingly.
Severe Weather Maps: NOAA also produces a variety of maps to help the public prepare for severe weather events, such as hurricanes and tornadoes. These maps provide real-time information on the location, strength, and predicted path of severe weather events, allowing people to take appropriate precautions and evacuate if necessary. One example of a severe weather map produced by NOAA is the National Hurricane Center’s hurricane tracking map. This map provides real-time information on the location and predicted path of hurricanes, as well as information on wind speed and other factors that can affect the severity of the storm.
Climate Maps: Finally, NOAA produces a variety of climate maps that provide information on long-term weather patterns and climate trends. These maps are used by scientists to study climate change and to identify areas that are particularly vulnerable to its effects. One example of a climate map produced by NOAA is the U.S. Drought Monitor, which provides real-time information on the extent and severity of drought conditions across the United States. This information is used by farmers, policymakers, and other stakeholders to manage water resources and prepare for drought conditions.
NOAA maps are a critical tool for understanding and managing our planet’s natural resources. From weather maps to marine charts and ecosystem maps, these maps provide a wealth of information that is essential for scientists, policymakers, and the public alike.
Sample 2D NOAA Maps-Bathymetry
NOAA (National Oceanic and Atmospheric Administration) maps are an incredible resource for anyone who wants to understand and explore our planet’s oceans and atmosphere. These maps provide a wealth of information on everything from weather patterns to marine ecosystems, and are essential tools. There are many features associated with these NOAA maps.
- High-Quality Imagery: One of the most striking features of NOAA maps is their high-quality imagery. NOAA uses a range of advanced imaging technologies, including satellites and remote sensing, to produce maps that provide incredibly detailed views of the oceans, atmosphere, and land. Whether you’re looking at a map of the ocean floor or a weather map, the level of detail provided by NOAA maps is truly astounding.
- Real-Time Data: Another key feature of NOAA maps is their real-time data. Many NOAA maps are updated in real-time, providing up-to-date information on everything from weather patterns to ocean currents. This data is essential for a range of applications, from weather forecasting to disaster response.
- Customizable Layers: NOAA maps also offer a range of customizable layers, allowing users to view the information that is most relevant to their needs. For example, you might choose to view ocean currents, water temperatures, and marine biodiversity data all at once, or you might focus on a specific layer depending on your area of interest.
- Historical Data: In addition to real-time data, NOAA maps also offer access to historical data. This allows users to study past weather patterns, ocean currents, and other environmental factors, providing valuable insights into how our planet’s systems have changed over time.
- Interactive Features: Many NOAA maps also offer interactive features, allowing users to zoom in and out of the map and click on specific data points for more information. This can be especially useful for researchers and policymakers who need to analyze specific data sets in detail.
- Variety of Maps: NOAA produces a wide range of maps, covering everything from weather patterns to marine ecosystems. This variety allows users to explore and understand different aspects of our planet’s natural systems, and provides valuable insights into the ways in which these systems are interconnected.
- Accessibility: Finally, one of the most important features of NOAA maps is their accessibility. NOAA makes its maps freely available to the public, ensuring that anyone can access the information they need to understand and explore our planet’s oceans and atmosphere. This commitment to accessibility is a testament to NOAA’s mission to “understand and predict changes in the Earth’s environment, from the depths of the ocean to the surface of the sun, and to conserve and manage our coastal and marine resources.”
These NOAA maps provide a wealth of information on our planet’s oceans, atmosphere, and weather patterns, offering a range of benefits for those who seek to explore and protect our natural resources. Some of the benefits include:
- Supporting Scientific Research: NOAA maps are a critical tool for scientists studying the Earth’s natural systems. By providing high-quality imagery, real-time data, and historical data, these maps enable researchers to analyze complex environmental patterns and make predictions about future changes. For example, NOAA maps of ocean currents can help scientists study the impact of climate change on marine ecosystems, while weather maps can be used to track severe weather events and assess their potential impact.
- Enhancing Environmental Management: NOAA maps also play a critical role in environmental management. Policymakers and resource managers rely on these maps to make informed decisions about how to protect and conserve natural resources. For example, NOAA maps of marine biodiversity can help policymakers identify areas of ecological importance that should be protected, while maps of ocean acidification can inform decisions about how to mitigate the impact of this global issue on our planet’s marine ecosystems.
- Improving Disaster Response: NOAA maps are also an essential tool for disaster response. During severe weather events, such as hurricanes, NOAA provides real-time data and imagery to emergency responders, enabling them to make informed decisions about how to protect people and property. In addition, NOAA maps can help identify areas that are particularly vulnerable to natural disasters, allowing communities to take proactive steps to reduce risk and improve resilience.
- Enabling Recreation and Exploration: NOAA maps also offer benefits for recreational users and explorers. Whether you’re planning a sailing trip or a scuba diving expedition, these maps provide critical information about ocean currents, water temperatures, and other environmental factors that can impact your experience. In addition, NOAA maps of marine ecosystems can help you identify areas of particular interest, such as coral reefs or seagrass beds, enabling you to explore and appreciate these natural wonders.
- Encouraging Citizen Science: Finally, NOAA maps also support citizen science initiatives, enabling individuals to contribute to scientific research and conservation efforts. By providing access to real-time and historical data, these maps enable amateur scientists and volunteers to analyze and interpret environmental patterns, contributing to our understanding of our planet’s natural systems.
In conclusion, NOAA maps are an essential tool for exploring and protecting our planet’s natural resources. With their ability to support scientific research, enhance environmental management, improve disaster response, enable recreation and exploration, and encourage citizen science, these maps offer a range of benefits for scientists, policymakers, and the public alike. As we continue to face complex environmental challenges, NOAA maps will remain a critical resource for unlocking the secrets of our planet’s natural systems and ensuring a sustainable future for generations to come.
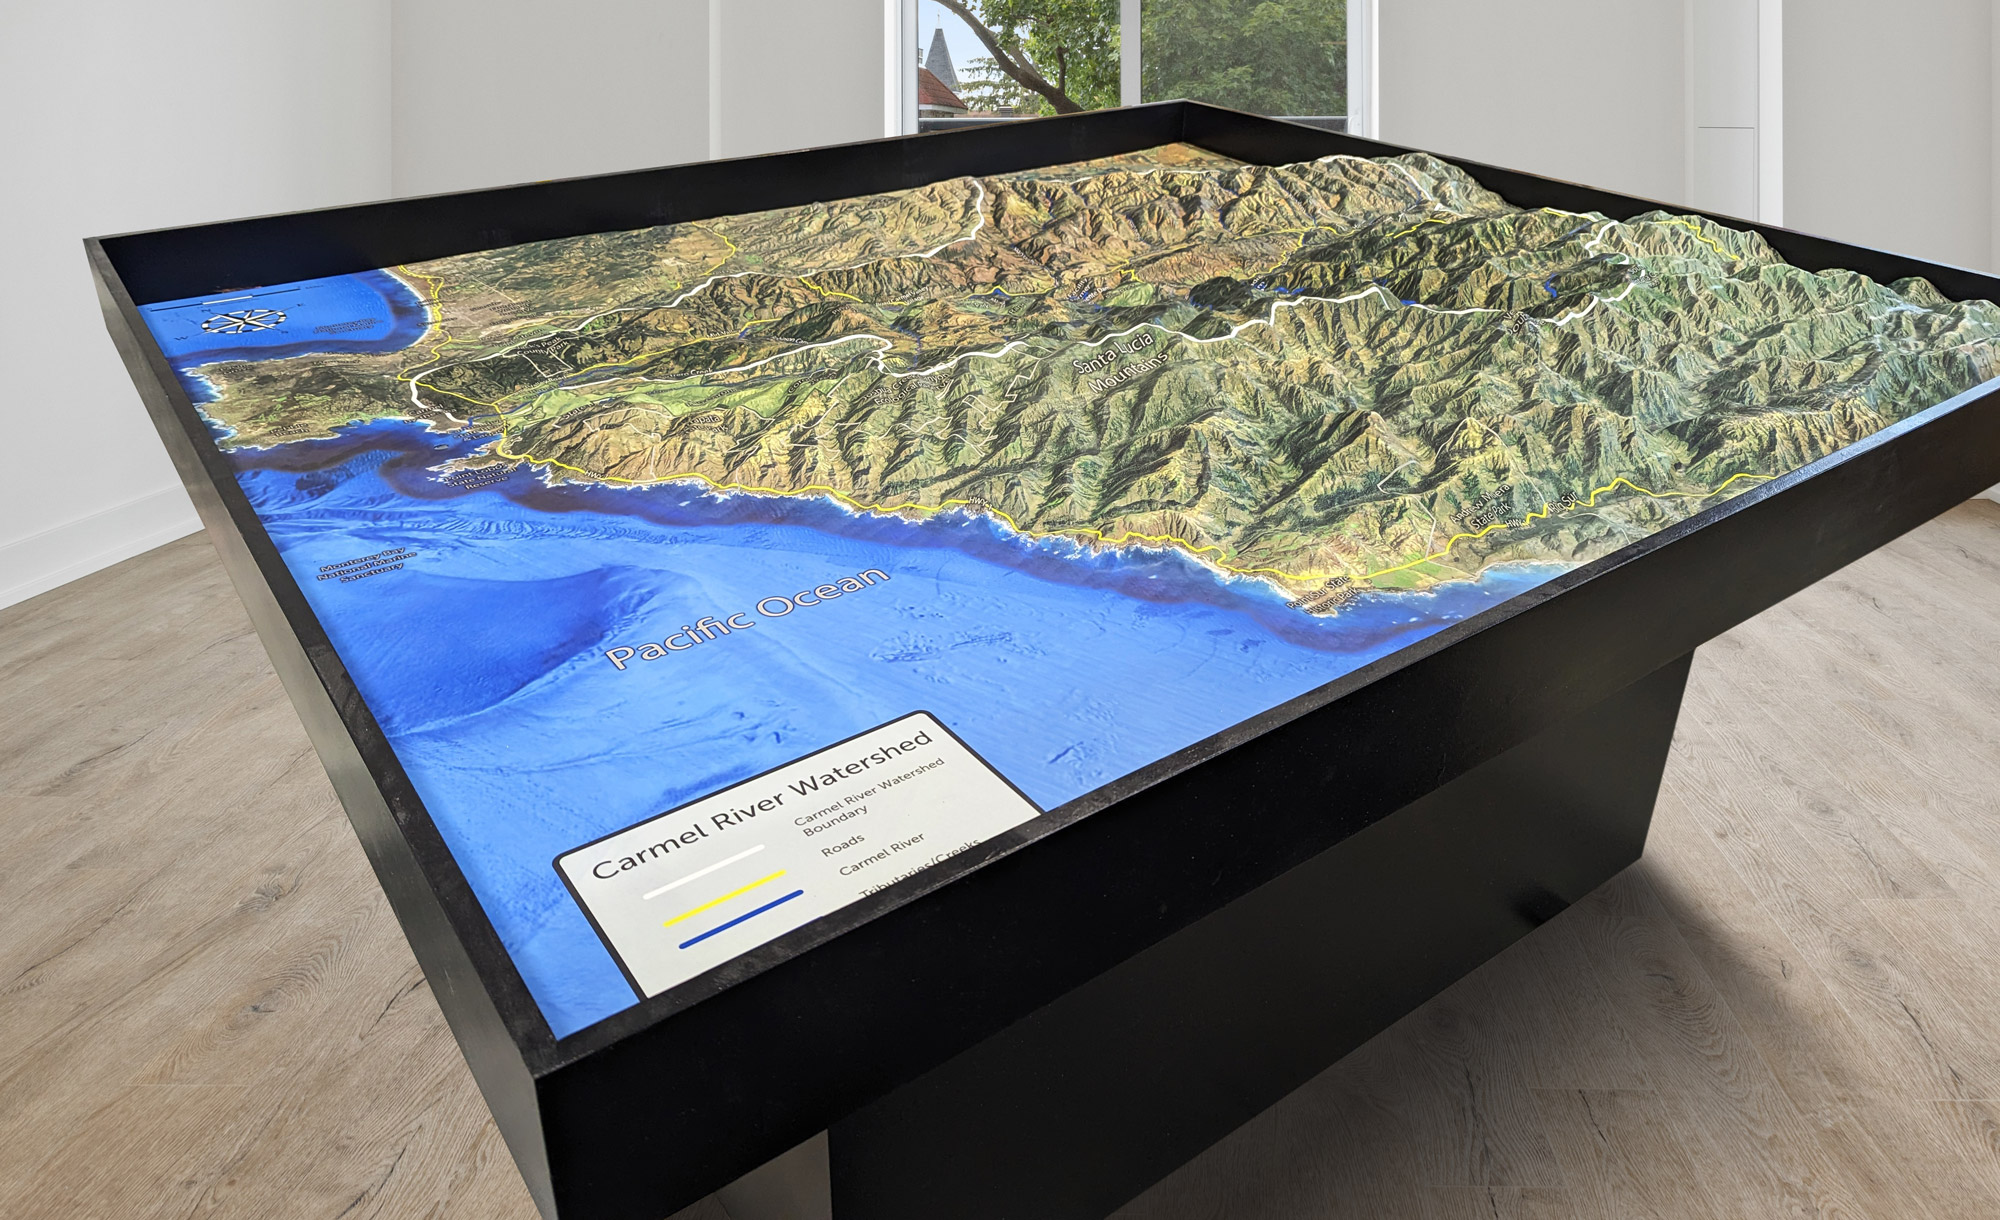
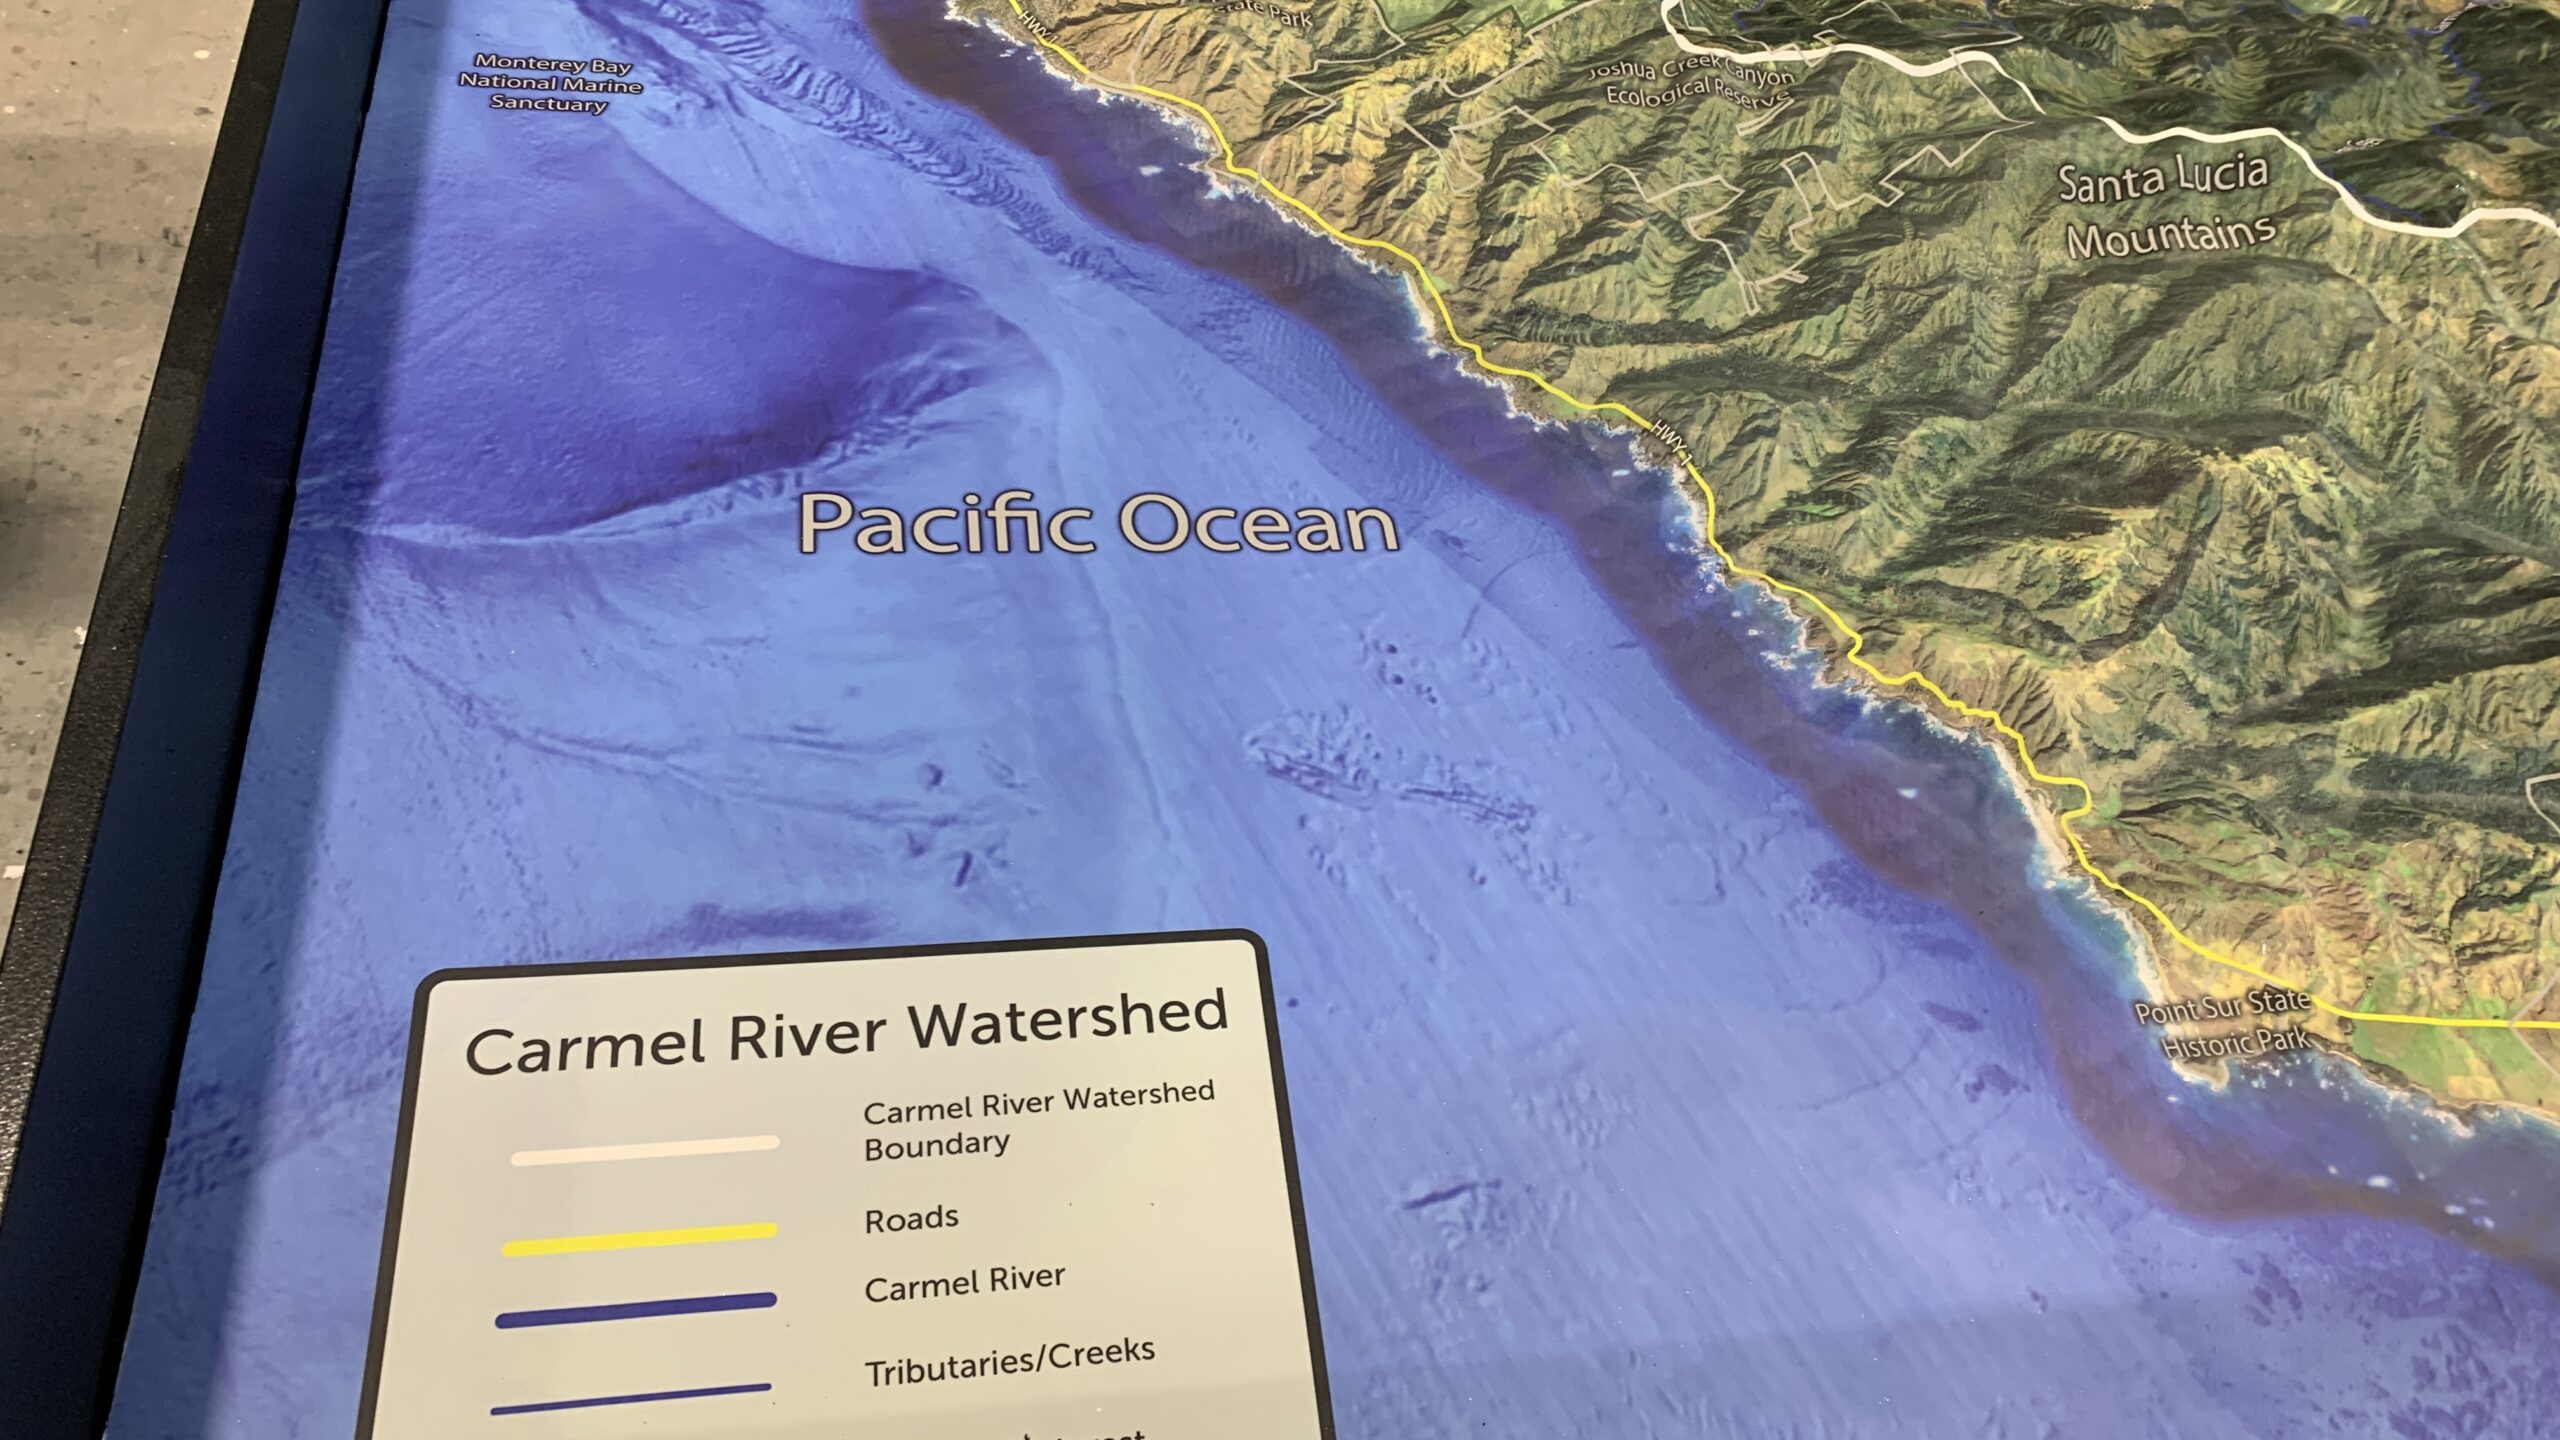
We meld top-of-the-line technologies with professional cartography resources to create stunning bathymetric maps and models. Our expertise in 3D printing enables us to allow more markets to benefit from purchasing durable, portable, and affordable models.
Sample 3D Bathymetric Maps
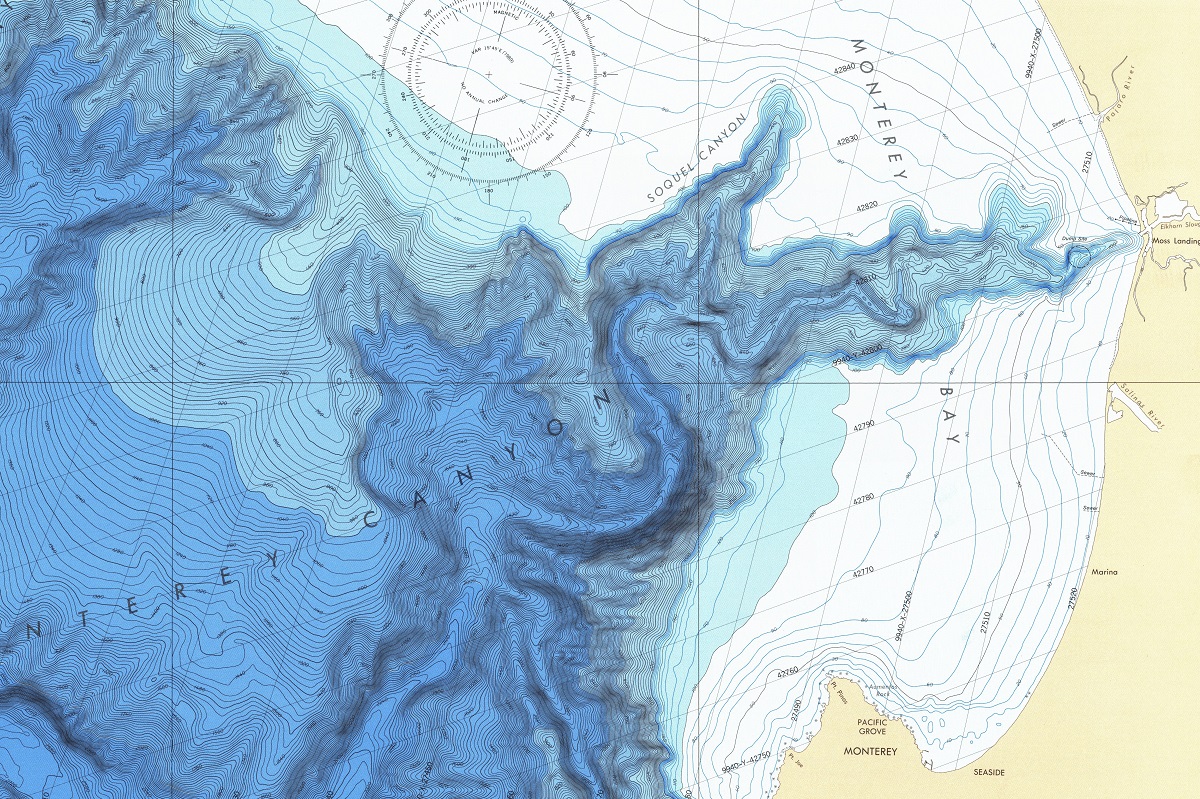
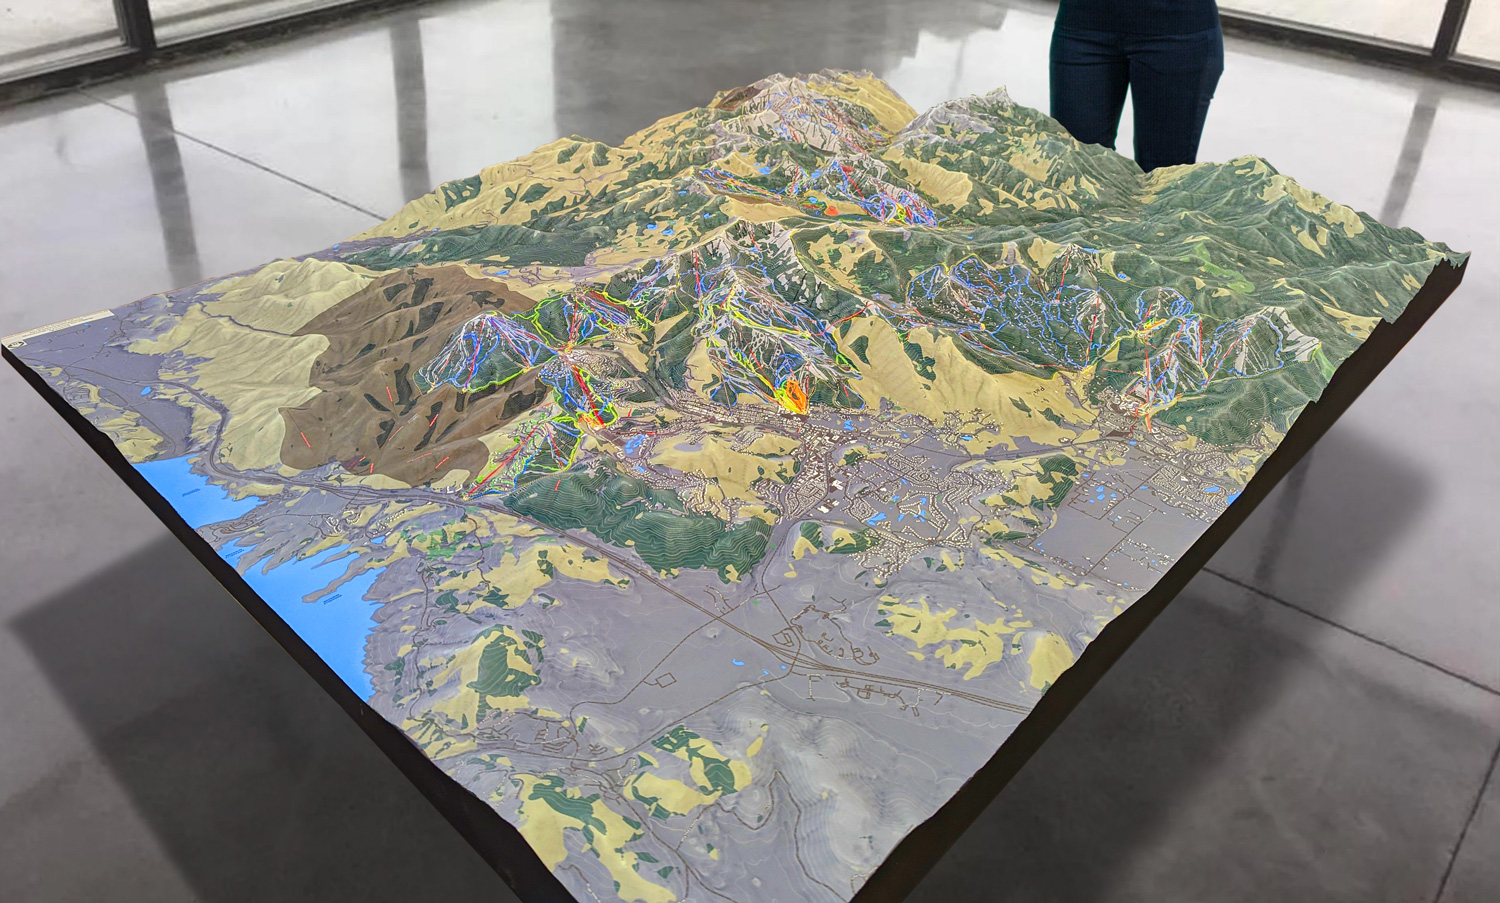
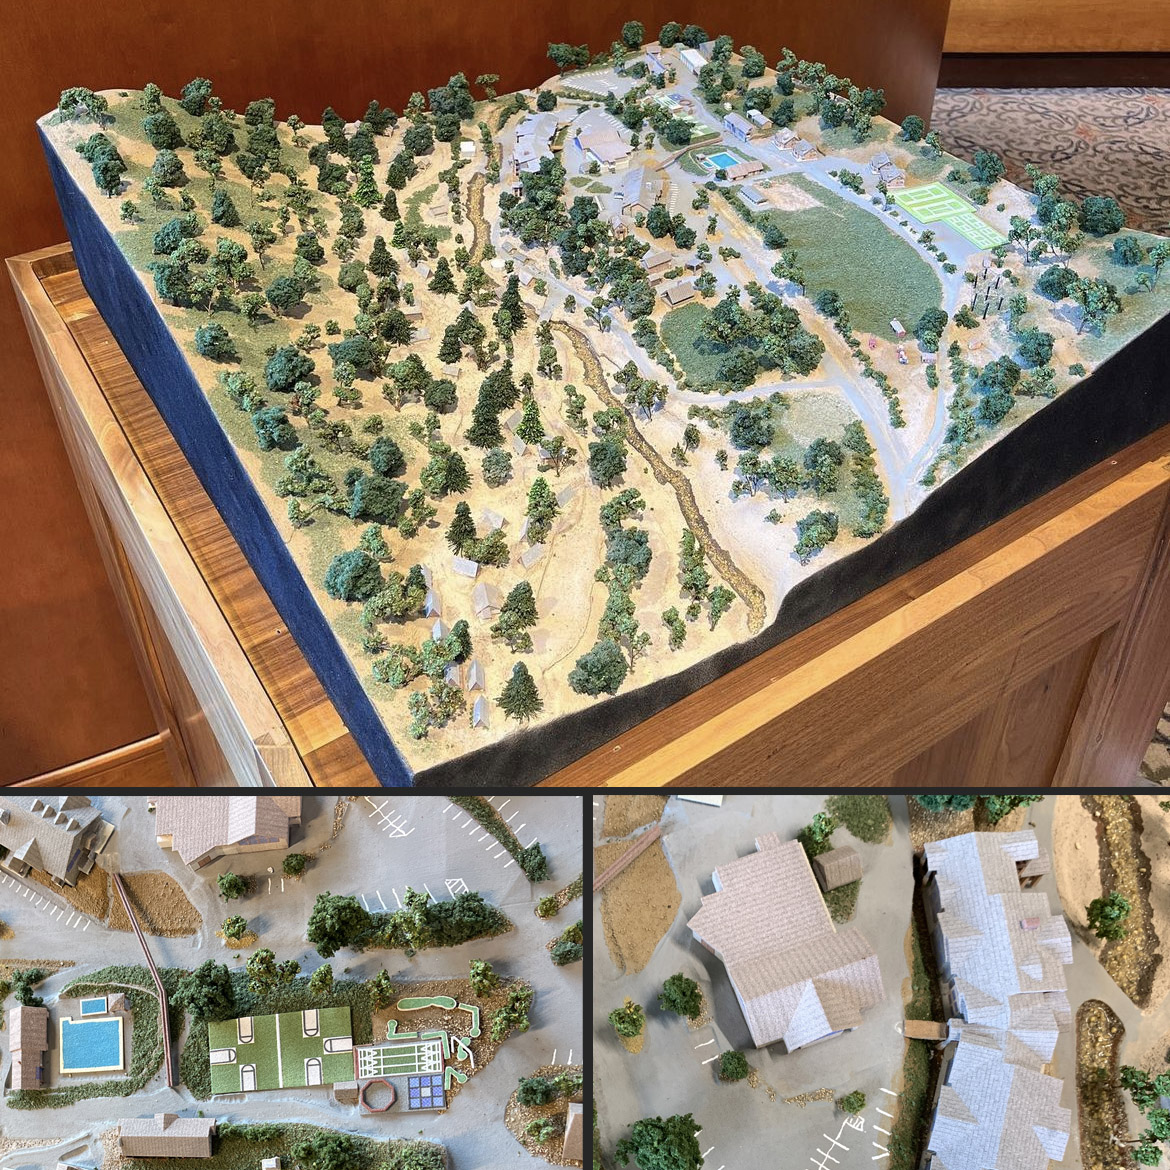
This massive 3D-printed map topography model of Monterey Peninsula Regional Park District is 72"x84". The custom pedestal is 30" tall. This map also features a water drain hole and hose that drains into a bucket for water flow demonstrations. A matte hard-coat finish protects it from UV, liquid and stains.
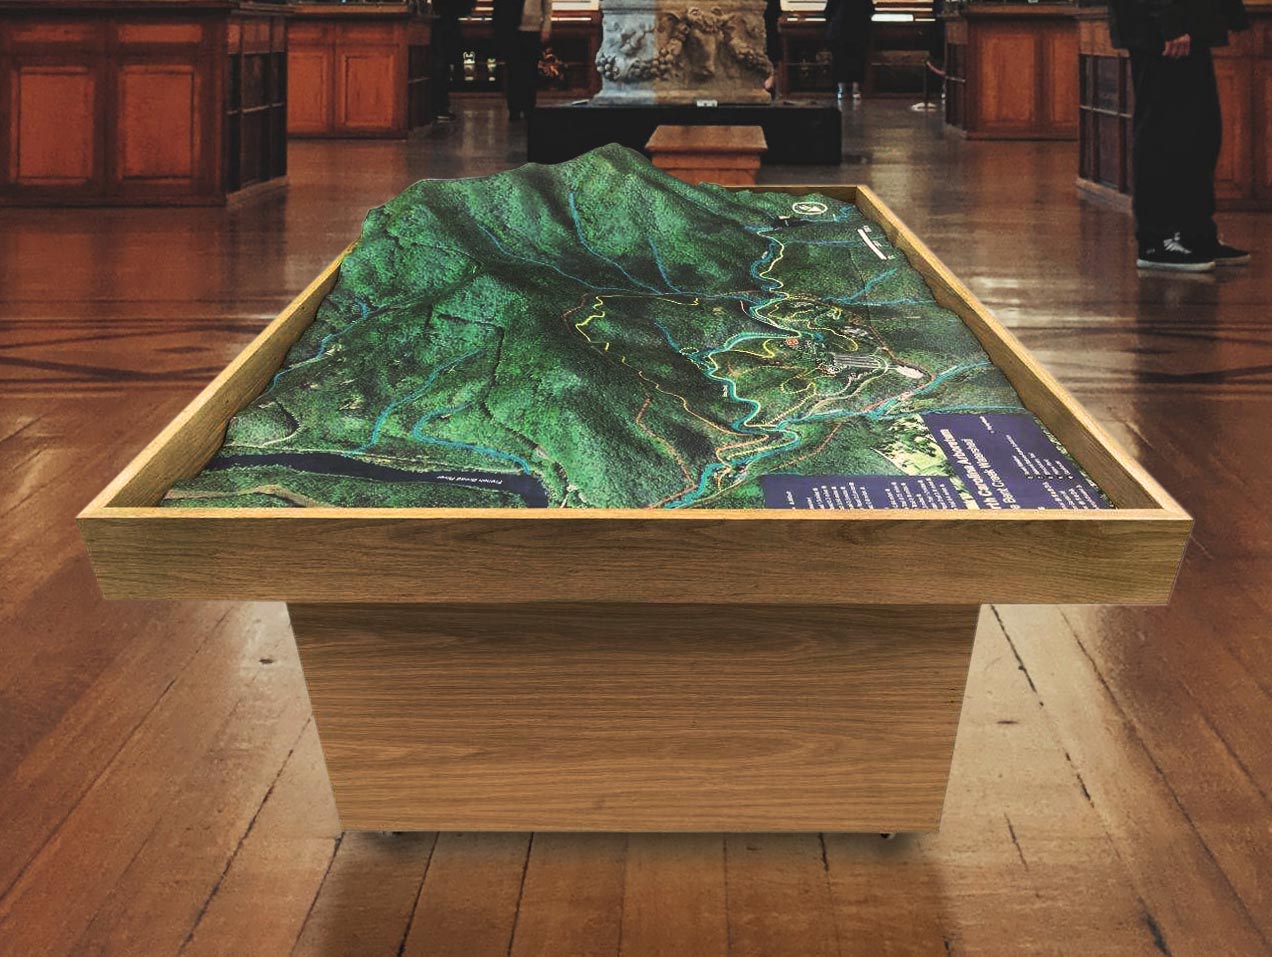
Monterey Watershed Map
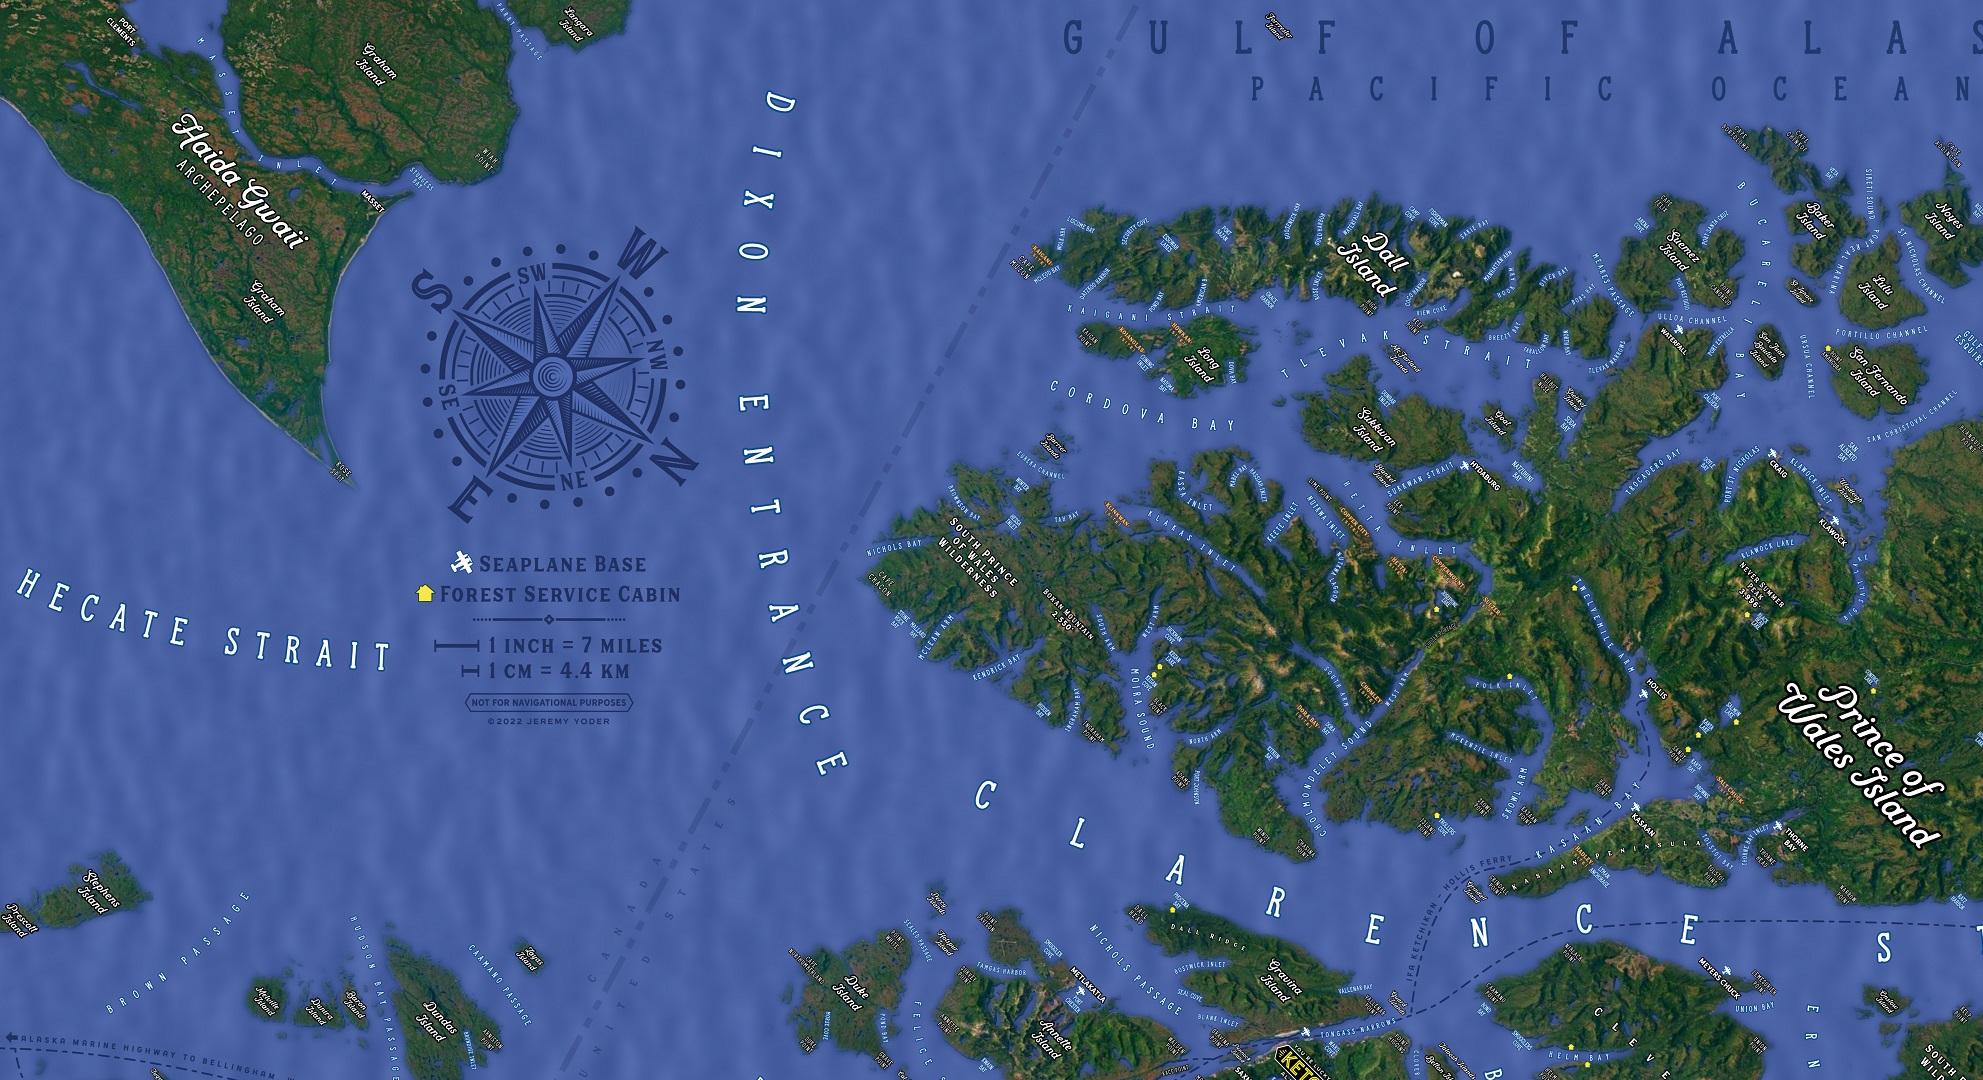
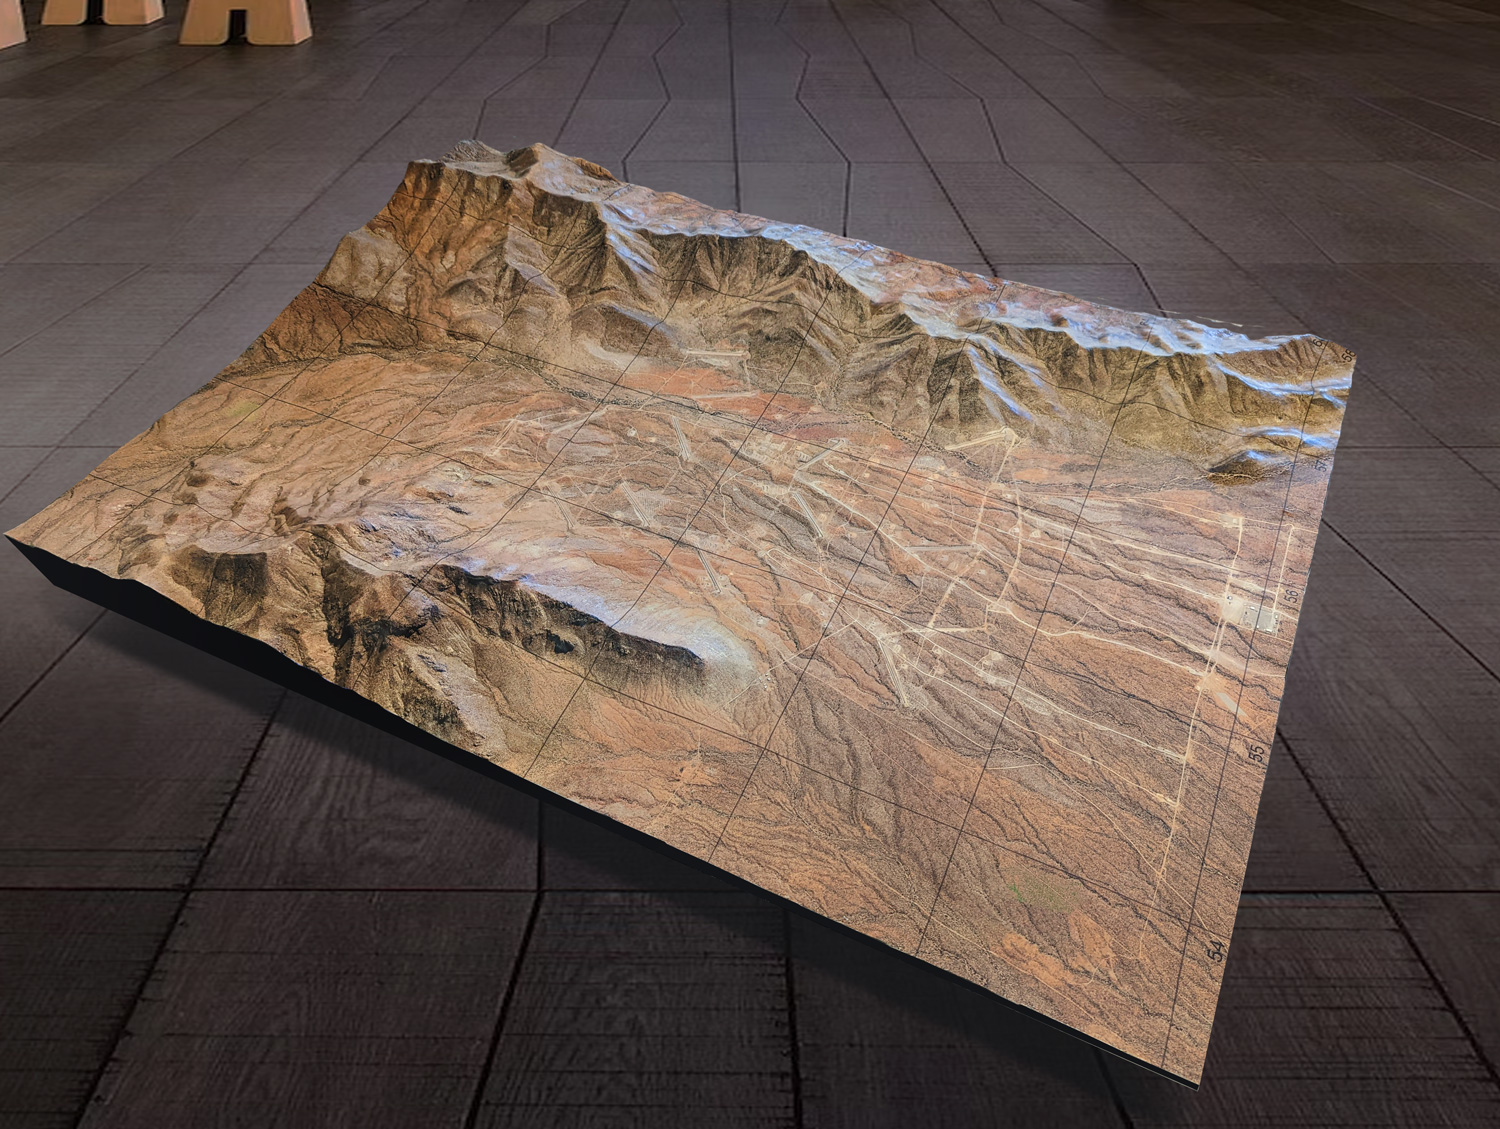
Alaska Physical Map
Alaska Physical Map
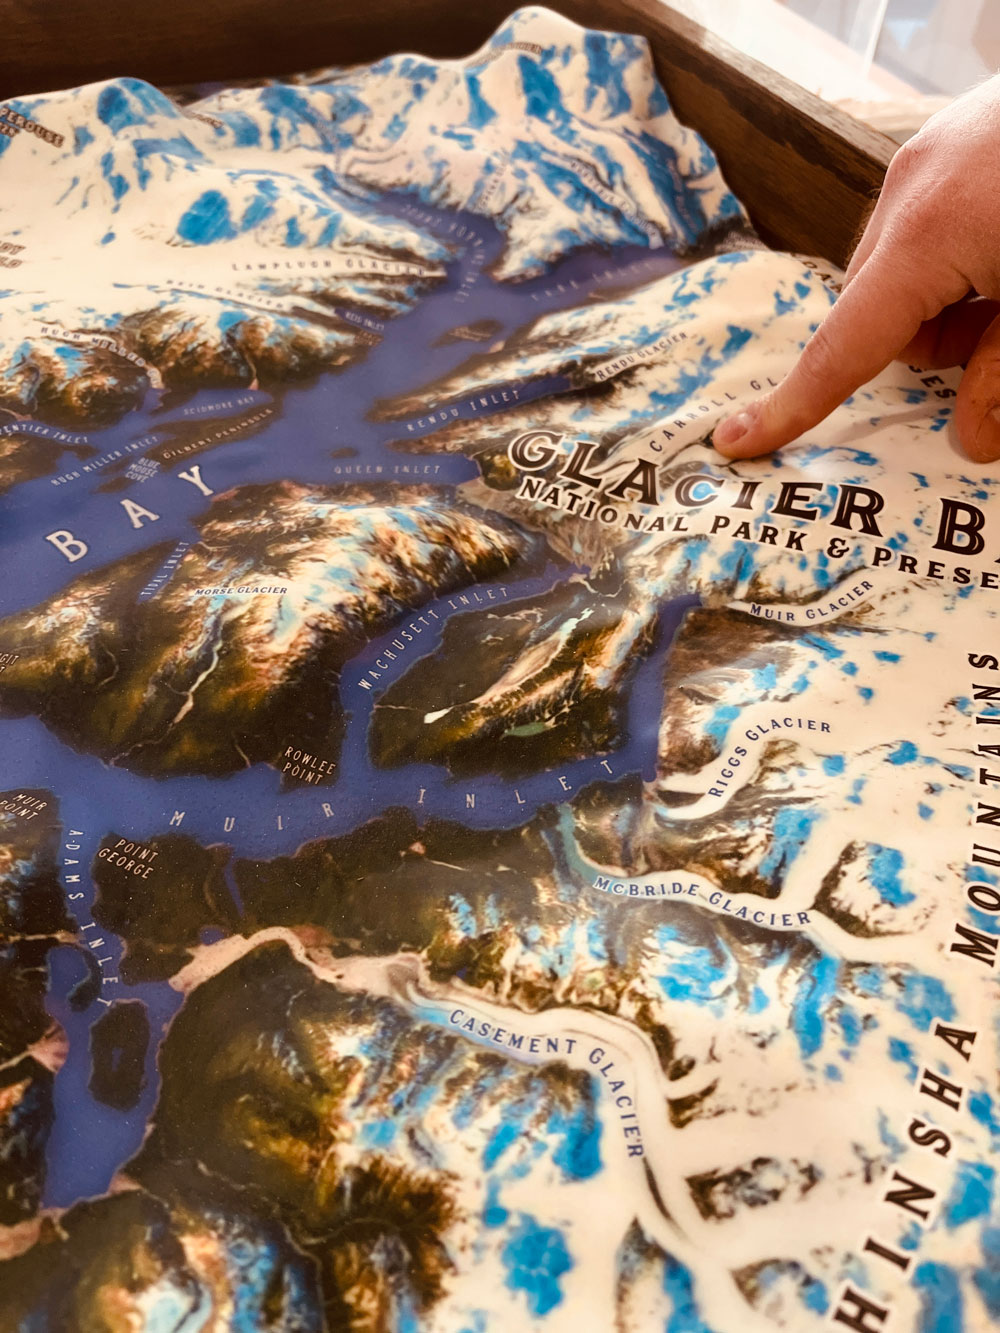
Alaska Physical Map
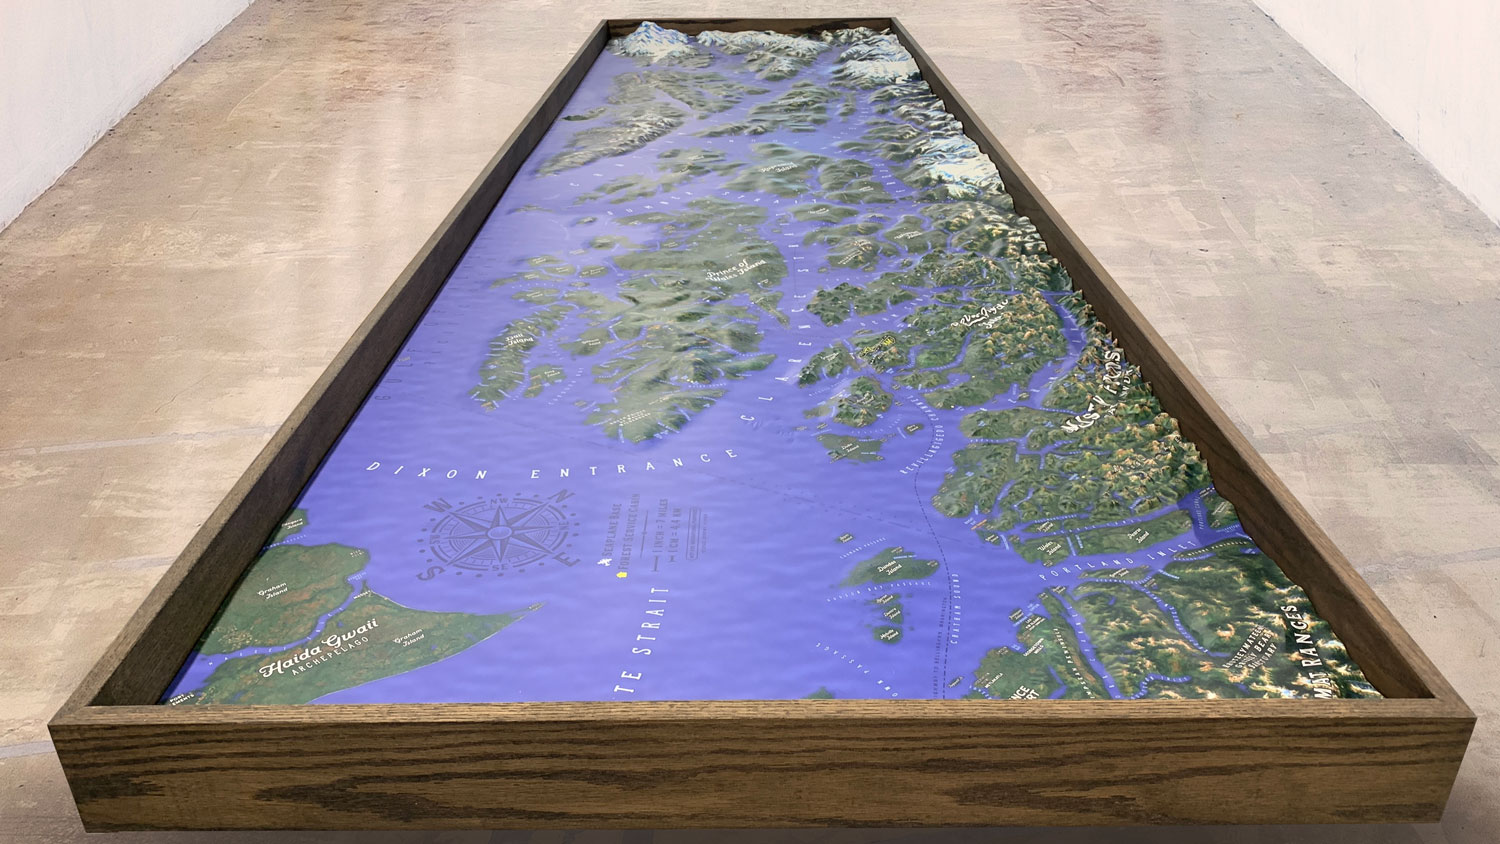
Alaska Physical Map
Gallery of eCommerce 3D USGS Topographic Maps and 2D Canvas Prints
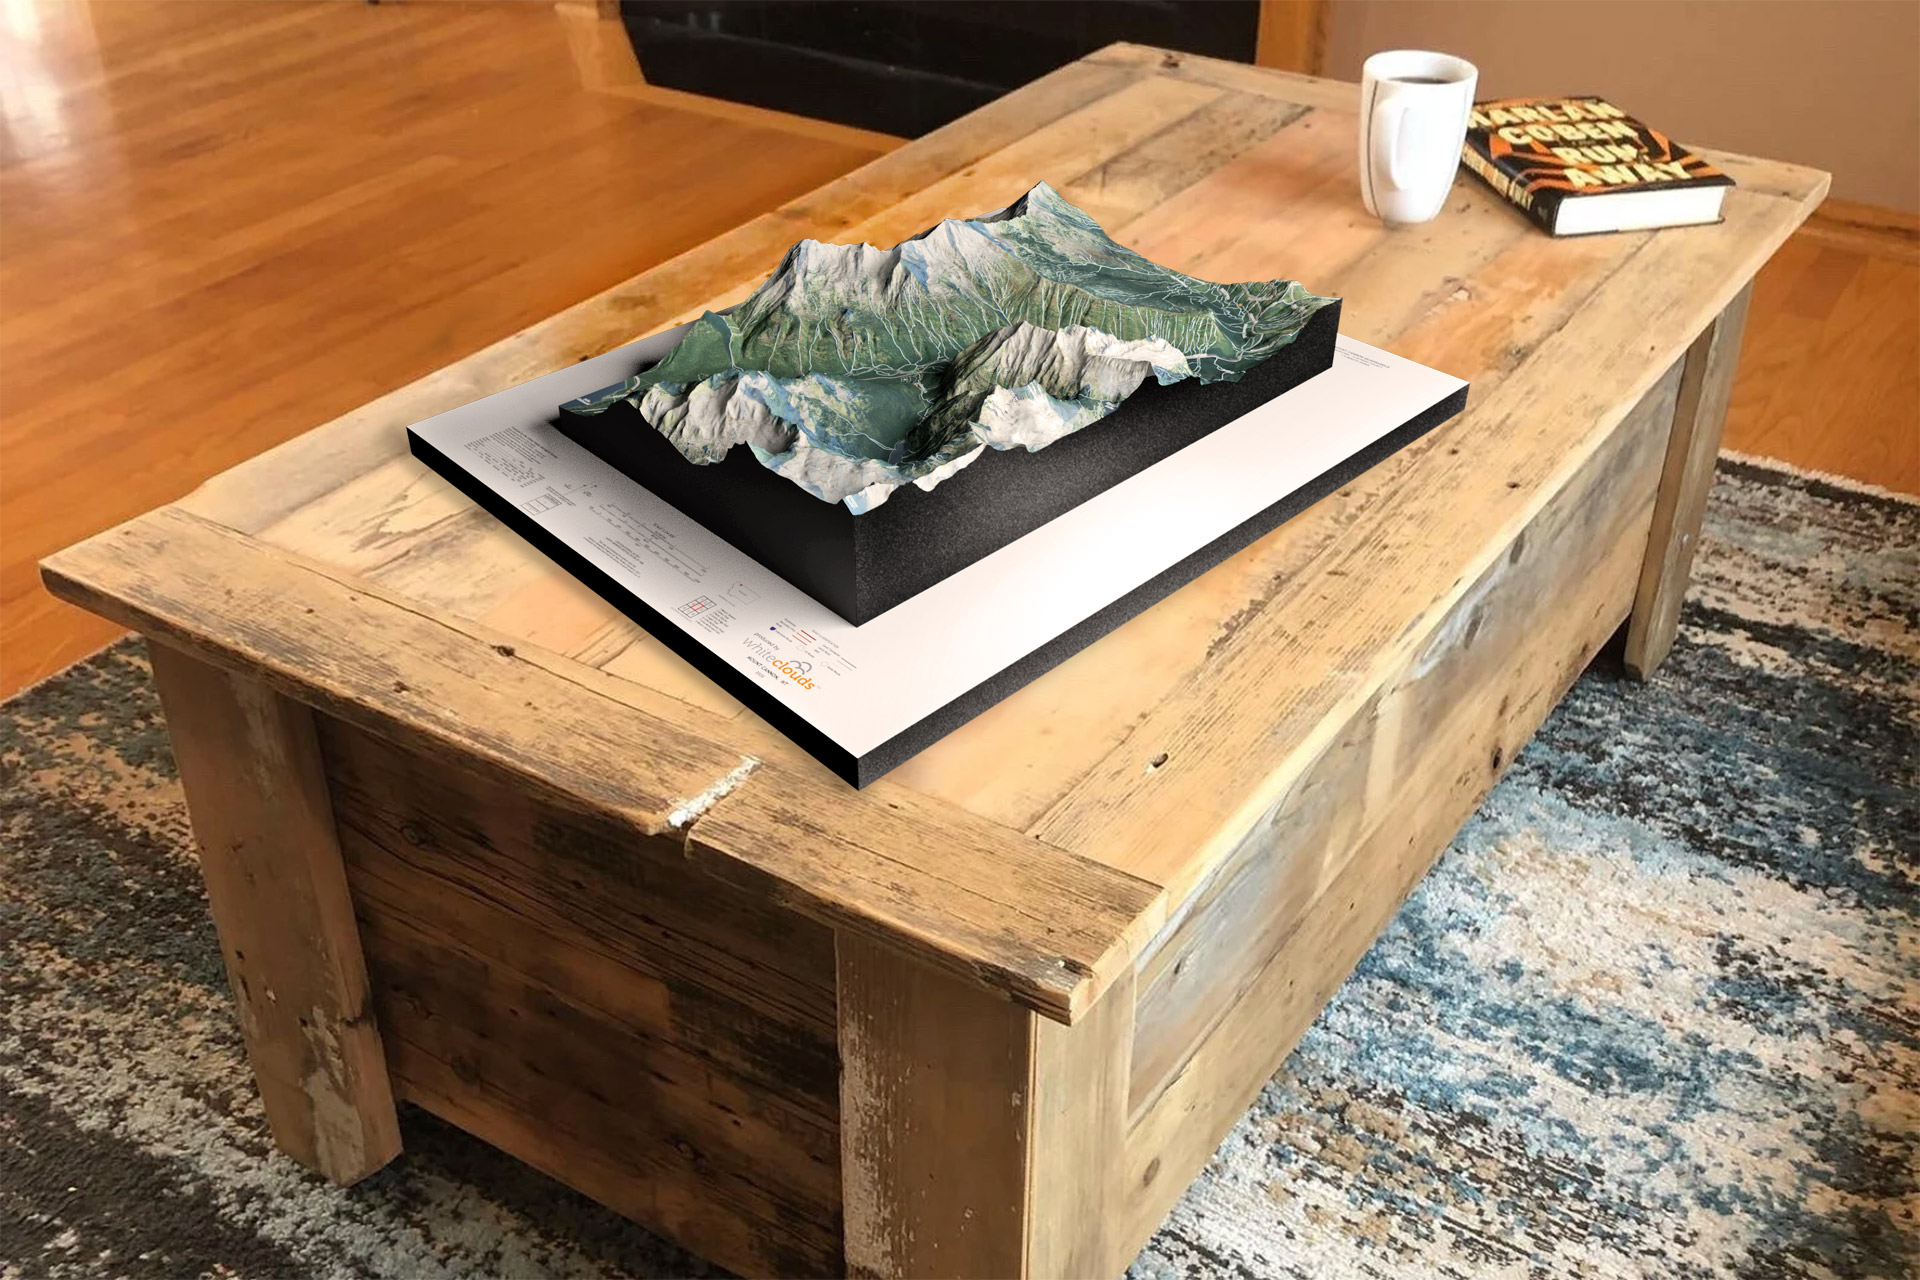
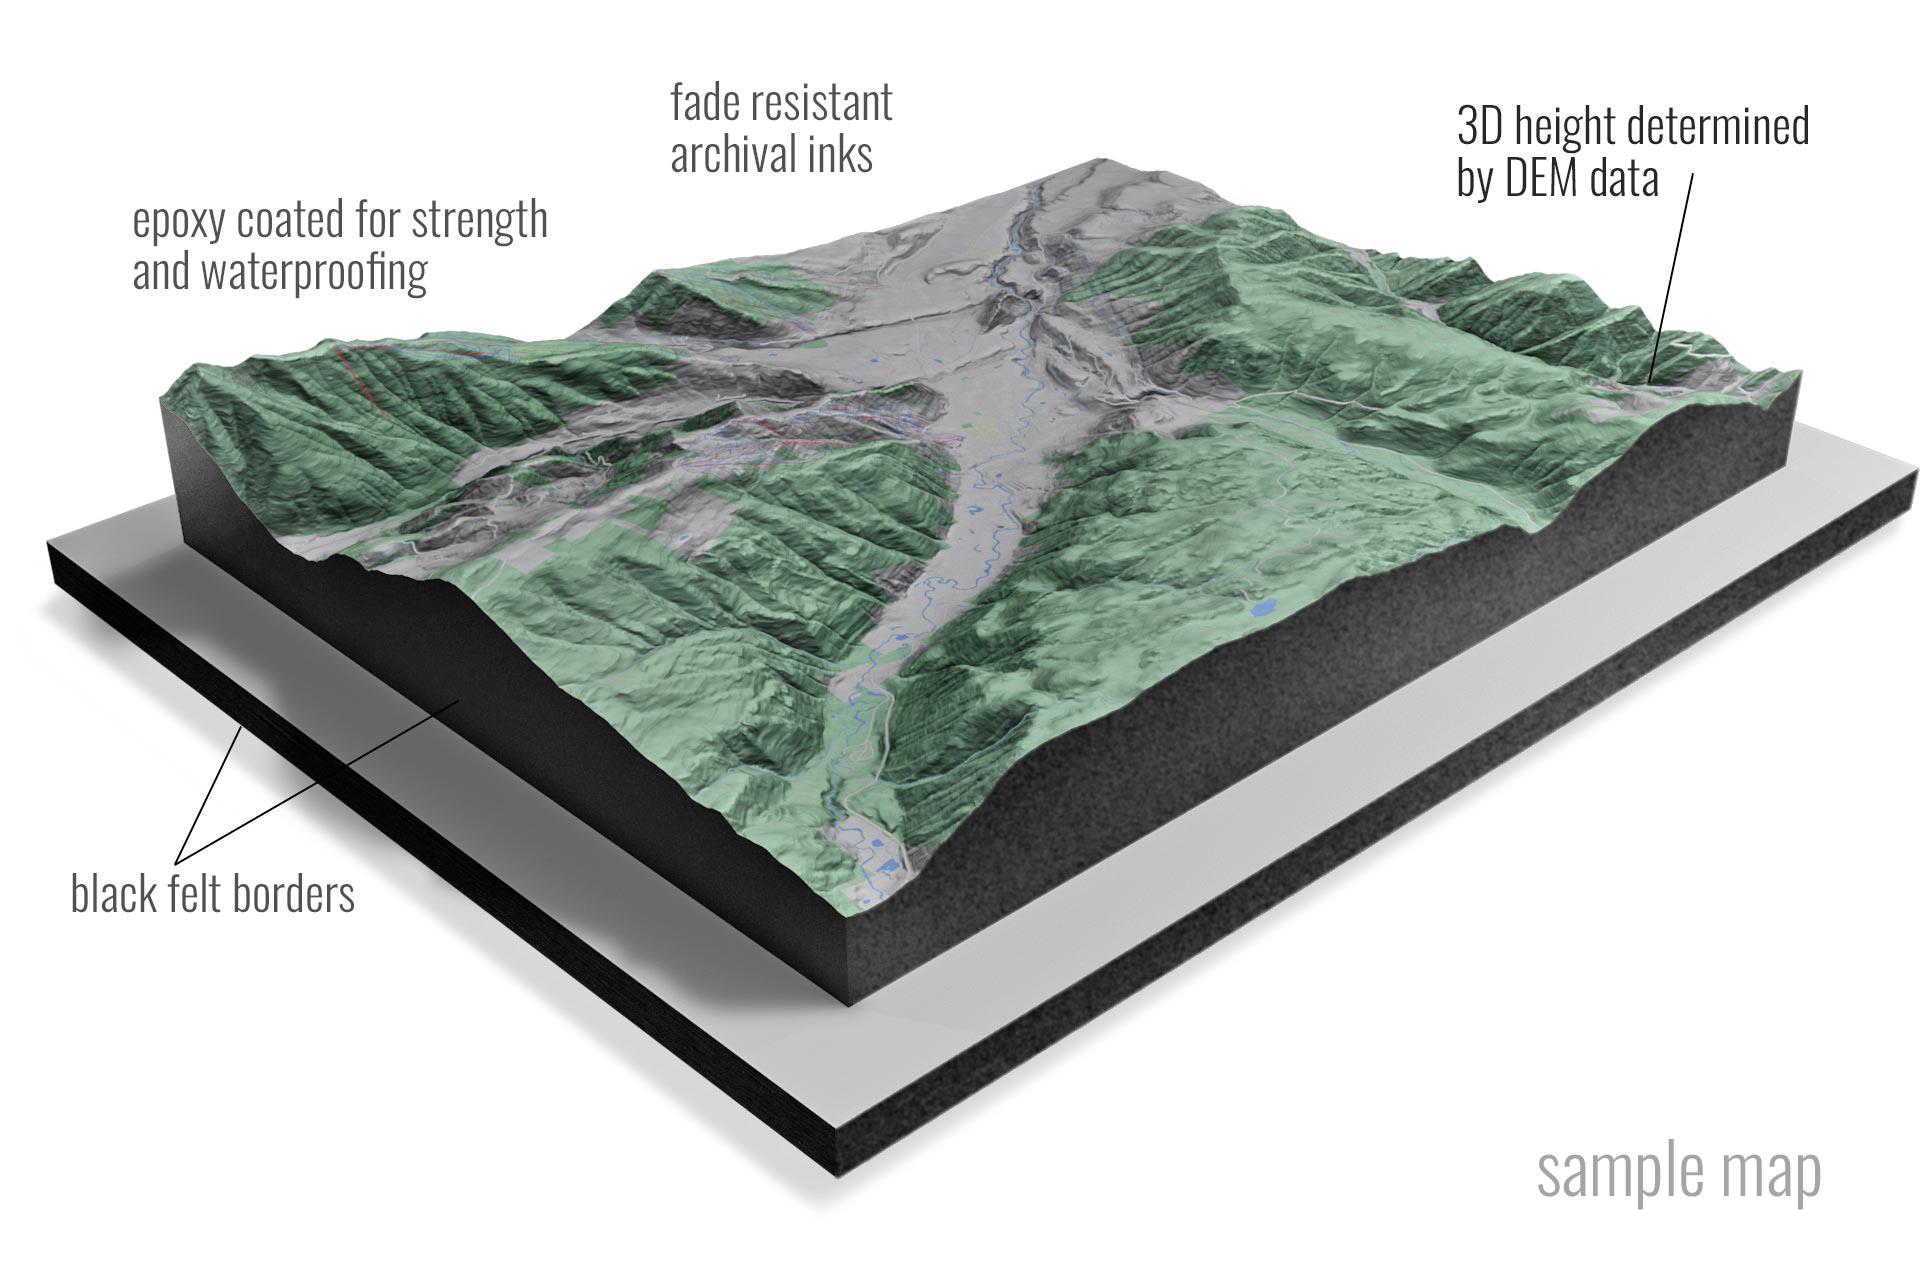
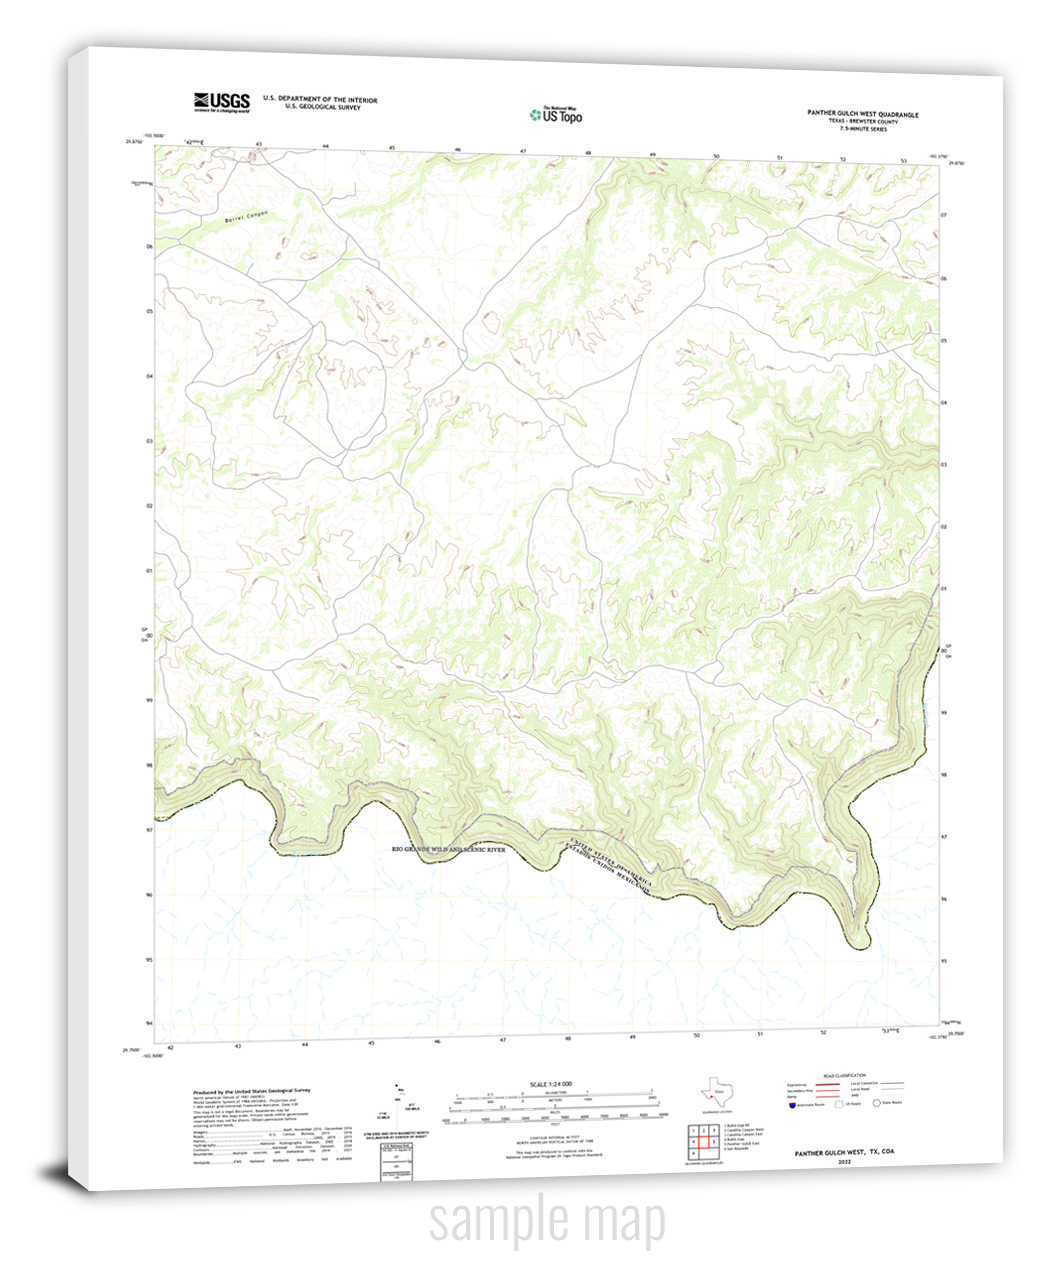
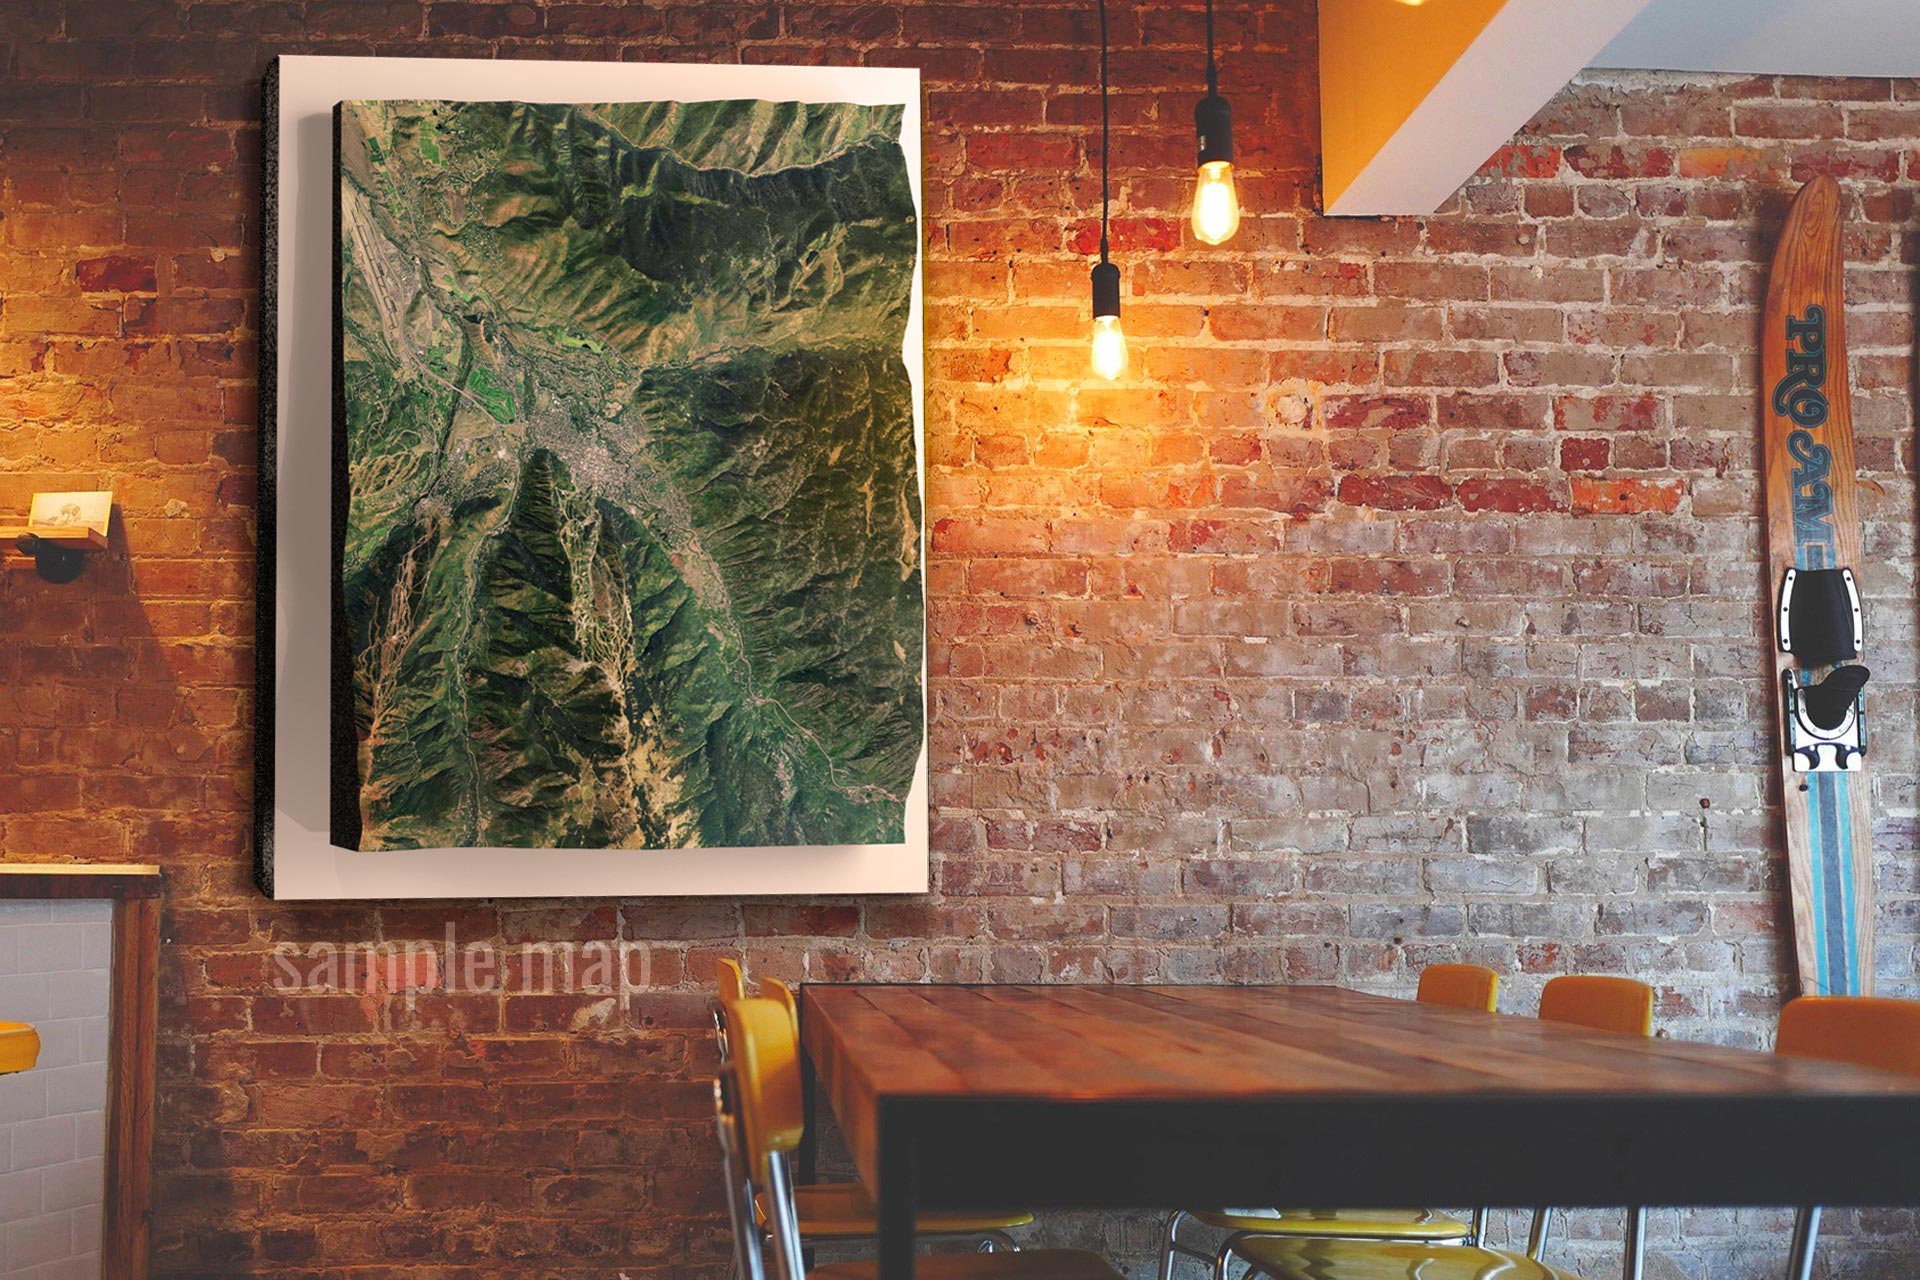
Shop WhiteClouds 3D USGS Topographical Maps with 65,240 three-dimensional maps to choose from. There are also 361,902 3D USGS Historical Topographical Maps to choose from. These maps are not flat. They are three-dimensional, with the height being determined by Digital Elevation Model (DEM) data. These 3D maps are built by combining satellite imagery data from the USGS and DEM data. Make a statement with these beautiful 3D map images from every part of the United States.
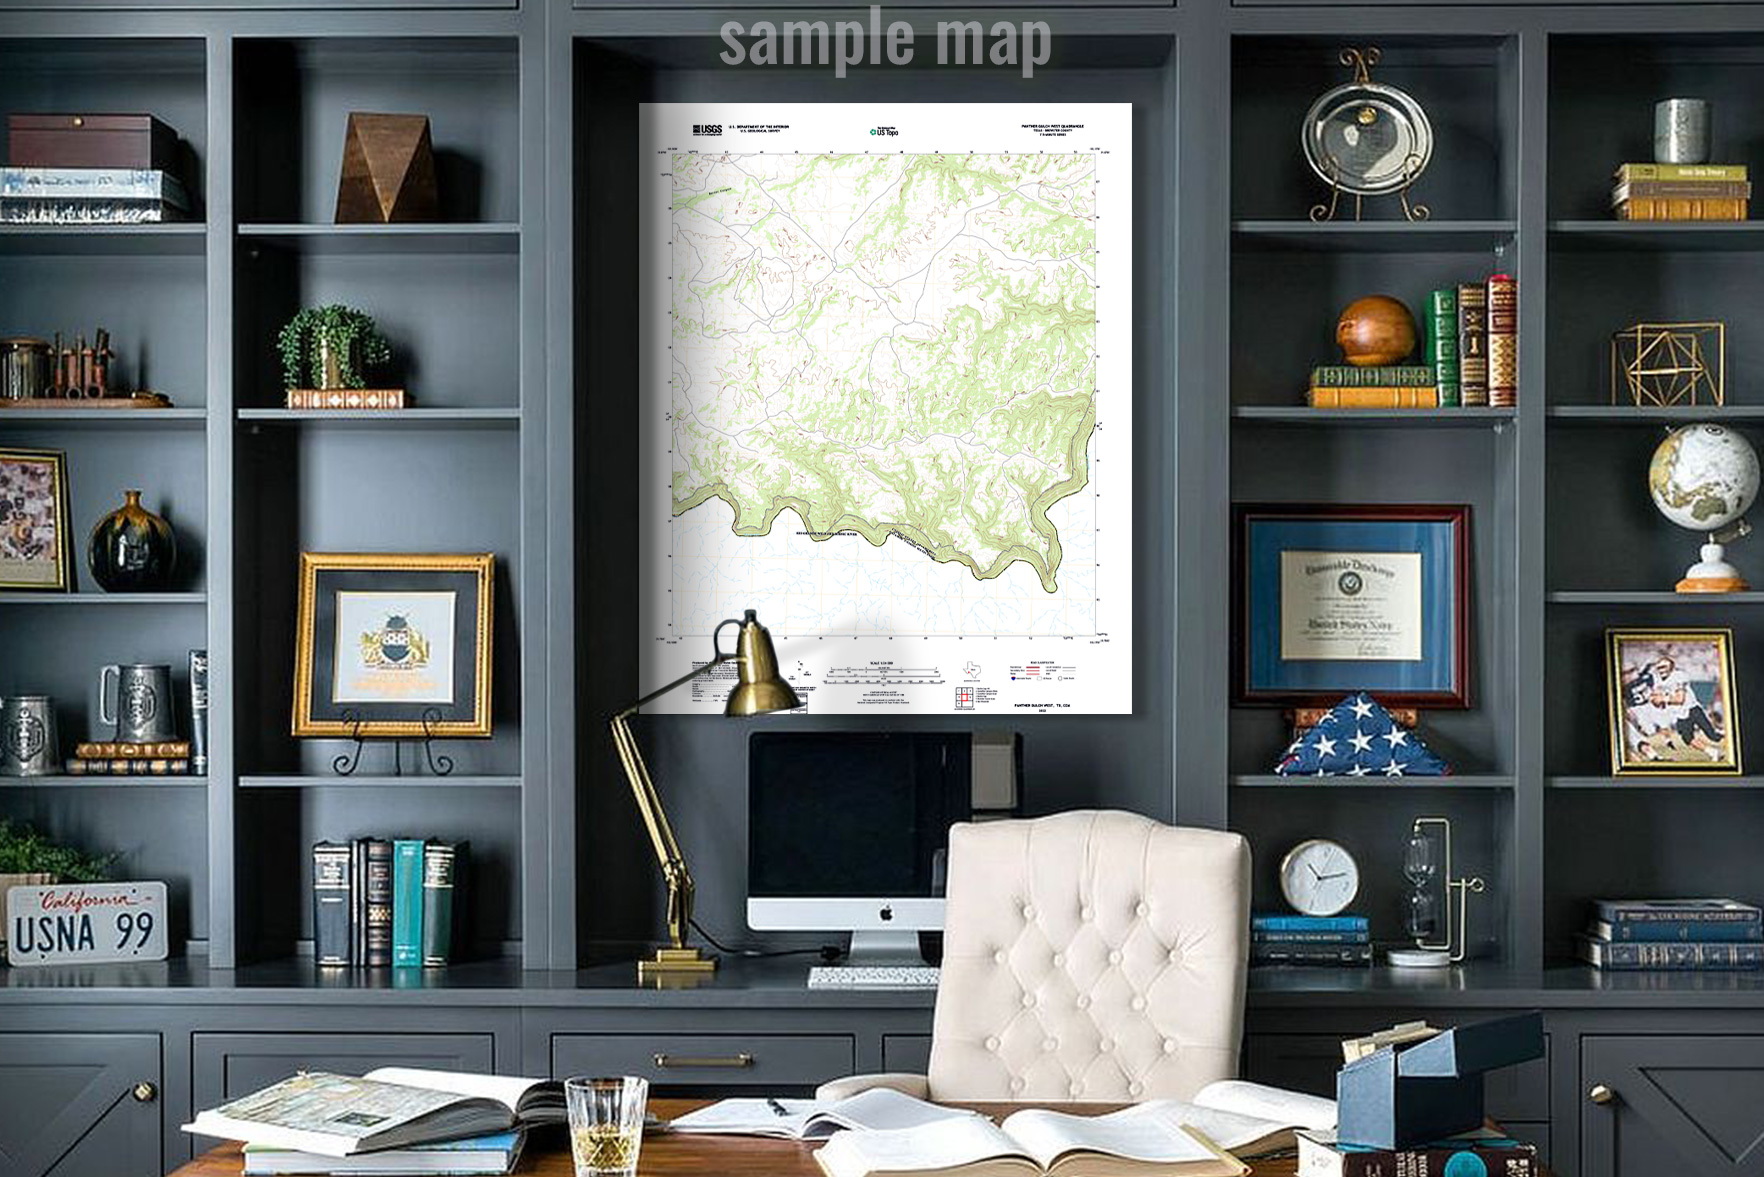
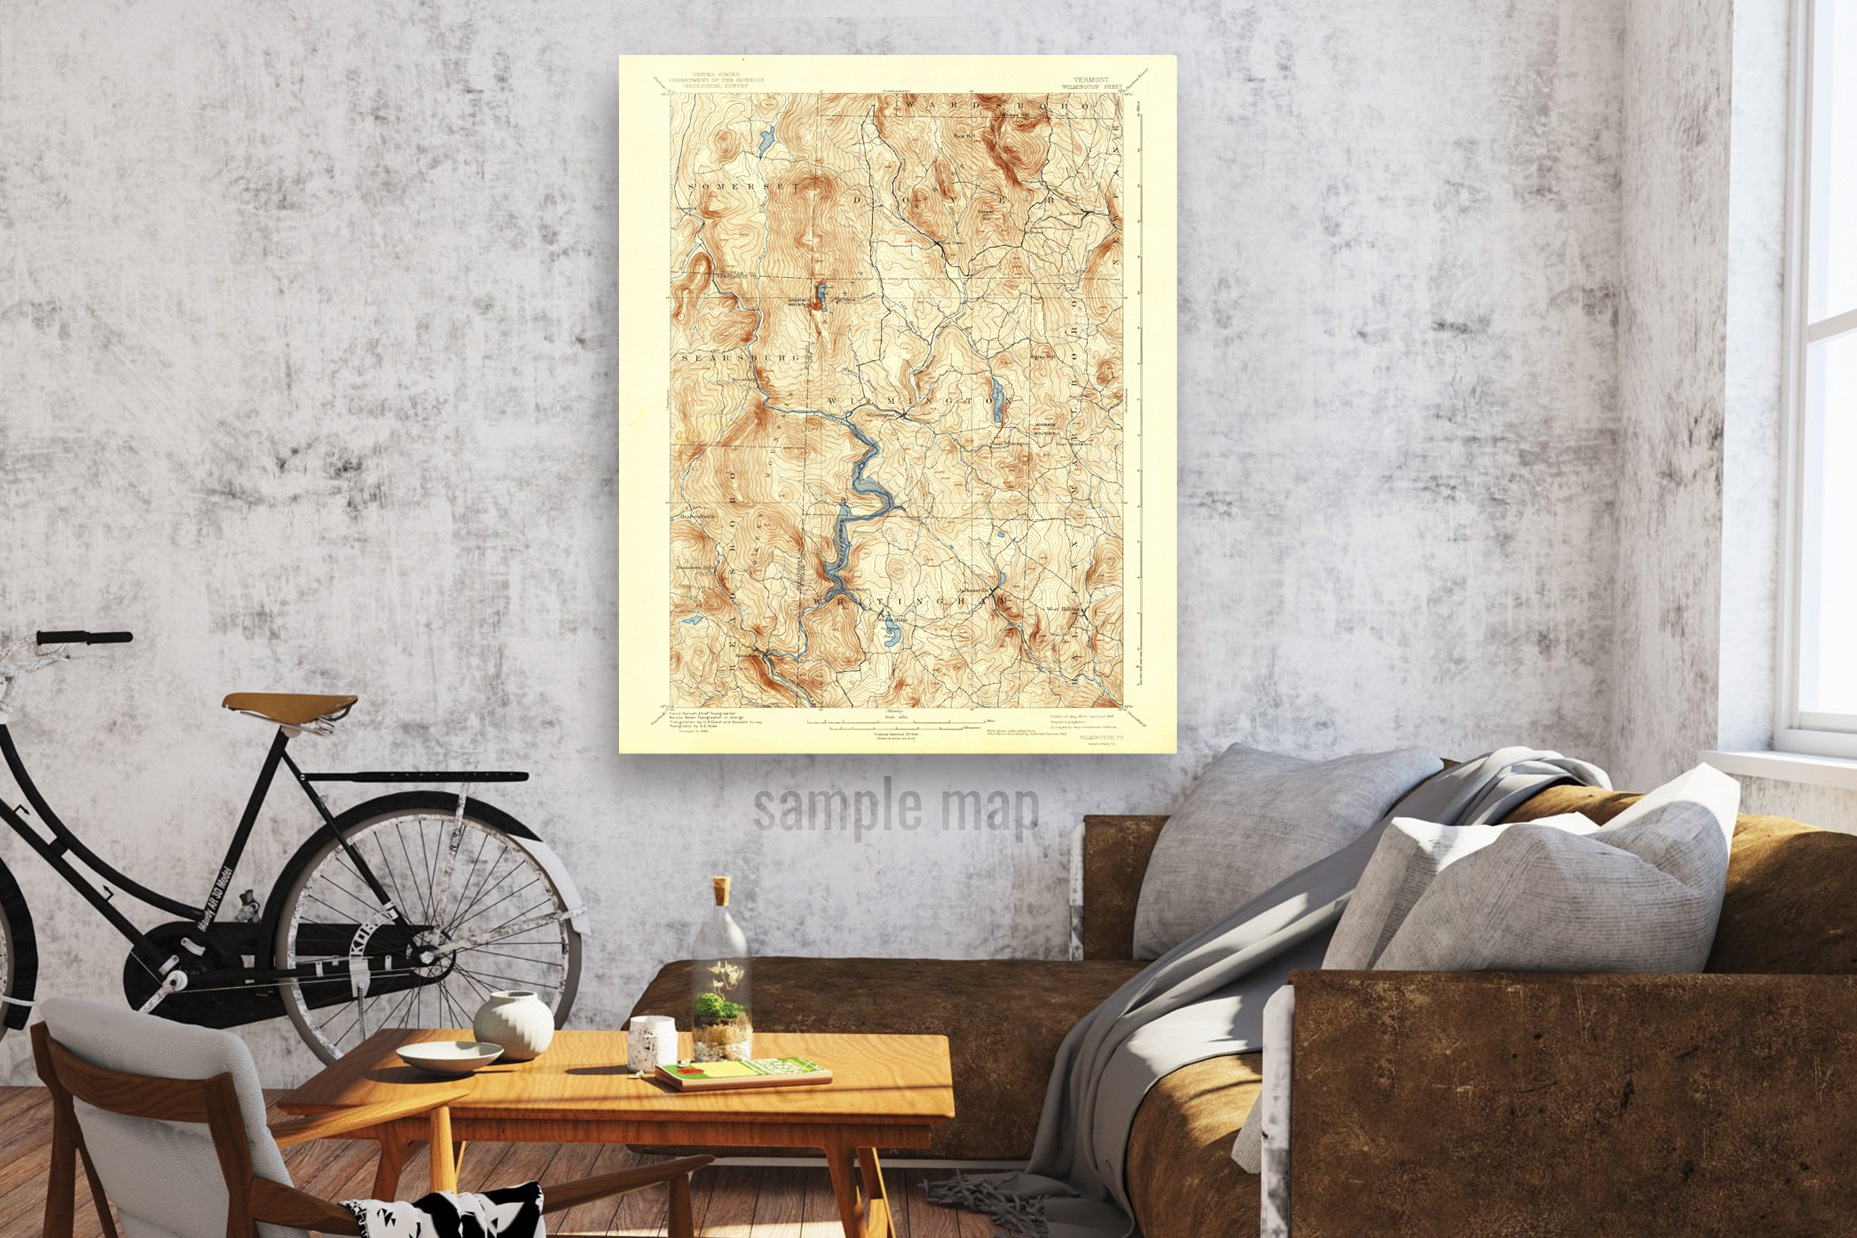
Shop WhiteClouds 2D USGS Topographical Canvas Print Maps with 427,142 maps to choose from. These canvas print maps have both current and historical USGS topographic maps (from 1882 to present). There are also satellite and terrain canvas print maps that use the USGS coordinates.
Gallery of Custom 3D Map Projects
How 3D NOAA Maps are Made
There are several techniques used to create 3D NOAA maps, and the process can vary depending on the scale and complexity of the map. However, the basic steps involved in making a NOAA map are as follows:
- Create a base map. The first step in making a NOAA map is to create a base map of the area. This can be done using imagery from a standard two-dimensional map, aerial photographs, satellite images, or WhiteClouds can do it for you.
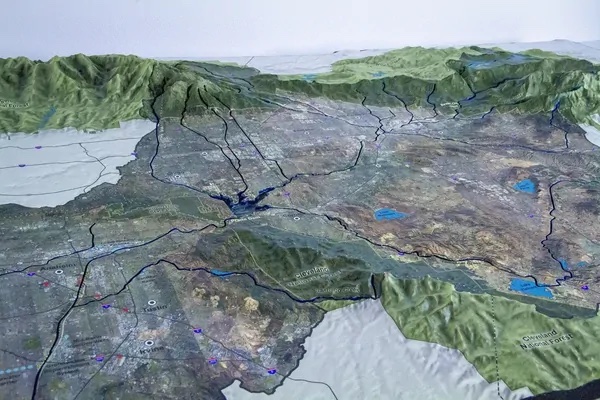
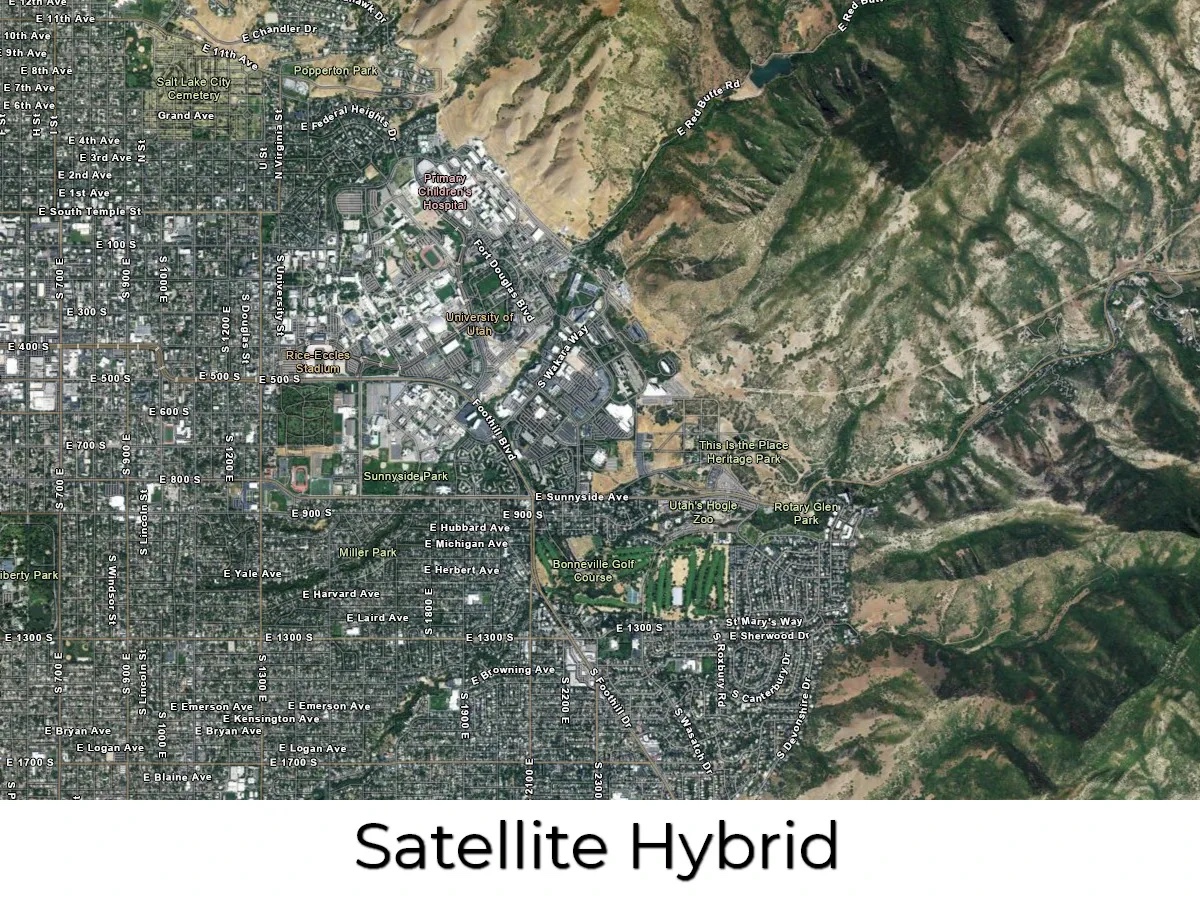
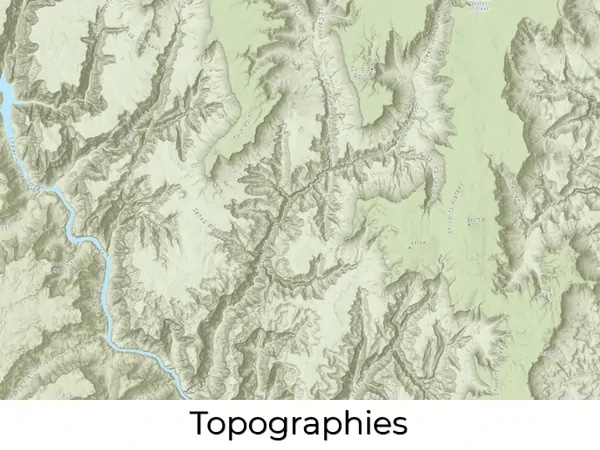
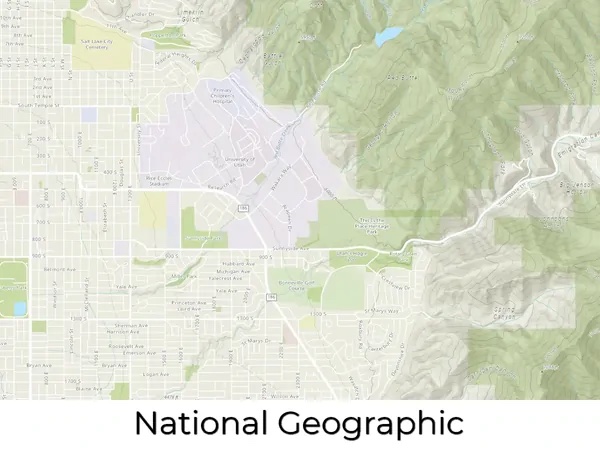
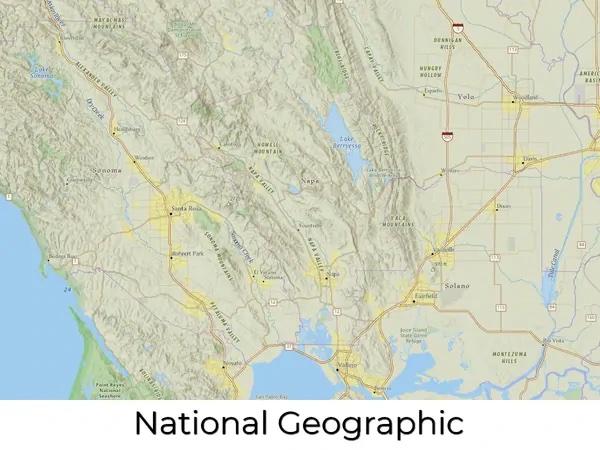
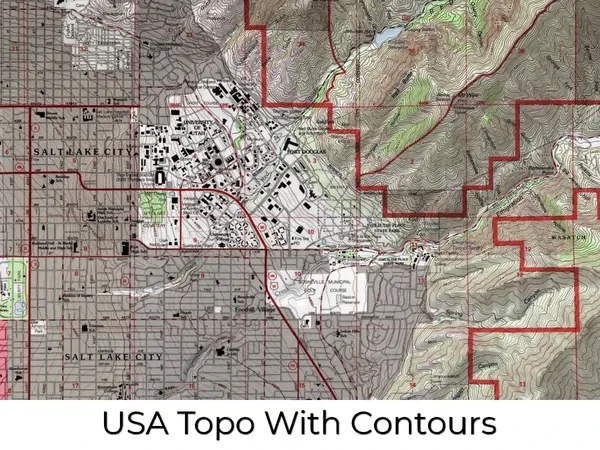
- Determine the design style of the map. There are over 40 styles to choose from. Popular ones include satellite, terrain, topography, raised relief, and satellite hybrid.
- Add any special design features not included in the source map, such as special features, landmarks, legends, roads, cities, symbols, etc.
- Add elevation data. The next step is to add elevation data to the map. This can be done using a variety of techniques, such as contour lines, shading, or digital elevation models (DEMs).
- Print the Map Overlay. Latex vinyl materials are used for the map details and colors.
- Create the 3D physical map. Once the elevation data has been added to the map, a physical 3D structure is created that replicates the topography of the area. This can be done using 3D printed plastic or thermoformed molding/casting. Either approach is combined with the Vinyl overlay.
- Finish the map. This is where any excess materials are cutaway. Any special sealers, matte finishes, hardeners, or UV protection is applied. Wood, metal or plastic bases are built and border flocking may be applied.
Features & Benefits of NOAA Maps
- Remarkably Strong: You can drive a 1-ton truck over our NOAA maps.
- Precision: We print our physical maps to scale as accurately as are the original files and images.
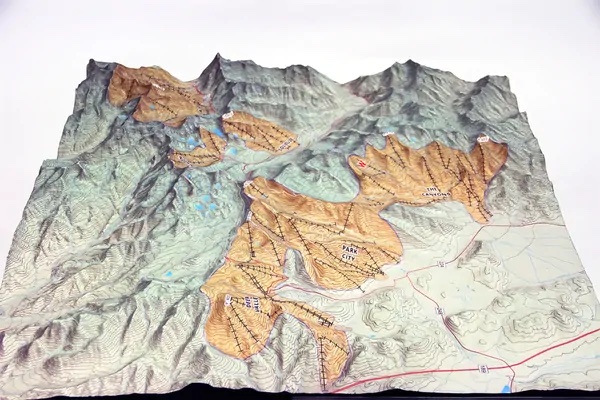
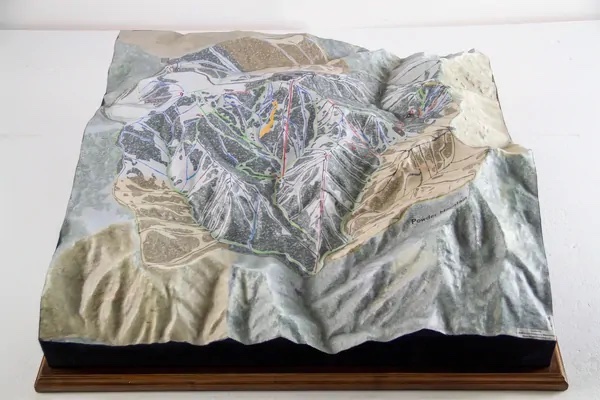
- Excitement: It is much easier to get excited about 3D views of your ski runs or trails than flat printed maps.
- Stain and Water Resistance: Spills are easy to wipe up.
- Communication: NOAA maps are simple to understand with a quick glance.
- Affordability: Our 3D technologies allow you to order custom 3D maps for a reasonable price.
- Testability: 3D technologies are affordable enough to test designs, such as several versions of planned work.
- Consistency: Using modern print and casting technologies, you can easily recreate identical 3D maps.
- Portability: We use lighter materials than what was available in the past, making our NOAA maps easy to transport.
Videos of 3D Maps
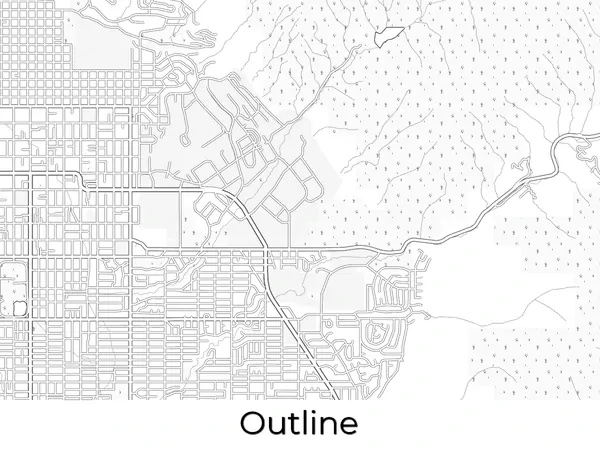
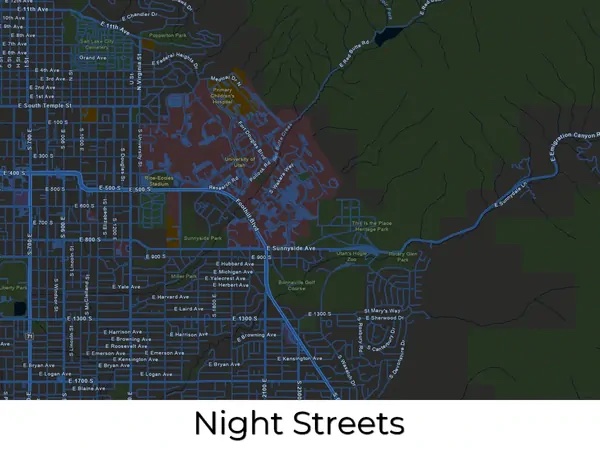
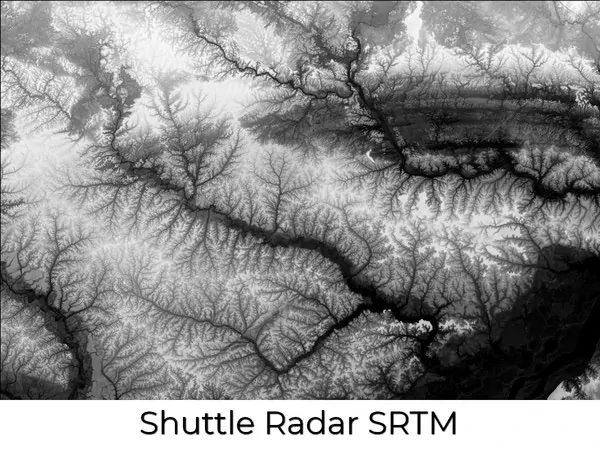
Map Design Styles of NOAA Maps
Many design styles, or base maps, serve as a starting point for your NOAA map. We source and create our base maps using the same digital tools that expert cartographers use to create maps. Once you have selected your base map, everything else is fully customizable. We can layer informational text (such as landmarks or other points of interest) and even change the colors to suit your preferences.
Complex layers can be added such as streams and lakes, terrain, roads, and even more detail like political boundaries, religious, and other population-based demographics. Multiple layers can also be added to the same NOAA map. For example, community developers and city planners can benefit from a 3D map with layers that include parcel lines, existing building footprints, and utility lines. Take a look at the map style categories below for inspiration.
Technology and Materials Used in NOAA Maps
- With 3D printing technology, you are not limited to straight lines and boxes. The curves and cliffs are captured accurately and beautifully in astonishing detail.
- Your vision of the final 3D map determines which materials we will choose to produce the best results. We help you to determine the materials that best suit your project.
- We use fabrication technologies such as 3D printing, CNC cutting, and molding/casting.
- NOAA maps show incredible detail.
- Our maps are printed in full color (with over 17 million variations of color) for awe-inspiring presentations and displays. No painting required!
- Typically, we use a special process for finishing the sides of the raised relief maps in a suede-like material, similar to the finish of a jewelry box.
- Our in-house paint booth gives us flexibility in different types and grades of paint and finishing capabilities; we can provide UV-resistant coatings to protect the coloration of your 3M map for many years.
- We also offer customized additions to our 3D maps and models. Our in-house carpentry shop will build elegant bases, tables, or cabinetry to display any map you choose. Worried about dust? We can customize a case to protect your display as well. Our skilled artisans can hand-paint details to make your map a true work of art.
Pricing of Custom NOAA Maps
The price of 3D maps and models are generally based on your size requirements, specific design needs, and the amount of work it will take to produce. Each map is custom-built and charged for accordingly. The best way to determine cost is to email us, call us at 385-206-8700, or fill out the form below and let us bid on your project.
Get a Free Price Estimate for a Custom NOAA Map
Custom Fabrication Workflow

Common Questions & Answers
- What is the largest map you can fabricate? There is no limit to the size of a map we can build. There are practical limits that will impact shipping and installation, but we work closely with our customers on these special requirements.
- What type of 3D maps can you fabricate? All types. Satellite Maps, Terrain Maps, Topographical Maps, Raised Relief Maps, USGS Maps, Contour Maps, and many more.
- Can you fabricate with different technologies and materials? Yes. Our most common fabrication technology is 3D Printing, but we can also build 3D Maps with CNC Cutting, 3D Foam, Molding/Casting, Thermoforming, and Sculpting.
- What materials can you 3D print in? We match the correct material and fabrication process to your requirements in terms of presentation, size, and transportability. We can 3D print in PLA, FDM, Full-Color Sandstone, UV-cured resin, plastic, rubber-like, acrylic, and nylon – as well as combining multiple technologies.
- Can you sign a Non-disclosure Agreement that you supply? Yes.
- How long will it take to create my map? That depends on the design and size of the map. A more complex or detailed map will take longer than a simple map, we can’t really say exactly how long it will take until we have the chance to understand what type of map you want fabricated. Generally, smaller standard maps can be a couple of weeks and large museum exhibition maps can be 6 months.
- What do you need from me to start the map fabrication?
Boundaries are a good place to start. Determining map styles, sizes, height (may be exaggerated), and cabinetry needs are all part of the process. Special design features can also be added. - Can you add homes, buildings, swimming pools, arbors, hardscaping features, etc.? Yes. We can 3D print many of these items and include them in our maps. We refer to these more complex maps as architectural dioramas.
- What are NOAA maps? NOAA maps are maps created by the National Oceanic and Atmospheric Administration (NOAA) of the United States. These maps are used to visualize weather and environmental data such as temperature, precipitation, wind speed, ocean currents, and more. They are used by meteorologists, researchers, and the general public to monitor and predict weather patterns, track storms, and study climate change.
NOAA maps are an important tool for weather forecasting and emergency management. They are available to the public through the NOAA website and other online platforms, and can be used to plan outdoor activities, assess flood risk, and make other important decisions related to weather and environmental conditions.
- What do NOAA maps show? NOAA maps show a wide range of weather and environmental data that is collected and monitored by the National Oceanic and Atmospheric Administration (NOAA) of the United States. Some of the key data that NOAA maps display include:
Temperature: NOAA maps can show the current temperature and temperature trends across different regions, which can be useful for understanding climate patterns and predicting heat waves or cold snaps.
Precipitation: These maps can show current precipitation levels, such as rainfall or snowfall, and can help forecasters predict flooding or drought conditions.
Wind: NOAA maps can show wind patterns and speeds, which are important for predicting severe weather events such as hurricanes, tornadoes, and thunderstorms.
Ocean currents: These maps can display the direction and strength of ocean currents, which are important for shipping and navigation, as well as for understanding the impacts of climate change on the world’s oceans.
Atmospheric conditions: NOAA maps can show atmospheric conditions such as humidity, air pressure, and ozone levels, which can have significant impacts on air quality and climate patterns.
- How are NOAA maps made? NOAA maps are created using a variety of data sources and advanced technologies to collect, process, and visualize weather and environmental data. Here are some of the key steps involved in making NOAA maps:
Data collection: NOAA collects data from a variety of sources, including weather satellites, radar systems, buoys, and weather stations. This data is transmitted in real-time to NOAA’s data centers for processing.
Data processing: NOAA uses advanced software and algorithms to process the data and convert it into usable formats for creating maps. This includes filtering out noise and errors in the data, interpolating missing data points, and converting raw data into meaningful visualizations.
Map creation: Once the data has been processed, NOAA scientists use specialized software to create maps that display the data in a way that is easy to interpret. This includes selecting the appropriate color schemes, scales, and other visual elements to make the maps as clear and informative as possible.
Quality control: Before NOAA maps are released to the public, they undergo rigorous quality control checks to ensure that they are accurate and reliable. This includes comparing the maps to other data sources and conducting statistical analyses to identify any outliers or errors.
- How do scientists collect data for NOAA maps? Scientists collect data for NOAA maps using a variety of technologies and techniques, depending on the type of data being collected. Here are some of the key methods used to collect data for NOAA maps:
Satellites: NOAA operates a network of weather satellites that collect data on temperature, precipitation, cloud cover, and other atmospheric conditions. These satellites can provide global coverage and can observe weather patterns in remote regions.
Radar systems: NOAA also operates a network of radar systems that use radio waves to detect precipitation and other weather phenomena. These radar systems can provide detailed information on the location, intensity, and movement of storms.
Buoys and weather stations: NOAA maintains a network of buoys and weather stations that collect data on air and water temperature, wind speed and direction, humidity, and other atmospheric and oceanic conditions. These data sources are particularly important for understanding regional weather patterns and ocean currents.
Aircraft: NOAA also uses aircraft to collect data on atmospheric conditions, particularly in regions where ground-based instruments are not available. These aircraft can carry specialized instruments that measure temperature, humidity, and other atmospheric variables.
- Who uses NOAA maps? NOAA maps are used by a wide range of individuals and organizations, including:
Meteorologists and weather forecasters: NOAA maps are an essential tool for meteorologists and weather forecasters who use the data to predict weather patterns, track storms, and issue warnings for severe weather events.
Emergency managers and responders: Emergency managers and responders use NOAA maps to monitor weather and environmental conditions that could pose a threat to public safety. This information can be used to prepare for and respond to natural disasters such as hurricanes, tornadoes, and wildfires.
Scientists and researchers: Scientists and researchers use NOAA maps to study climate patterns, ocean currents, and other environmental phenomena. This information can be used to understand the impacts of climate change and to develop strategies for mitigating its effects.
Government agencies and policymakers: Government agencies and policymakers use NOAA maps to make decisions related to public safety, resource management, and environmental policy. This information can be used to inform decisions related to infrastructure development, natural resource management, and disaster response.
General public: The general public can access NOAA maps through various online platforms, such as the NOAA website or mobile applications. These maps can be used to plan outdoor activities, assess flood risk, and make other important decisions related to weather and environmental conditions.
- How do I read NOAA maps? Reading NOAA maps may seem complex at first, but with a little practice, anyone can learn to interpret the information they provide. Here are some tips on how to read NOAA maps:
Understand the key symbols and colors: NOAA maps use a variety of symbols and colors to represent different weather and environmental conditions. For example, blue shades on a map may represent areas with low temperatures, while red or orange colors may indicate high temperatures. Be sure to read the map legend to understand the meanings of each symbol and color.
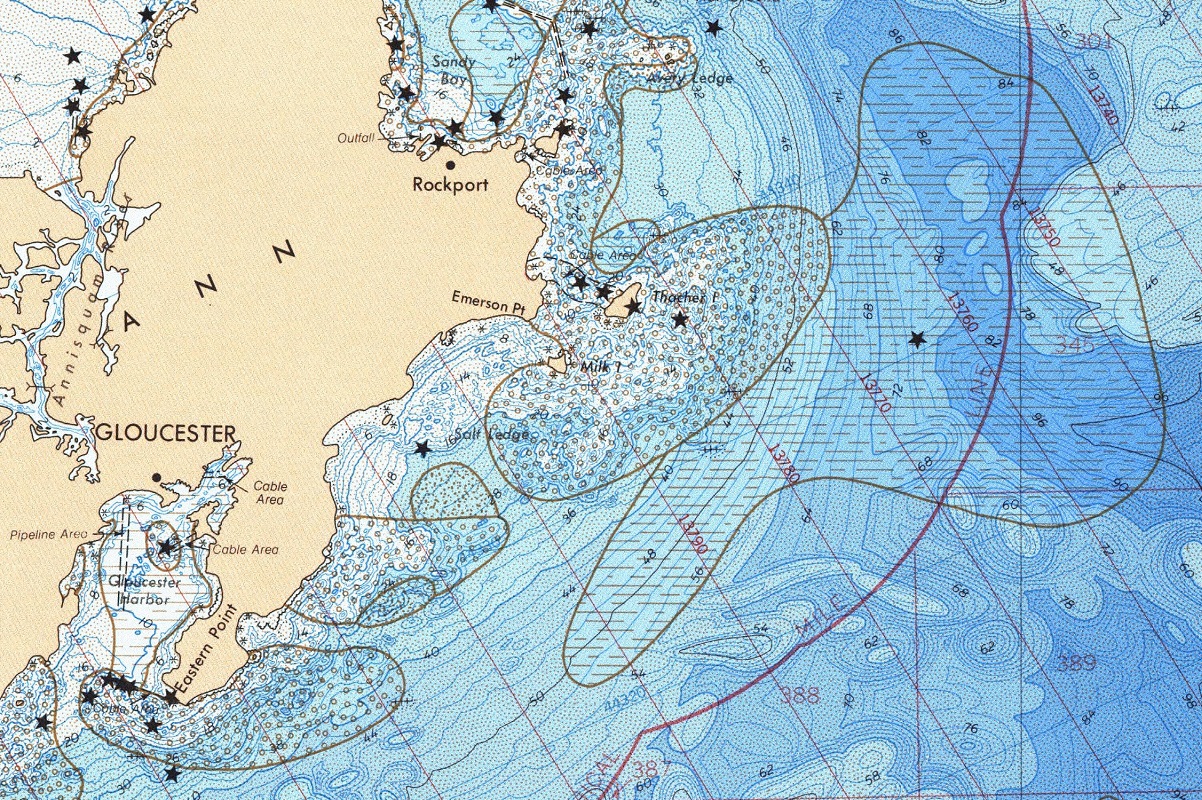
Pay attention to contour lines: Contour lines are lines on a map that connect points of equal value. For example, on a map of precipitation, contour lines may represent areas with the same amount of rainfall. These lines can help you understand patterns and trends in the data.
Look for patterns and trends: NOAA maps are designed to help you see patterns and trends in weather and environmental data. Look for areas with similar colors or symbols, or for changes in color or symbol patterns from one area to another. This can help you understand weather patterns and identify areas that may be at risk for severe weather.
Consider the scale of the map: NOAA maps can vary in scale, which can affect how you interpret the information. For example, a map of the United States will provide a broader perspective on weather patterns, while a map of a specific region may provide more detailed information.
Use additional resources: In addition to NOAA maps, there are many other resources available to help you interpret weather and environmental data. For example, you can check weather forecasts or read news articles about weather events to get a better understanding of how the data relates to current conditions.
Do you have a question we didn’t answer? Don’t hesitate to contact us at 1-385-206-8700 or [email protected].
Worldwide Delivery
WhiteClouds has delivered maps around the world.
History of NOAA Maps
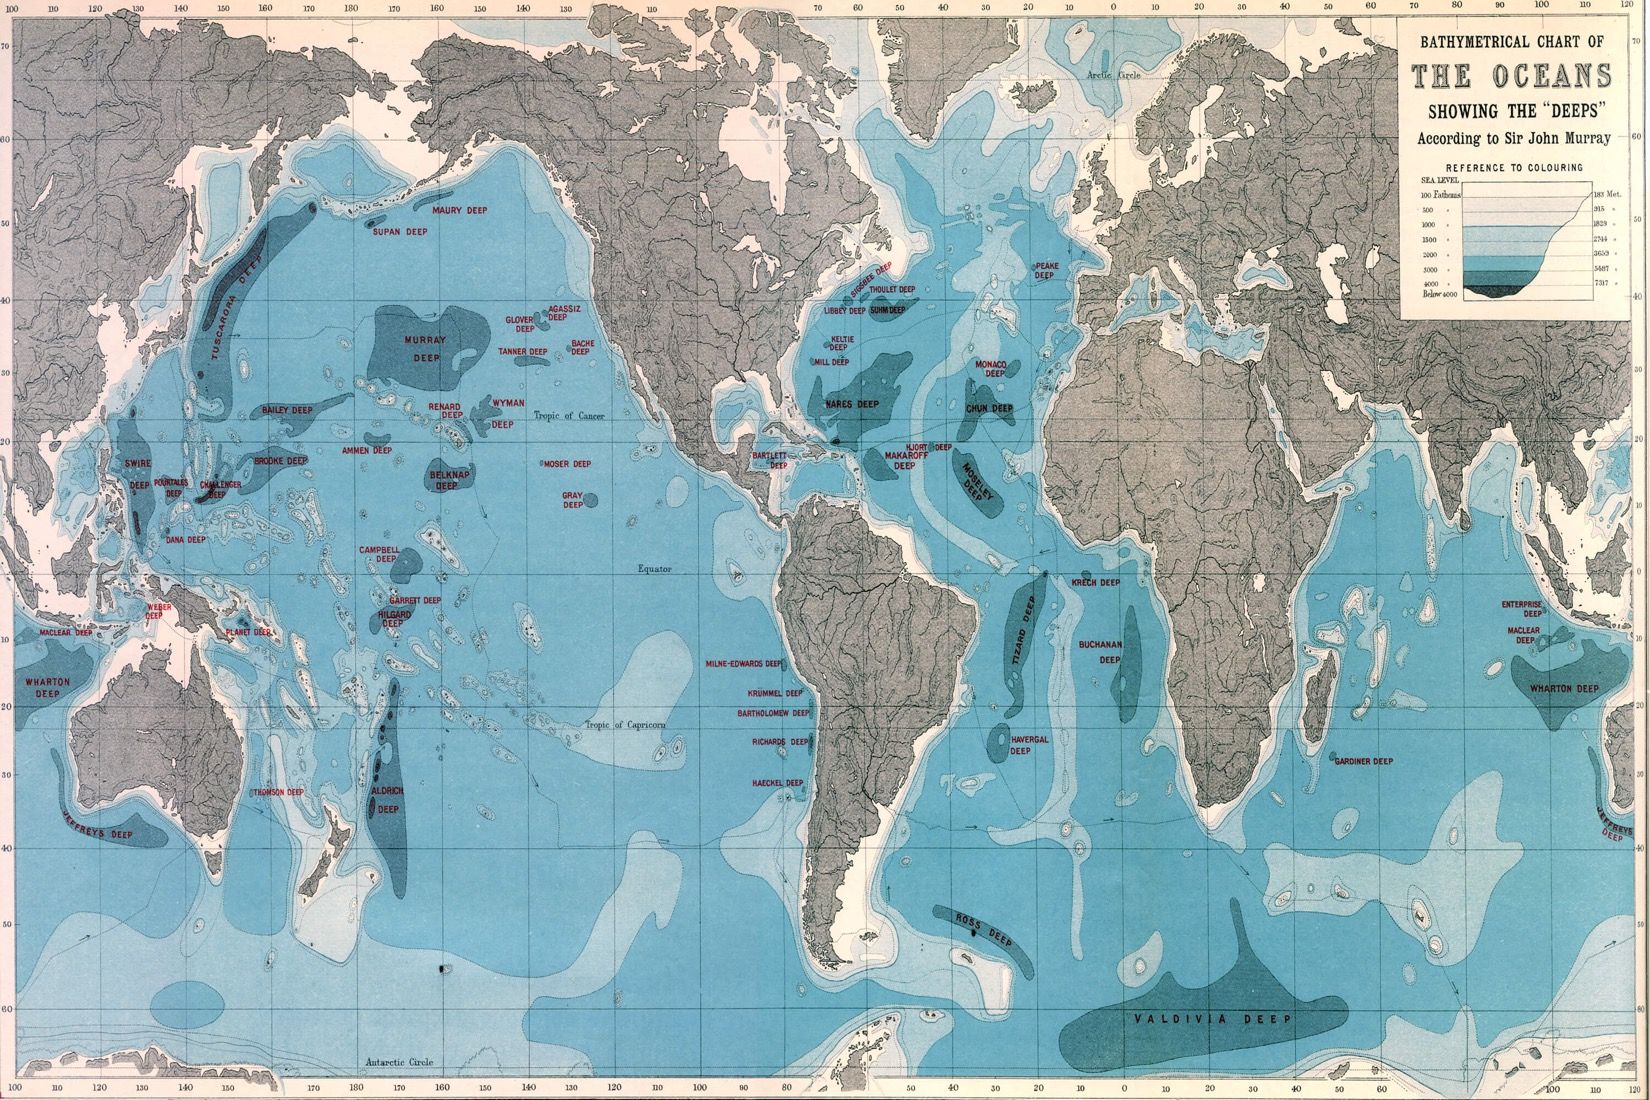
The history of NOAA (National Oceanic and Atmospheric Administration) maps can be traced back to the early 1800s, when sailors and cartographers began to develop maps and charts to navigate the Earth’s oceans. These early maps were rudimentary and often inaccurate, relying on limited technology and a lack of data to accurately depict the world’s waterways.
As the science of oceanography and meteorology developed in the late 19th and early 20th centuries, so too did the field of mapmaking. In 1807, the United States established the first government agency dedicated to charting the country’s waters, known as the United States Coast Survey. Over the next several decades, the Coast Survey and its successor agencies, such as the United States Hydrographic Office and the United States Weather Bureau, worked to develop more accurate and comprehensive maps of the Earth’s oceans and atmosphere.
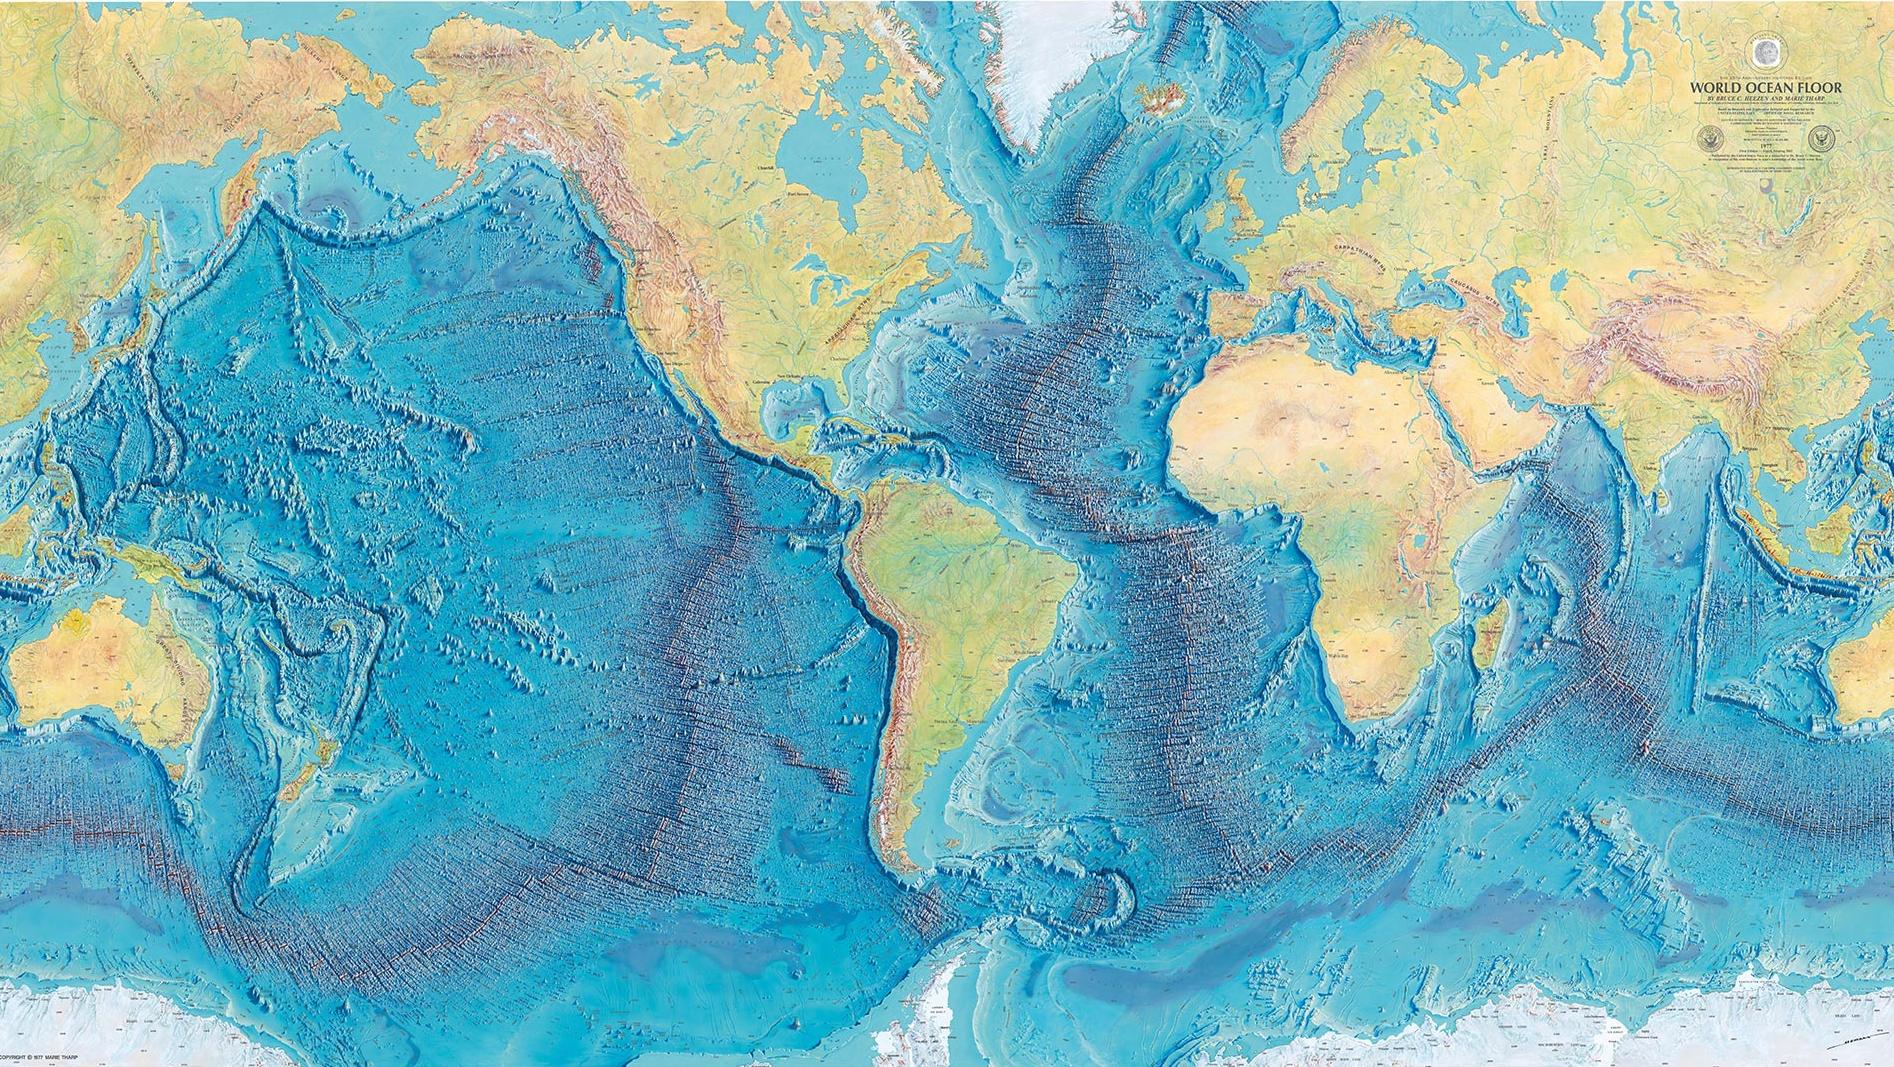
In 1970, these various agencies were consolidated into the newly formed National Oceanic and Atmospheric Administration (NOAA), which became responsible for producing a wide range of maps and charts related to the Earth’s natural systems. Over the past several decades, NOAA has continued to innovate and refine its mapmaking technology, incorporating advances in satellite imagery, remote sensing, and other technologies to produce more detailed and accurate maps of the Earth’s oceans, atmosphere, and weather patterns.
Today, NOAA maps are an essential resource for scientists, policymakers, and the public. With their ability to provide real-time data and imagery, historical context, and detailed information about our planet’s natural systems, these maps have revolutionized our understanding of the world’s oceans, weather patterns, and environmental changes. Whether used to study climate change, support disaster response efforts, or simply to explore and appreciate the beauty of our natural world, NOAA maps remain a critical tool for unlocking the secrets of the Earth’s complex and interconnected systems.
Looking ahead, it is clear that the importance of NOAA maps will only continue to grow. With the planet facing unprecedented environmental challenges, from rising sea levels to severe weather events, the need for accurate, comprehensive maps and data will be more important than ever. Fortunately, with NOAA at the forefront of mapmaking technology, we can be confident that we will continue to have access to the tools we need to navigate these complex issues and protect our planet’s natural resources for generations to come.